Explore
 Validate
 Learn
Learn Western blot
 Other assay
Antibody data
- Antibody Data
- Antigen structure
- References [1]
- Comments [0]
- Validations
- Other assay [1]
Submit
Validation data
Reference
Comment
Report error
- Product number
- PA5-13921 - Provider product page

- Provider
- Invitrogen Antibodies
- Product name
- ERN2 Polyclonal Antibody
- Antibody type
- Polyclonal
- Antigen
- Synthetic peptide
- Reactivity
- Human
- Host
- Rabbit
- Isotype
- IgG
- Vial size
- 400 μL
- Concentration
- 2 mg/mL
- Storage
- Store at 4°C short term. For long term storage, store at -20°C, avoiding freeze/thaw cycles.
Submitted references IRE1β negatively regulates IRE1α signaling in response to endoplasmic reticulum stress.
Grey MJ, Cloots E, Simpson MS, LeDuc N, Serebrenik YV, De Luca H, De Sutter D, Luong P, Thiagarajah JR, Paton AW, Paton JC, Seeliger MA, Eyckerman S, Janssens S, Lencer WI
The Journal of cell biology 2020 Feb 3;219(2)
The Journal of cell biology 2020 Feb 3;219(2)
No comments: Submit comment
Supportive validation
- Submitted by
- Invitrogen Antibodies (provider)
- Main image
- Experimental details
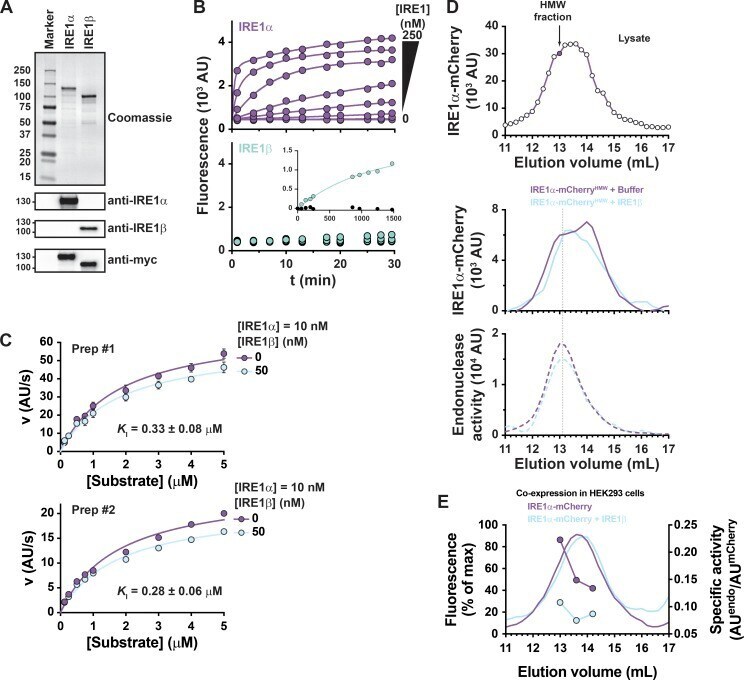
- Figure 6. IRE1beta inhibits IRE1alpha endonuclease activity in vitro. (A) Samples of affinity-purified full-length IRE1alpha and IRE1beta were separated on SDS-PAGE and stained with Coomassie blue or assayed by immunoblot with anti-IRE1alpha, anti-IRE1beta, or anti-Myc antibodies. (B) In vitro endonuclease activity was assayed by monitoring cleavage of fluorescent reporter substrate (10 nM) over time for indicated concentrations of (top, purple) IRE1alpha or (bottom) IRE1beta. Bottom, inset: Endonuclease activity monitored over 24 h for 250 nM IRE1beta (light green) or buffer control (black circles). (C) Steady-state kinetics were assayed by measuring progress curves for 10 nM IRE1alpha or 10 nM IRE1alpha + 50 nM IRE1beta as a function of reporter substrate concentration. Kinetic data are plotted as initial reaction velocity versus substrate concentration. Data were measured for two independent preparations of purified protein, with symbols representing mean +- SEM for three independent measures for preparation 1 (Prep#1) or values from a single measurement for preparation 2 (Prep#2). Solid lines represent best fit of a noncompetitive inhibitor model to the kinetic data. (D) Top: Gel filtration chromatogram for lysate of HEK293 cells expressing IRE1alpha-mCherry. A high-molecular-weight (HMW) fraction (indicated by filled symbol in top panel) was incubated with either buffer (purple traces) or purified IRE1beta (100 nM, light blue traces), reinjected on gel filtration, and as