Explore
 Validate
 Learn
Learn Western blot
 Other assay
Antibody data
- Antibody Data
- Antigen structure
- References [1]
- Comments [0]
- Validations
- Other assay [4]
Submit
Validation data
Reference
Comment
Report error
- Product number
- PA5-99824 - Provider product page

- Provider
- Invitrogen Antibodies
- Product name
- IFI6 Polyclonal Antibody
- Antibody type
- Polyclonal
- Antigen
- Synthetic peptide
- Description
- Antibody detects endogenous levels of total IFI6.
- Reactivity
- Human
- Host
- Rabbit
- Isotype
- IgG
- Vial size
- 100 μL
- Concentration
- 1 mg/mL
- Storage
- -20°C
Submitted references IFI6 depletion inhibits esophageal squamous cell carcinoma progression through reactive oxygen species accumulation via mitochondrial dysfunction and endoplasmic reticulum stress.
Liu Z, Gu S, Lu T, Wu K, Li L, Dong C, Zhou Y
Journal of experimental & clinical cancer research : CR 2020 Jul 29;39(1):144
Journal of experimental & clinical cancer research : CR 2020 Jul 29;39(1):144
No comments: Submit comment
Supportive validation
- Submitted by
- Invitrogen Antibodies (provider)
- Main image
- Experimental details
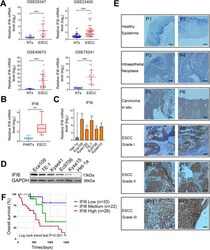
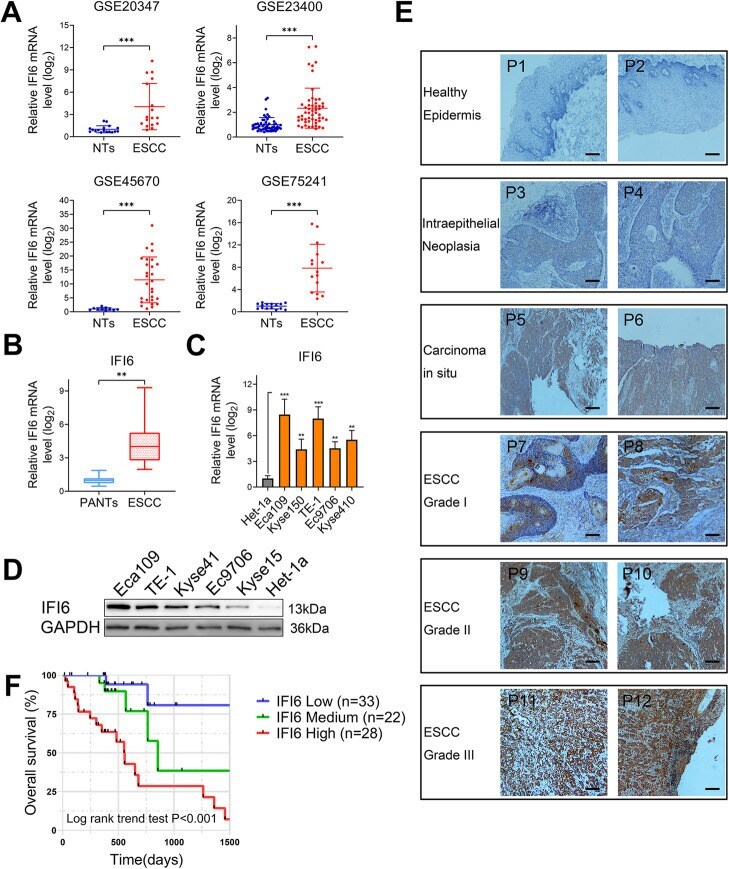
- Fig. 1 IFI6 expression is elevated in ESCC and predicts a poor prognosis. a . IFI6 expression levels in ESCC tissues vs. non-tumorous tissues (NTs) were analyzed using the GEO database (GEO accession no. GSE20347, no. GSE23400, no. GSE45670 and no. GSE75241). The data were normalized to IFI6 expression in NTs and are presented as the means and SDs. Statistical significance was determined by a modified t-test (implemented via the limma package in R). *** P < 0.005. b . Relative IFI6 mRNA levels in 23 ESCC tissues and paired adjacent non-tumorous tissues (PANTs) were measured via RT-PCR. The data were normalized to IFI6 expression in PANTs and are presented as the means and SDs ( n = 3). Statistical significance was determined by a two-tailed Student's t-test. ** P < 0.01. c . IFI6 mRNA levels in the esophageal squamous epithelial cell line Het-1a as well as a panel of ESCC cell lines. The data were normalized to IFI6 expression in Het-1a cells and are presented as the means and SDs ( n = 3). Statistical significance was determined by two-tailed Student's t-test. ** P < 0.01, ***P < 0.005. d . Representative Western blot showing the protein abundance of IFI6 in the esophageal squamous epithelial cell line Het-1a as well as a panel of ESCC cell lines. GAPDH was used as the loading control. e . Representative immunohistochemical images in the healthy human esophageal epidermis, esophageal hyperplasia and ESCC tissues at increasing disease stages; P1-P12 indicate the donor number.
- Submitted by
- Invitrogen Antibodies (provider)
- Main image

- Experimental details
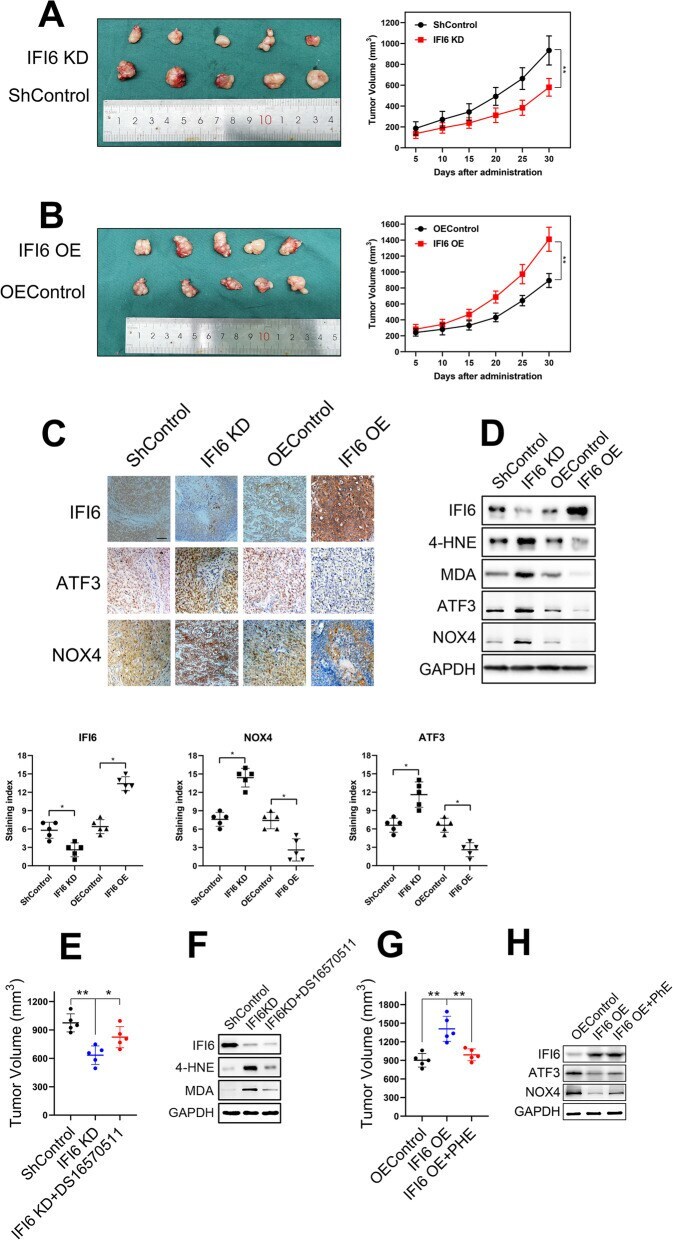
- Fig. 10 IFI6 promotes the growth of xenograft tumors from Eca109 cells. a - b . Representative image of fresh tumor tissues and tumor size quantification results in the xenograft model. Athymic nude mice were inoculated with the indicated Eca109 cells, and the tumor volumes (mm 3 ) were calculated every 5 days during implantation. The data are presented as the means and SDs ( n = 5). Statistical significance was determined by two-tailed Student's t-test. **P < 0.01. c . Representative image (upper) and quantitative results (bottom) of the IHC measuring the abundance of IFI6, ATF3 and NOX4 in indicated tumor tissues derived from xenograft model. Magnification: 40x. Scale bar: 50 mum. Statistical significance was determined by Mann-Whitney test. * P < 0.5. d . Representative immunoblot showing IFI6, ATF3, NOX4 and ROS markers in indicated tumor tissues derived from xenograft model. GAPDH was used as the loading control. e. Tumor size quantification results in the xenograft model. The data are presented as the means and SDs (n = 5). Statistical significance was determined by two-tailed Student's t-test. **P < 0.01. f . Representative immunoblot showing IFI6 and ROS markers in indicated tumor tissues derived from xenograft model. GAPDH was used as the loading control. g . Tumor size quantification results in the xenograft model. The data are presented as the means and SDs (n = 5). Statistical significance was determined by two-tailed Student's t-test. **P < 0.01. h . Representati
- Submitted by
- Invitrogen Antibodies (provider)
- Main image
- Experimental details
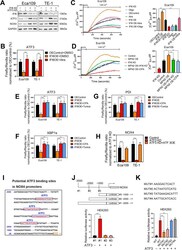
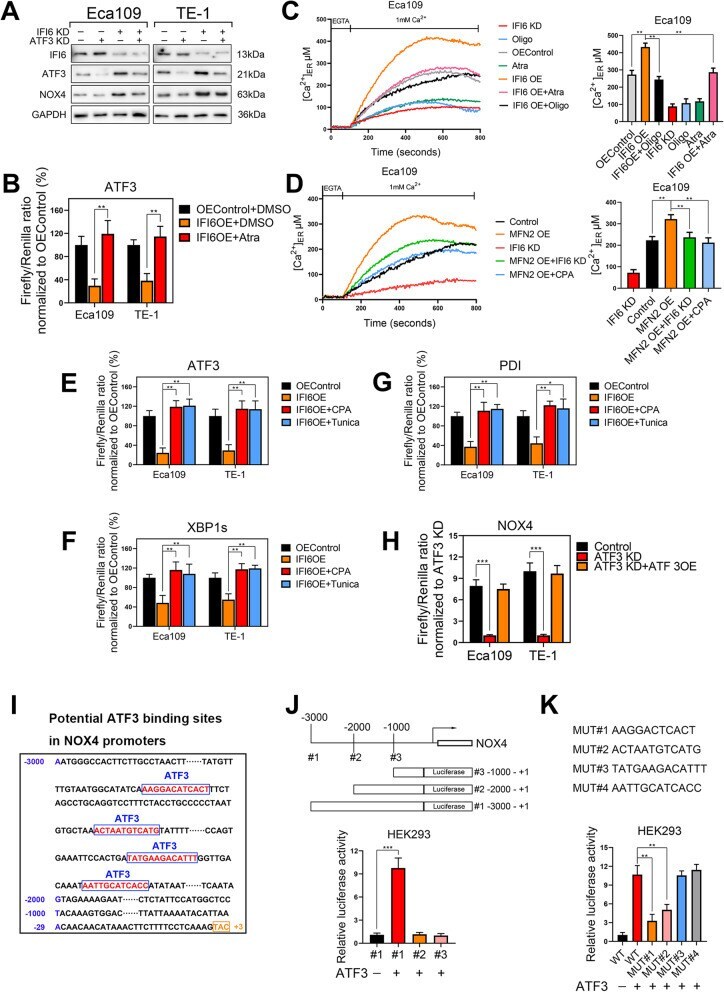
- Fig. 9 IFI6 silencing-induced ATP shortage activates ER stress by disrupting Ca 2+ storage of ER and subsequently induces NOX4 up-regulation in an ATF3-dependent manner. a . Protein lysates were collected from the indicated Eca109 and TE-1 cells and subjected to immunoblotting to assess the expression of IFI6, ATF3 and NOX4. GAPDH was used as the loading control. b. ATF3 transcriptional activity was measured via a dual luciferase reporter assay in indicated ESCC cells. The data are presented as the means and SDs (n = 3). Statistical significance was determined by two-tailed Student's t-test. ***P < 0.005. c-d . Representation (left) and statistical analysis (right) of the Endoplasmic reticulum Ca 2+ in the indicated ESCC cells. Endoplasmic reticulum-targeted aequorin was exploited to monitor dynamic changes in free Ca 2+ concentration in ER. The fluorescence intensity at each time point was recorded with an integrated spectrofluorometer. The data are presented as the means and SDs (n = 3). Statistical significance was determined by two-tailed Student's t-test. ** P < 0.01. e-g . Transcriptional activity of ATF3 ( e ), XBP1s ( f ) and PDI ( g ) was measured via a dual luciferase reporter assay in indicated ESCC cells. The data are presented as the means and SDs (n = 3). Statistical significance was determined by two-tailed Student's t-test. ***P < 0.005. h . A dual luciferase reporter assay was used to determine NOX4 transcriptional activity. The relative luciferase activity w
- Submitted by
- Invitrogen Antibodies (provider)
- Main image

- Experimental details
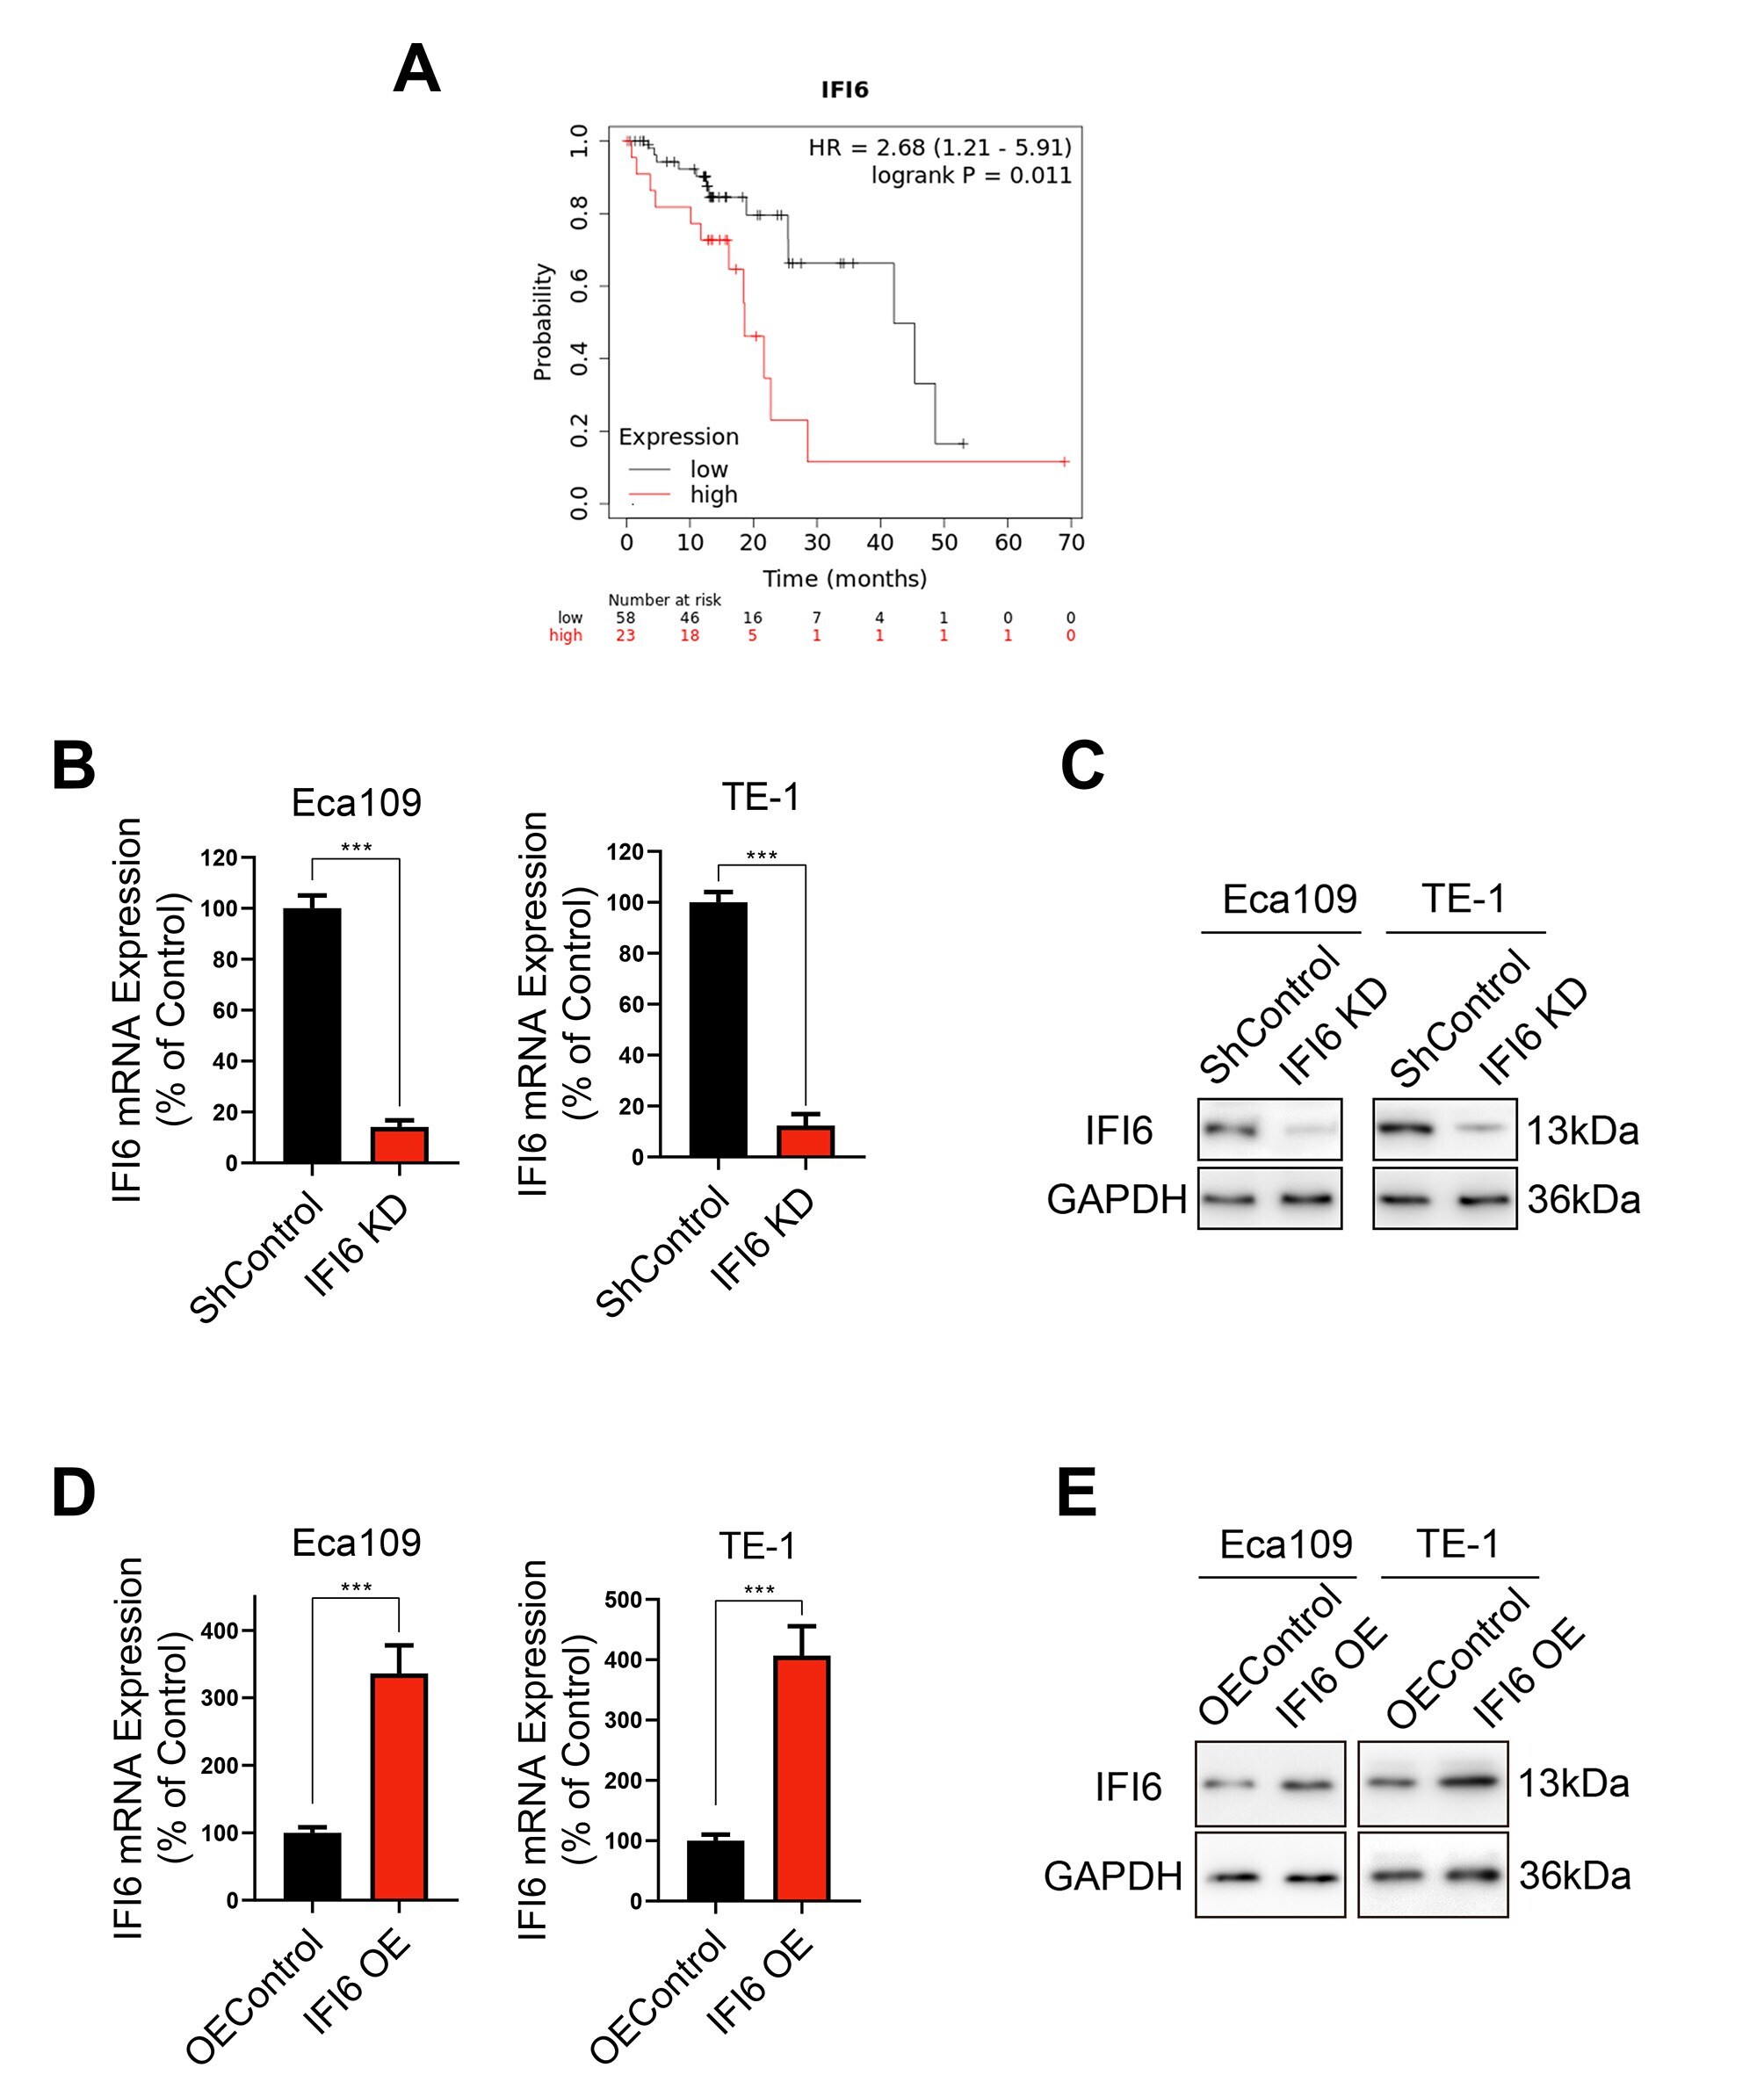
- Additional file 1: Figure S1 . IFI6 expression in ESCC cells transfected with IFI6 construct or IFI6-ShRNA and its prognostic value in ESCC. A. Plots visualizing the Kaplan-Meier analysis and log-rank test for ESCC patients from the TCGA database separated into groups with high or low expression levels of IFI6. Statistical significance was determined via the log-rank test. B. mRNA levels of IFI6, as measured by qRT-PCR, in two ESCC cell lines after shRNA-mediated depletion of IFI6. Data were normalized to the expression of IFI6 in ShControl cells and are presented as the means and SDs (n=3). Statistical significance was determined by a two-tailed Student's t-test. ***P