Explore
 Validate
 Learn
Learn Western blot
 ELISA
ELISA Immunocytochemistry
Antibody data
- Antibody Data
- Antigen structure
- References [5]
- Comments [0]
- Validations
- Immunocytochemistry [2]
- Other assay [5]
Submit
Validation data
Reference
Comment
Report error
- Product number
- 36-2600 - Provider product page

- Provider
- Invitrogen Antibodies
- Product name
- GRP94 Polyclonal Antibody
- Antibody type
- Polyclonal
- Antigen
- Synthetic peptide
- Reactivity
- Human, Mouse, Rat
- Host
- Rabbit
- Isotype
- IgG
- Vial size
- 100 µg
- Concentration
- 0.25 mg/mL
- Storage
- -20°C
Submitted references Small Extracellular Vesicles from Head and Neck Squamous Cell Carcinoma Cells Carry a Proteomic Signature for Tumor Hypoxia.
Activation of (pro)renin by (pro)renin receptor in extracellular vesicles from osteoclasts.
Grp94 Regulates the Recruitment of Aneural AChR Clusters for the Assembly of Postsynaptic Specializations by Modulating ADF/Cofilin Activity and Turnover.
Characterization of Regulatory Extracellular Vesicles from Osteoclasts.
Inhibitors of cathepsins B and L induce autophagy and cell death in neuroblastoma cells.
Głuszko A, Szczepański MJ, Whiteside TL, Reichert TE, Siewiera J, Ludwig N
Cancers 2021 Aug 19;13(16)
Cancers 2021 Aug 19;13(16)
Activation of (pro)renin by (pro)renin receptor in extracellular vesicles from osteoclasts.
Murray JB, Mikhael C, Han G, de Faria LP, Rody WJ Jr, Holliday LS
Scientific reports 2021 Apr 28;11(1):9214
Scientific reports 2021 Apr 28;11(1):9214
Grp94 Regulates the Recruitment of Aneural AChR Clusters for the Assembly of Postsynaptic Specializations by Modulating ADF/Cofilin Activity and Turnover.
Chan ZC, Deng L, Lee CW
eNeuro 2020 Sep Oct;7(5)
eNeuro 2020 Sep Oct;7(5)
Characterization of Regulatory Extracellular Vesicles from Osteoclasts.
Huynh N, VonMoss L, Smith D, Rahman I, Felemban MF, Zuo J, Rody WJ Jr, McHugh KP, Holliday LS
Journal of dental research 2016 Jun;95(6):673-9
Journal of dental research 2016 Jun;95(6):673-9
Inhibitors of cathepsins B and L induce autophagy and cell death in neuroblastoma cells.
Cartledge DM, Colella R, Glazewski L, Lu G, Mason RW
Investigational new drugs 2013 Feb;31(1):20-9
Investigational new drugs 2013 Feb;31(1):20-9
No comments: Submit comment
Supportive validation
- Submitted by
- Invitrogen Antibodies (provider)
- Main image
- Experimental details
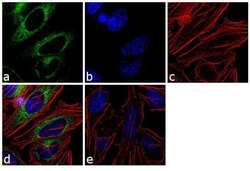
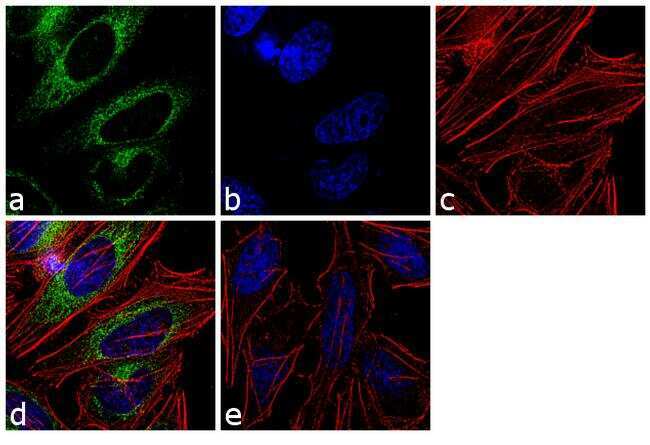
- Immunofluorescence analysis of GRP94 Polyclonal Antibody was performed using 70% confluent log phase HeLa cells. The cells were fixed with 4% paraformaldehyde for 10 minutes, permeabilized with 0.1% Triton X-100 for 10 minutes, and blocked with 1% BSA for 1 hour at room temperature. The cells were labeled with GRP94 Rabbit Polyclonal Antibody (Product # 36-2600) at 2 µg/mL in 0.1% BSA and incubated for 3 hours at room temperature and then labeled with Goat anti-Rabbit IgG (H+L) Superclonal Secondary Antibody, Alexa Fluor® 488 conjugate (Product # A27034) at a dilution of 1:2000 for 45 minutes at room temperature (Panel a: green). Nuclei (Panel b: blue) were stained with SlowFade® Gold Antifade Mountant with DAPI (Product # S36938). F-actin (Panel c: red) was stained with Rhodamine Phalloidin (Product # R415, 1:300). Panel d represents the merged image showing cytoplasmic localization. Panel e shows the no primary antibody control. The images were captured at 60X magnification.
- Submitted by
- Invitrogen Antibodies (provider)
- Main image

- Experimental details
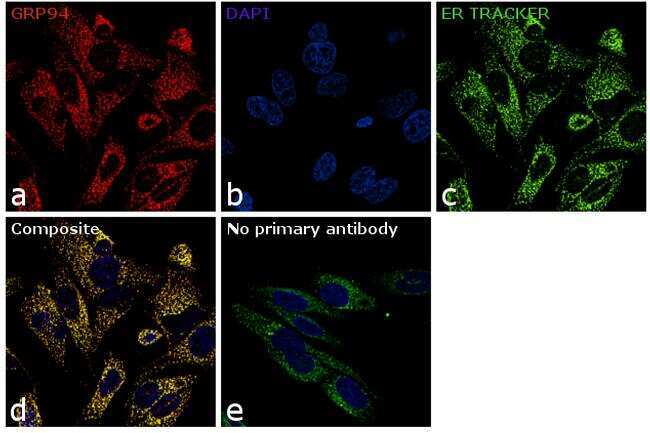
- Immunofluorescence analysis of GRP94 was performed using 70% confluent log phase HeLa cells. The cells were fixed with 4% paraformaldehyde for 10 minutes, permeabilized with 0.1% Triton™ X-100 for 10 minutes, and blocked with 1% BSA for 1 hour at room temperature. The cells were labelled with GRP94 Polyclonal Antibody (Product # 36-2600) at 5µg/mL in 0.1% BSA and incubated at 4 degree Celsius overnight and then labeled with Donkey anti-Rabbit IgG (H+L) Highly Cross-Adsorbed Secondary Antibody, Alexa Fluor® 555 conjugate (Product # 36-2600) at a dilution of 1:1000 for 45 minutes at room temperature (Panel a: red). Nuclei (Panel b: blue) were stained with SlowFade® Gold Antifade Mountant with DAPI (Product # S36938). Endoplasmic reticulum (Panel c: green) was stained with ER Staining Kit - Green Fluorescence - Cytopainter. Panel d represents the merged image showing co-localization of GRP94 with ER-tracker. Panel e shows the no primary antibody control. The images were captured at 60X magnification.
Supportive validation
- Submitted by
- Invitrogen Antibodies (provider)
- Main image
- Experimental details
- NULL

- Submitted by
- Invitrogen Antibodies (provider)
- Main image
- Experimental details
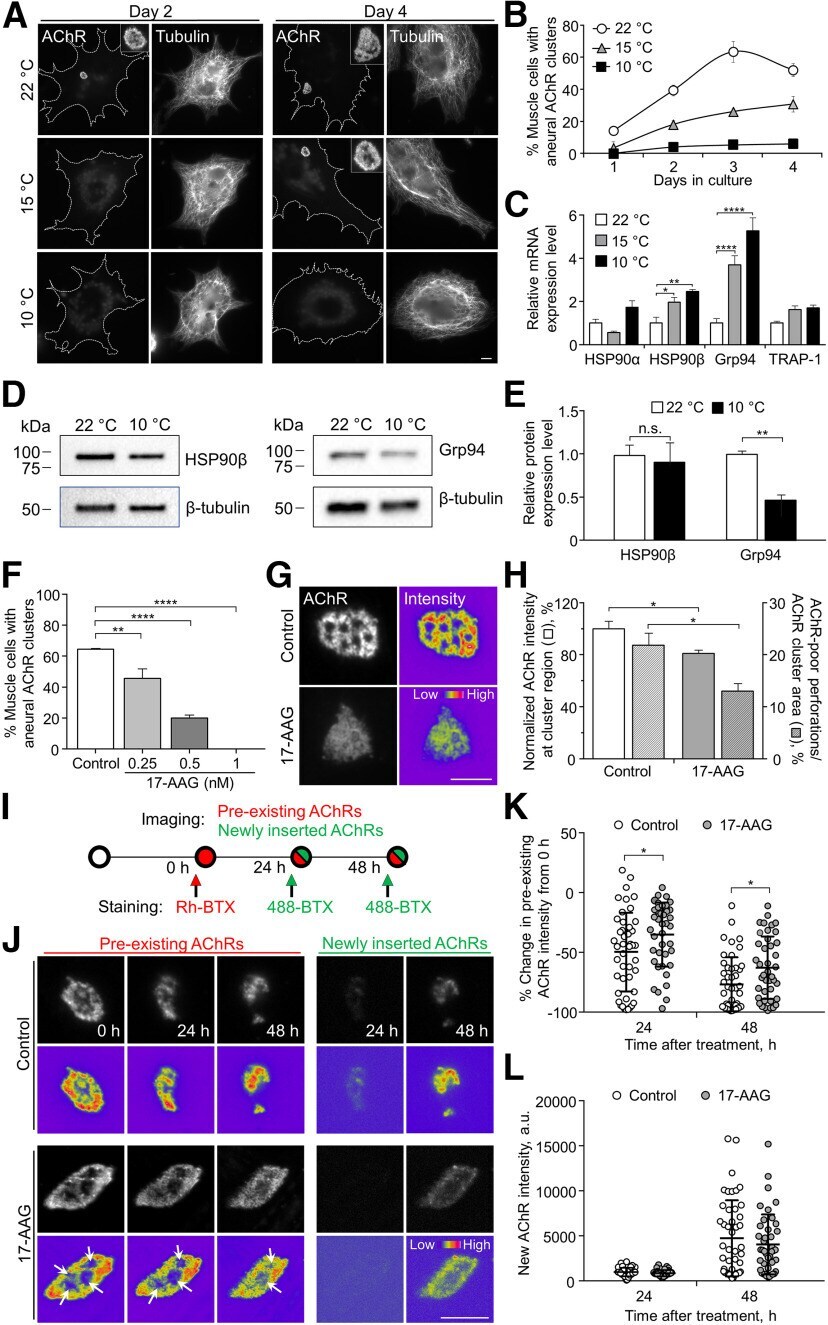
- Figure 1. Temperature stress-modulated expression and pharmacological inhibition of HSP90 regulate the formation and stability of aneural AChR clusters. A , Representative images showing the inhibition of aneural AChR cluster formation in cultured Xenopus muscle cells treated with lower temperatures. Tubulin immunostaining indicated that cytoskeletal structures were largely unaffected in muscle cells cultured at different temperatures, ranging from 10-22degC. B , Quantification showing the percentage of cultured muscle cells with bottom aneural AChR clusters at different culturing temperatures over 4 d; n = 150 cells in each condition from three independent experiments. C , Quantification showing the relative mRNA levels of HSP90alpha, HSP90beta, Grp94, and TRAP-1 in 2-d-old Xenopus muscle cells cultured at different temperatures; n = 3 independent experiments. D , E , Western blot analysis ( D ) and quantification ( E ) showing the protein expression level of HSP90beta and Grp94 in Xenopus muscle cells cultured at 22degC or 10degC for 2 d. beta-Tubulin was used as the loading control for normalization. F , Quantification showing the dose-dependent effects of 17-AAG on aneural AChR cluster formation in cultured Xenopus muscle cells; n = 191 (Control), n = 198 (0.25 n m 17-AAG), n = 199 (0.5 n m 17-AAG), and n = 200 (1 n m 17-AAG) muscle cells from four independent experiments. G , Representative images showing the organization and intensity of aneural AChR clusters in respons
- Submitted by
- Invitrogen Antibodies (provider)
- Main image
- Experimental details
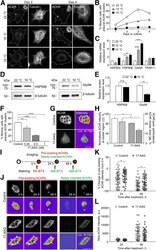
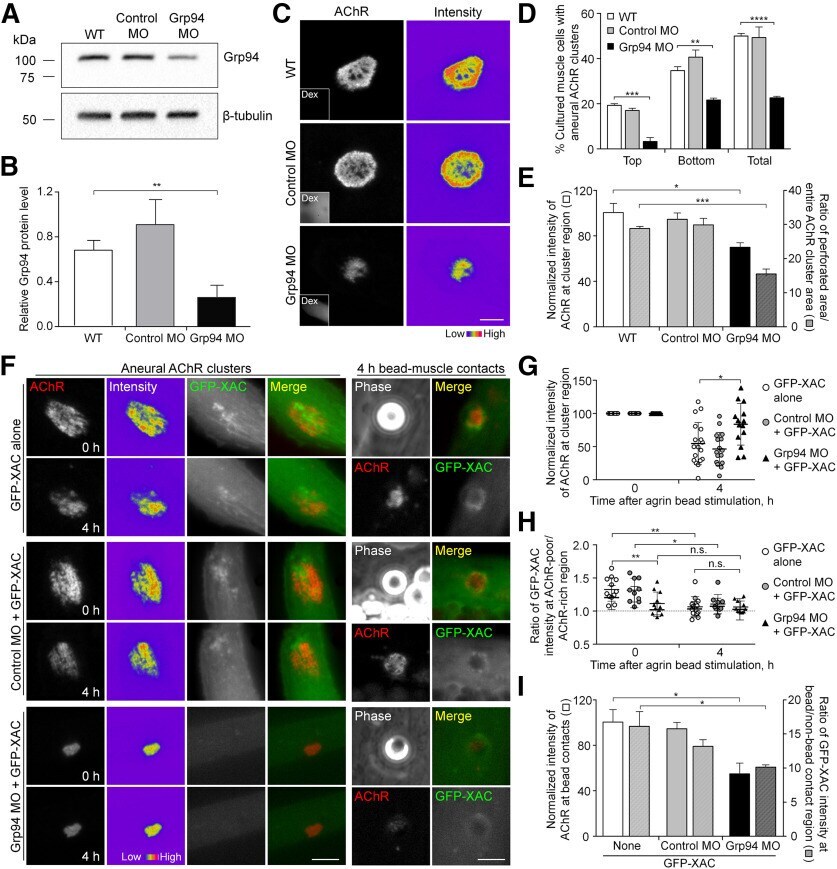
- Figure 3. Grp94 knock-down inhibits agrin bead-induced AChR clustering by modulating ADF/cofilin localization. A , B , Western blot analysis ( A ) and quantification ( B ) showing the expression level of Grp94 in WT, Control MO, and Grp94 MO embryos. beta-Tubulin was used as the loading control for normalization. C , Representative images showing the intensity and complexity of aneural AChR clusters in response to Grp94 knock-down. 8-bit pseudo-color images highlight the relative fluorescence intensity of AChR clusters in control versus Grp94 knock-down muscle cells. Insets show the fluorescent dextran (Dex) signals, indicating the presence of MO. D , Quantification showing the effects of MO-mediated Grp94 knock-down on the formation of aneural AChR clusters in cultured muscles; n = 150 (WT), n = 143 (Control MO), and n = 150 (Grp94 MO) muscle cells from three independent experiments. E , Quantification showing the effects of MO-mediated Grp94 knock-down on the intensity and complexity of aneural AChR clusters; n = 64 (WT), n = 47 (Control MO), and n = 52 (Grp94 MO) muscle cells from four independent experiments for fluorescence intensity measurement (left y -axis); n = 44 (WT), n = 42 (Control MO), and n = 44 (Grp94 MO) muscle cells from four independent experiments for cluster complexity measurement (right y -axis). F , Representative sets of time-lapse images showing the effects of Grp94 knock-down on GFP-XAC localization in association with the dispersal of aneural AChR c
- Submitted by
- Invitrogen Antibodies (provider)
- Main image
- Experimental details
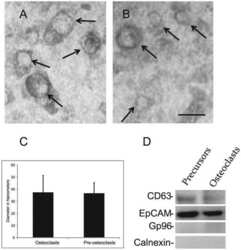
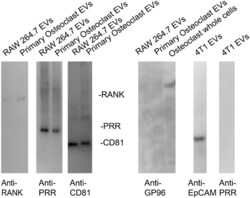
- Figure 2 Immunoblots show that EVs isolated from RAW 264.7 osteoclast-like cells and primary osteoclasts have similar levels of RANK and PRR. First panel shows pre- stained molecular weight markers transferred to Immobilon P. The second panel is shows immunoblots of 5 x 10 8 EVs isolated from conditioned media from RAW 264.7 osteoclast-like cells or primary osteoclasts stained with an anti-RANK antibody. The third panel shows staining the 5 x 10 8 EVs with an anti-PRR antibody. The fourth panel shows staining of 5 x 10 8 EVs with an anti-CD81 antibody. CD81 is a marker for EVs. The fifth panel shows an effort to stain 5 x 10 8 EVs with an anti-GP96 antibody, which supports that the EVs are not contaminated with material from the endoplasmic reticulum, a common contaminant. A whole cell extract lane from osteoclasts is presented to show that the anti-GP96 antibody works. The sixth panel shows that 4T1 EVs (1 x 10 8 ) have the expected protein marker EpCAM. The seventh panel demonstrates that we were unable to detect PRR in 1 x 10 8 EVs isolated from conditioned media of 4T1 cells. As previously reported, these data show EVs from mouse osteoclasts and osteoclast-like cells contain RANK and full length PRR. They demonstrate that the amount of PRR in EVs from 4T1 cells is much lower.

- Submitted by
- Invitrogen Antibodies (provider)
- Main image
- Experimental details
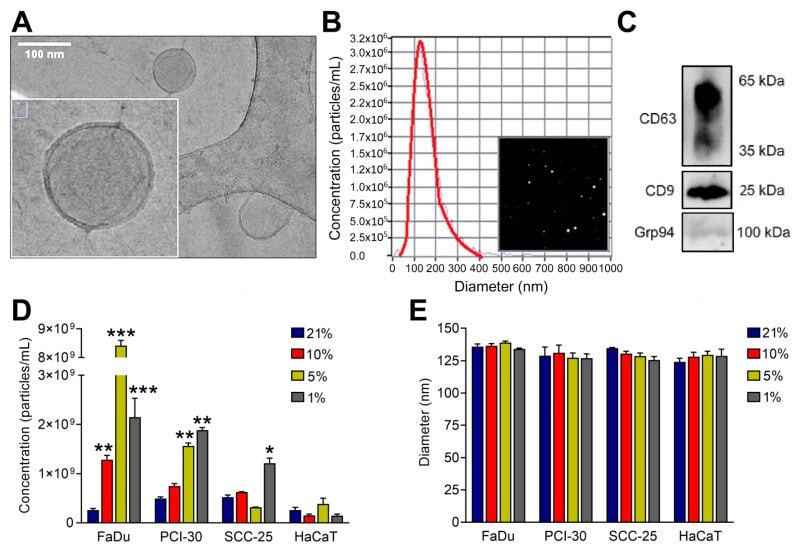
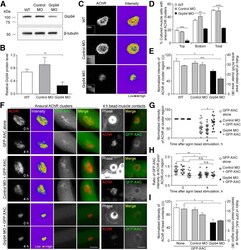
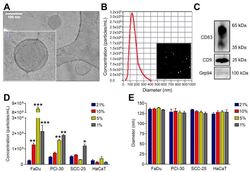
- Figure 1 Characterization of small extracellular vesicles (sEVs) derived from human Head and Neck Squamous Cell Carcinoma cell lines: FaDu (hypopharyngeal squamous cell carcinoma), PCI-30 (tongue squamous cell carcinoma), SCC-25 (tongue squamous cell carcinoma); and sEVs derived from HaCat (immortalized human keratinocytes). ( A ) Representative cryogenic transmission microscopy image of HNSCC cell-derived sEVs. ( B ) Representative concentration and size distribution plot of HNSCC-derived sEVs measured by nanoparticle tracking analysis (NTA) and particle visualization based on Brownian motions. ( C ) Immunoblotting of sEV markers CD63, CD9, and negative marker Grp94 in HNSCC-derived sEVs. Full blot images are presented in Figures S2-S4 . ( D ) Particle concentration related to normoxic (21% O 2 ) and hypoxic (1% O 2 , 5% O 2 , 10% O 2 ) conditions. Results were obtained using NTA and normalized to the protein levels in lysates of producer cells. ( E ) Particle diameter related to normoxic (21% O 2 ) and hypoxic (1% O 2 , 5% O 2 , 10% O 2 ) conditions. Results were obtained using NTA. All data represent three biological replicates and are presented as means +- SD. * p < 0.05 vs. 21%; ** p < 0.01 vs. 21%; *** p < 0.001 vs. 21%.