Explore
 Validate
 Learn
LearnPA1-844A
antibody from Invitrogen Antibodies
Targeting: NCOR1
hCIT529I10, hN-CoR, KIAA1047, MGC104216, N-CoR, PPP1R109, TRAC1
 Western blot
 Immunocytochemistry Immunoprecipitation Immunohistochemistry Flow cytometry Chromatin Immunoprecipitation Other assay
Antibody data
- Antibody Data
- Antigen structure
- References [23]
- Comments [0]
- Validations
- Immunocytochemistry [4]
- Immunohistochemistry [2]
- Flow cytometry [1]
- Other assay [13]
Submit
Validation data
Reference
Comment
Report error
- Product number
- PA1-844A - Provider product page

- Provider
- Invitrogen Antibodies
- Product name
- NCoR1 Polyclonal Antibody
- Antibody type
- Polyclonal
- Antigen
- Synthetic peptide
- Description
- PA1-844A detects human and mouse nuclear receptor corepressor (N-CoR). PA1-844A has been successfully used in Western blot, ICC/IF, IHC (P) and immunoprecipitation (ChIP) procedures. By Western blot, this antibody detects a protein at ~270 kDa representing N-CoR from HeLa cell extracts and mouse RAW 264.7/primary macrophages. This antibody is not recommended for mouse C2C12 cells in immunofluorescent applications. The PA1-844A immunogen is a synthetic peptide corresponding to residues C P(2427) A P L L S A Q Y E T L S D S D D(2443) of mouse N-CoR. This immunizing peptide (Cat. # PEP-061) is available for use in neutralization and control experiments.
- Reactivity
- Human, Mouse
- Host
- Rabbit
- Isotype
- IgG
- Vial size
- 50 μg
- Concentration
- 0.7 mg/mL
- Storage
- -20°C, Avoid Freeze/Thaw Cycles
Submitted references A cell type-specific expression map of NCoR1 and SMRT transcriptional co-repressors in the mouse brain.
YAP/TAZ deficiency reprograms macrophage phenotype and improves infarct healing and cardiac function after myocardial infarction.
PPARβ/δ recruits NCOR and regulates transcription reinitiation of ANGPTL4.
Adipocyte-specific Repression of PPAR-gamma by NCoR Contributes to Scleroderma Skin Fibrosis.
The corepressor NCOR1 regulates the survival of single-positive thymocytes.
Glucocorticoid Receptor:MegaTrans Switching Mediates the Repression of an ERα-Regulated Transcriptional Program.
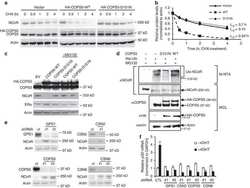
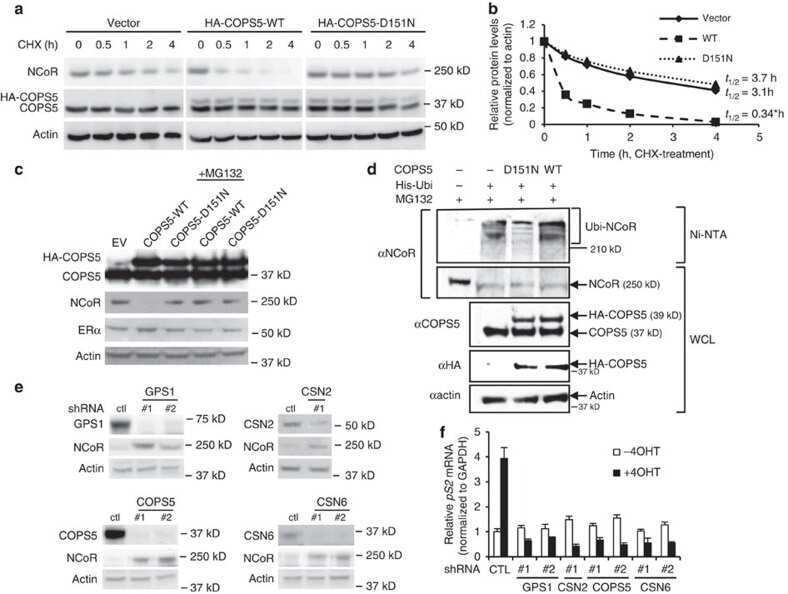
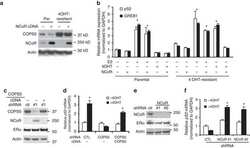
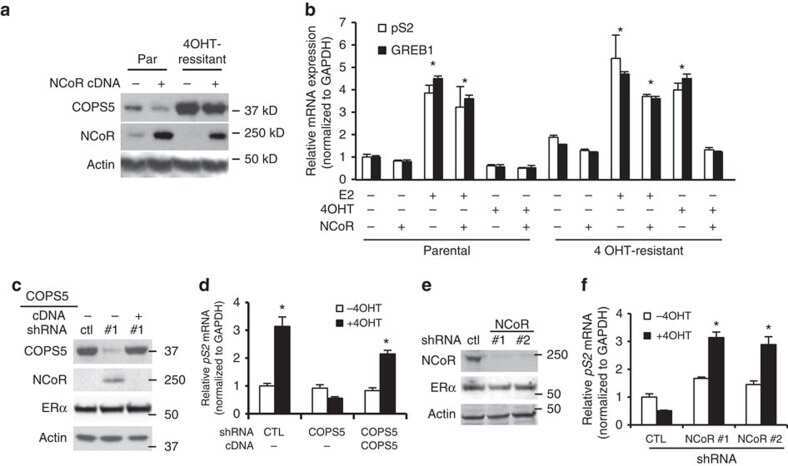
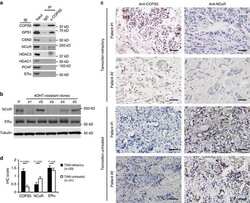
COPS5 amplification and overexpression confers tamoxifen-resistance in ERα-positive breast cancer by degradation of NCoR.
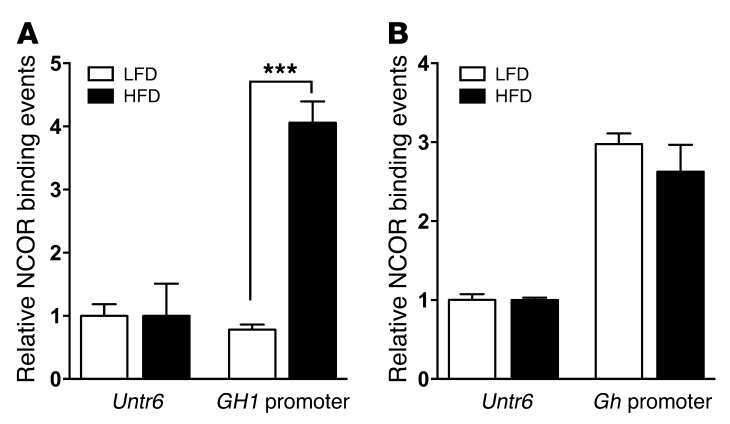
Energy homeostasis targets chromosomal reconfiguration of the human GH1 locus.
CtBP2 modulates the androgen receptor to promote prostate cancer progression.
Developmentally regulated GTP-binding protein 2 ameliorates EAE by suppressing the development of TH17 cells.
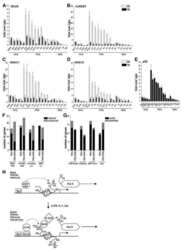
Acute hypoxia affects P-TEFb through HDAC3 and HEXIM1-dependent mechanism to promote gene-specific transcriptional repression.
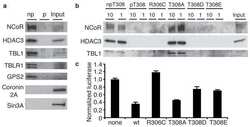
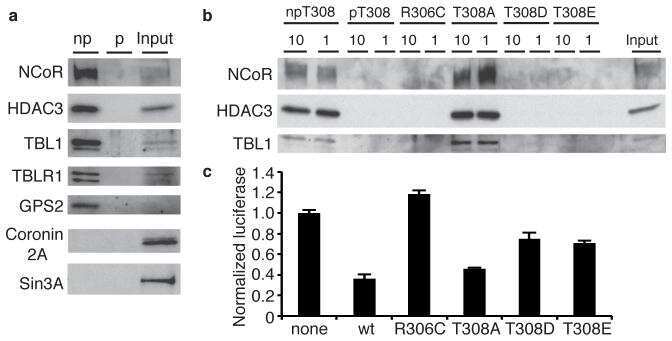
Activity-dependent phosphorylation of MeCP2 threonine 308 regulates interaction with NCoR.
Vitamin D receptor binds to the ε germline gene promoter and exhibits transrepressive activity.
Proteasomal degradation of retinoid X receptor alpha reprograms transcriptional activity of PPARgamma in obese mice and humans.
mTORC1 controls fasting-induced ketogenesis and its modulation by ageing.
Control of inducible gene expression by signal-dependent transcriptional elongation.
Electromagnetic fields alter the expression of estrogen receptor cofactors in breast cancer cells.
Phosphorylation of liver X receptor alpha selectively regulates target gene expression in macrophages.
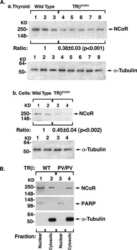
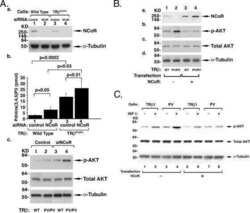
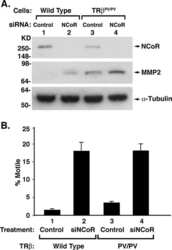
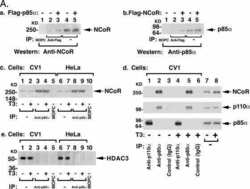
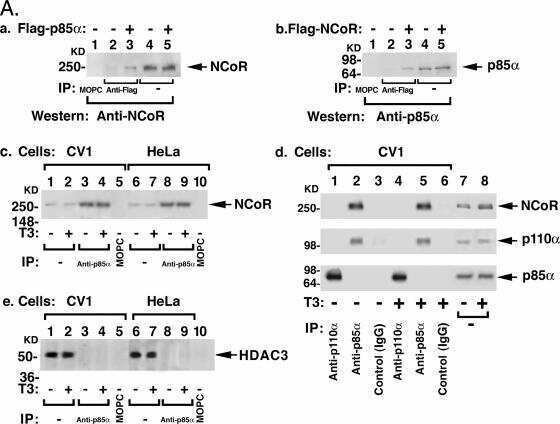
Nuclear receptor corepressor is a novel regulator of phosphatidylinositol 3-kinase signaling.
Amino-terminal domain of TIF2 is involved in competing for corepressor binding to glucocorticoid and progesterone receptors.
Thyroid hormone-mediated negative transcriptional regulation of Necdin expression.
A SUMOylation-dependent pathway mediates transrepression of inflammatory response genes by PPAR-gamma.
PPARgamma regulates adipocyte cholesterol metabolism via oxidized LDL receptor 1.
Iemolo A, Montilla-Perez P, Lai IC, Meng Y, Nolan S, Wen J, Rusu I, Dulcis D, Telese F
The Journal of comparative neurology 2020 Sep 1;528(13):2218-2238
The Journal of comparative neurology 2020 Sep 1;528(13):2218-2238
YAP/TAZ deficiency reprograms macrophage phenotype and improves infarct healing and cardiac function after myocardial infarction.
Mia MM, Cibi DM, Abdul Ghani SAB, Song W, Tee N, Ghosh S, Mao J, Olson EN, Singh MK
PLoS biology 2020 Dec;18(12):e3000941
PLoS biology 2020 Dec;18(12):e3000941
PPARβ/δ recruits NCOR and regulates transcription reinitiation of ANGPTL4.
Legrand N, Bretscher CL, Zielke S, Wilke B, Daude M, Fritz B, Diederich WE, Adhikary T
Nucleic acids research 2019 Oct 10;47(18):9573-9591
Nucleic acids research 2019 Oct 10;47(18):9573-9591
Adipocyte-specific Repression of PPAR-gamma by NCoR Contributes to Scleroderma Skin Fibrosis.
Korman B, Marangoni RG, Lord G, Olefsky J, Tourtellotte W, Varga J
Arthritis research & therapy 2018 Jul 11;20(1):145
Arthritis research & therapy 2018 Jul 11;20(1):145
The corepressor NCOR1 regulates the survival of single-positive thymocytes.
Müller L, Hainberger D, Stolz V, Hamminger P, Hassan H, Preglej T, Boucheron N, Sakaguchi S, Wiegers GJ, Villunger A, Auwerx J, Ellmeier W
Scientific reports 2017 Nov 21;7(1):15928
Scientific reports 2017 Nov 21;7(1):15928
Glucocorticoid Receptor:MegaTrans Switching Mediates the Repression of an ERα-Regulated Transcriptional Program.
Yang F, Ma Q, Liu Z, Li W, Tan Y, Jin C, Ma W, Hu Y, Shen J, Ohgi KA, Telese F, Liu W, Rosenfeld MG
Molecular cell 2017 May 4;66(3):321-331.e6
Molecular cell 2017 May 4;66(3):321-331.e6
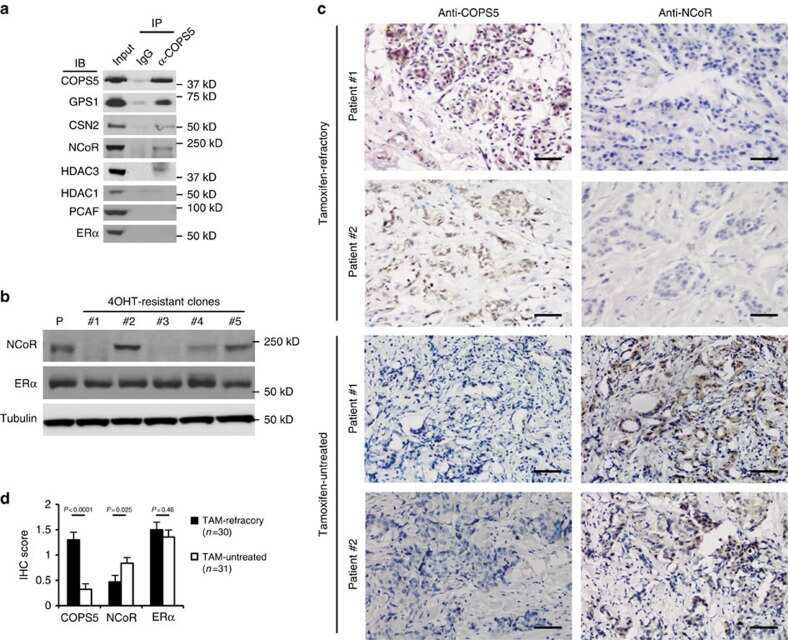
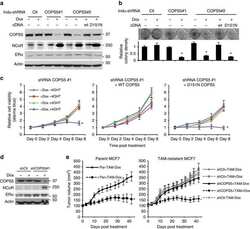
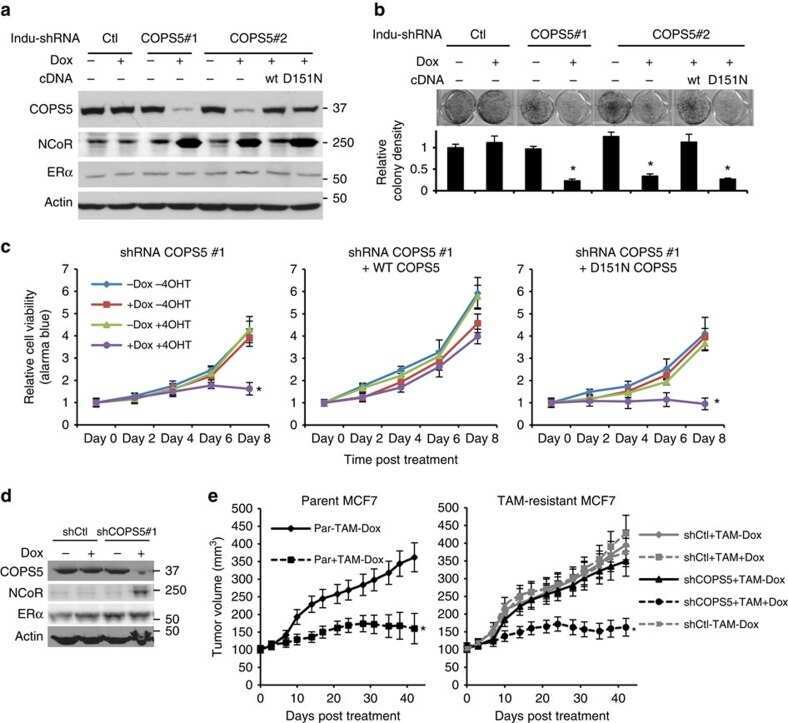
COPS5 amplification and overexpression confers tamoxifen-resistance in ERα-positive breast cancer by degradation of NCoR.
Lu R, Hu X, Zhou J, Sun J, Zhu AZ, Xu X, Zheng H, Gao X, Wang X, Jin H, Zhu P, Guo L
Nature communications 2016 Jul 4;7:12044
Nature communications 2016 Jul 4;7:12044
Energy homeostasis targets chromosomal reconfiguration of the human GH1 locus.
Vakili H, Jin Y, Cattini PA
The Journal of clinical investigation 2014 Nov;124(11):5002-12
The Journal of clinical investigation 2014 Nov;124(11):5002-12
CtBP2 modulates the androgen receptor to promote prostate cancer progression.
Takayama K, Suzuki T, Fujimura T, Urano T, Takahashi S, Homma Y, Inoue S
Cancer research 2014 Nov 15;74(22):6542-53
Cancer research 2014 Nov 15;74(22):6542-53
Developmentally regulated GTP-binding protein 2 ameliorates EAE by suppressing the development of TH17 cells.
Ko MS, Kim HJ, Kim HK, Yoon NA, Lee UH, Lee SC, Chung DK, Lee BJ, Suh JH, Cho WJ, Park JW
Clinical immunology (Orlando, Fla.) 2014 Feb;150(2):225-35
Clinical immunology (Orlando, Fla.) 2014 Feb;150(2):225-35
Acute hypoxia affects P-TEFb through HDAC3 and HEXIM1-dependent mechanism to promote gene-specific transcriptional repression.
Safronova OS, Nakahama K, Morita I
Nucleic acids research 2014 Aug;42(14):8954-69
Nucleic acids research 2014 Aug;42(14):8954-69
Activity-dependent phosphorylation of MeCP2 threonine 308 regulates interaction with NCoR.
Ebert DH, Gabel HW, Robinson ND, Kastan NR, Hu LS, Cohen S, Navarro AJ, Lyst MJ, Ekiert R, Bird AP, Greenberg ME
Nature 2013 Jul 18;499(7458):341-5
Nature 2013 Jul 18;499(7458):341-5
Vitamin D receptor binds to the ε germline gene promoter and exhibits transrepressive activity.
Milovanovic M, Heine G, Hallatschek W, Opitz B, Radbruch A, Worm M
The Journal of allergy and clinical immunology 2010 Nov;126(5):1016-23, 1023.e1-4
The Journal of allergy and clinical immunology 2010 Nov;126(5):1016-23, 1023.e1-4
Proteasomal degradation of retinoid X receptor alpha reprograms transcriptional activity of PPARgamma in obese mice and humans.
Lefebvre B, Benomar Y, Guédin A, Langlois A, Hennuyer N, Dumont J, Bouchaert E, Dacquet C, Pénicaud L, Casteilla L, Pattou F, Ktorza A, Staels B, Lefebvre P
The Journal of clinical investigation 2010 May;120(5):1454-68
The Journal of clinical investigation 2010 May;120(5):1454-68
mTORC1 controls fasting-induced ketogenesis and its modulation by ageing.
Sengupta S, Peterson TR, Laplante M, Oh S, Sabatini DM
Nature 2010 Dec 23;468(7327):1100-4
Nature 2010 Dec 23;468(7327):1100-4
Control of inducible gene expression by signal-dependent transcriptional elongation.
Hargreaves DC, Horng T, Medzhitov R
Cell 2009 Jul 10;138(1):129-45
Cell 2009 Jul 10;138(1):129-45
Electromagnetic fields alter the expression of estrogen receptor cofactors in breast cancer cells.
Girgert R, Gründker C, Emons G, Hanf V
Bioelectromagnetics 2008 Apr;29(3):169-76
Bioelectromagnetics 2008 Apr;29(3):169-76
Phosphorylation of liver X receptor alpha selectively regulates target gene expression in macrophages.
Torra IP, Ismaili N, Feig JE, Xu CF, Cavasotto C, Pancratov R, Rogatsky I, Neubert TA, Fisher EA, Garabedian MJ
Molecular and cellular biology 2008 Apr;28(8):2626-36
Molecular and cellular biology 2008 Apr;28(8):2626-36
Nuclear receptor corepressor is a novel regulator of phosphatidylinositol 3-kinase signaling.
Furuya F, Guigon CJ, Zhao L, Lu C, Hanover JA, Cheng SY
Molecular and cellular biology 2007 Sep;27(17):6116-26
Molecular and cellular biology 2007 Sep;27(17):6116-26
Amino-terminal domain of TIF2 is involved in competing for corepressor binding to glucocorticoid and progesterone receptors.
Wang D, Wang Q, Awasthi S, Simons SS Jr
Biochemistry 2007 Jul 10;46(27):8036-49
Biochemistry 2007 Jul 10;46(27):8036-49
Thyroid hormone-mediated negative transcriptional regulation of Necdin expression.
Nygård M, Becker N, Demeneix B, Pettersson K, Bondesson M
Journal of molecular endocrinology 2006 Jun;36(3):517-30
Journal of molecular endocrinology 2006 Jun;36(3):517-30
A SUMOylation-dependent pathway mediates transrepression of inflammatory response genes by PPAR-gamma.
Pascual G, Fong AL, Ogawa S, Gamliel A, Li AC, Perissi V, Rose DW, Willson TM, Rosenfeld MG, Glass CK
Nature 2005 Sep 29;437(7059):759-63
Nature 2005 Sep 29;437(7059):759-63
PPARgamma regulates adipocyte cholesterol metabolism via oxidized LDL receptor 1.
Chui PC, Guan HP, Lehrke M, Lazar MA
The Journal of clinical investigation 2005 Aug;115(8):2244-56
The Journal of clinical investigation 2005 Aug;115(8):2244-56
No comments: Submit comment
Supportive validation
- Submitted by
- Invitrogen Antibodies (provider)
- Main image
- Experimental details
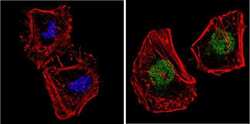
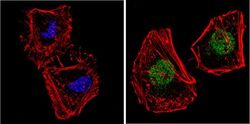
- Immunofluorescent analysis of NCoR (green) showing staining in the nucleus and cytoplasm of HeLa cells. Formalin-fixed cells were permeabilized with 0.1% Triton X-100 in TBS for 5-10 minutes and blocked with 3% BSA-PBS for 30 minutes at room temperature. Cells were probed with a NCoR polyclonal antibody (Product # PA1-844A) in 3% BSA-PBS at a dilution of 1:200 and incubated overnight at 4 ºC in a humidified chamber. Cells were washed with PBST and incubated with a DyLight-conjugated secondary antibody in PBS at room temperature in the dark. F-actin (red) was stained with a fluorescent red phalloidin and nuclei (blue) were stained with Hoechst or DAPI. Images were taken at a magnification of 60x.
- Submitted by
- Invitrogen Antibodies (provider)
- Main image
- Experimental details
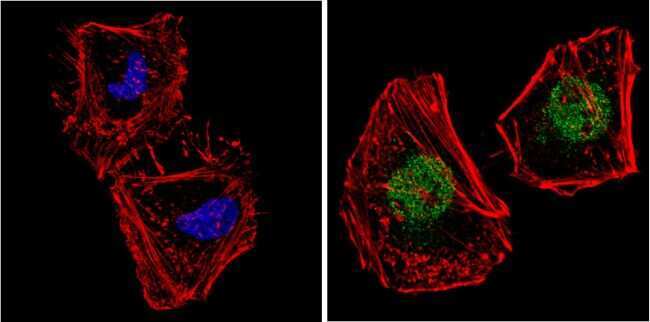
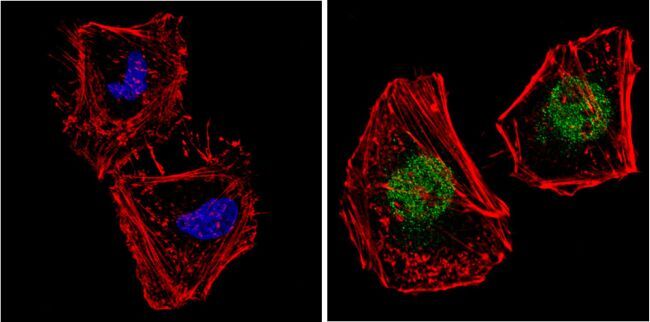
- Immunofluorescent analysis of NCoR (green) showing staining in the nucleus and cytoplasm of MCF-7 cells. Formalin-fixed cells were permeabilized with 0.1% Triton X-100 in TBS for 5-10 minutes and blocked with 3% BSA-PBS for 30 minutes at room temperature. Cells were probed with a NCoR polyclonal antibody (Product # PA1-844A) in 3% BSA-PBS at a dilution of 1:200 and incubated overnight at 4 ºC in a humidified chamber. Cells were washed with PBST and incubated with a DyLight-conjugated secondary antibody in PBS at room temperature in the dark. F-actin (red) was stained with a fluorescent red phalloidin and nuclei (blue) were stained with Hoechst or DAPI. Images were taken at a magnification of 60x.

- Submitted by
- Invitrogen Antibodies (provider)
- Main image
- Experimental details
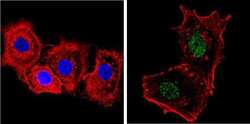
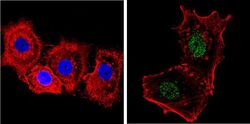
- Immunofluorescent analysis of NCoR (green) showing staining in the nucleus and cytoplasm of HeLa cells. Formalin-fixed cells were permeabilized with 0.1% Triton X-100 in TBS for 5-10 minutes and blocked with 3% BSA-PBS for 30 minutes at room temperature. Cells were probed with a NCoR polyclonal antibody (Product # PA1-844A) in 3% BSA-PBS at a dilution of 1:200 and incubated overnight at 4 ºC in a humidified chamber. Cells were washed with PBST and incubated with a DyLight-conjugated secondary antibody in PBS at room temperature in the dark. F-actin (red) was stained with a fluorescent red phalloidin and nuclei (blue) were stained with Hoechst or DAPI. Images were taken at a magnification of 60x.
- Submitted by
- Invitrogen Antibodies (provider)
- Main image
- Experimental details
- Immunofluorescent analysis of NCoR (green) showing staining in the nucleus and cytoplasm of MCF-7 cells. Formalin-fixed cells were permeabilized with 0.1% Triton X-100 in TBS for 5-10 minutes and blocked with 3% BSA-PBS for 30 minutes at room temperature. Cells were probed with a NCoR polyclonal antibody (Product # PA1-844A) in 3% BSA-PBS at a dilution of 1:200 and incubated overnight at 4 ºC in a humidified chamber. Cells were washed with PBST and incubated with a DyLight-conjugated secondary antibody in PBS at room temperature in the dark. F-actin (red) was stained with a fluorescent red phalloidin and nuclei (blue) were stained with Hoechst or DAPI. Images were taken at a magnification of 60x.

Supportive validation
- Submitted by
- Invitrogen Antibodies (provider)
- Main image
- Experimental details
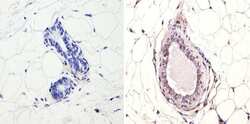
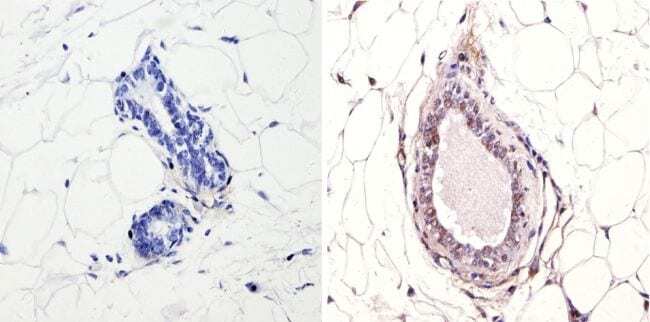
- Immunohistochemistry analysis of NCoR showing positive staining in the nucleus of paraffin-treated Mouse breast tissue (right) compared with a negative control in the absence of primary antibody (left). To expose target proteins, antigen retrieval method was performed using 10mM sodium citrate (pH 6.0), microwaved for 8-15 min. Following antigen retrieval, tissues were blocked in 3% H2O2-methanol for 15 min at room temperature, washed with ddH2O and PBS, and then probed with a NCoR polyclonal antibody (Product # PA1-844A) diluted by 3% BSA-PBS at a dilution of 1:200 overnight at 4°C in a humidified chamber. Tissues were washed extensively PBST and detection was performed using an HRP-conjugated secondary antibody followed by colorimetric detection using a DAB kit. Tissues were counterstained with hematoxylin and dehydrated with ethanol and xylene to prep for mounting.
- Submitted by
- Invitrogen Antibodies (provider)
- Main image
- Experimental details
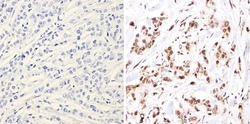
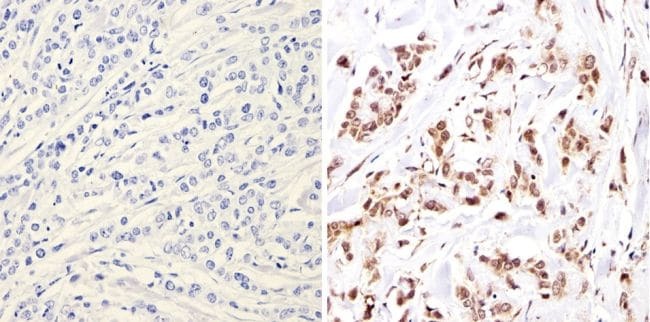
- Immunohistochemistry analysis of NCoR showing positive staining in the nucleus of paraffin-treated Human breast carcinoma (right) compared with a negative control in the absence of primary antibody (left). To expose target proteins, antigen retrieval method was performed using 10mM sodium citrate (pH 6.0), microwaved for 8-15 min. Following antigen retrieval, tissues were blocked in 3% H2O2-methanol for 15 min at room temperature, washed with ddH2O and PBS, and then probed with a NCoR polyclonal antibody (Product # PA1-844A) diluted by 3% BSA-PBS at a dilution of 1:200 overnight at 4°C in a humidified chamber. Tissues were washed extensively PBST and detection was performed using an HRP-conjugated secondary antibody followed by colorimetric detection using a DAB kit. Tissues were counterstained with hematoxylin and dehydrated with ethanol and xylene to prep for mounting.
Supportive validation
- Submitted by
- Invitrogen Antibodies (provider)
- Main image
- Experimental details
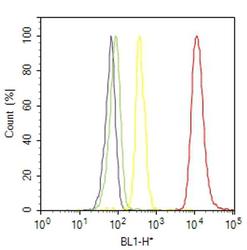
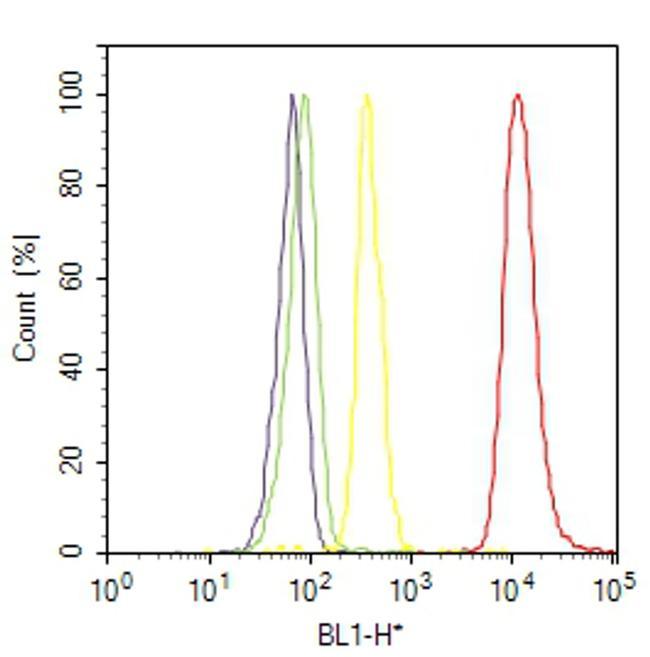
- Flow cytometry analysis of NCoR was done on HeLa cells. Cells were fixed with 70% ethanol for 10 minutes, permeabilized with 0.25% Triton™ X-100 for 20 minutes, and blocked with 5% BSA for 30 minutes at room temperature. Cells were labeled with NCoR Rabbit Polyclonal Antibody (PA1844A, red histogram) or with rabbit isotype control (yellow histogram) at 3-5 ug/million cells in 2.5% BSA. After incubation at room temperature for 2 hours, the cells were labeled with Alexa Fluor® 488 Goat Anti-Rabbit Secondary Antibody (A11008) at a dilution of 1:400 for 30 minutes at room temperature. The representative 10,000 cells were acquired and analyzed for each sample using an Attune® Acoustic Focusing Cytometer. The purple histogram represents unstained control cells and the green histogram represents no-primary-antibody control.
Supportive validation
- Submitted by
- Invitrogen Antibodies (provider)
- Main image
- Experimental details
- NULL

- Submitted by
- Invitrogen Antibodies (provider)
- Main image
- Experimental details
- NULL

- Submitted by
- Invitrogen Antibodies (provider)
- Main image
- Experimental details
- NULL

- Submitted by
- Invitrogen Antibodies (provider)
- Main image
- Experimental details
- NULL
- Submitted by
- Invitrogen Antibodies (provider)
- Main image

- Experimental details
- NULL
- Submitted by
- Invitrogen Antibodies (provider)
- Main image

- Experimental details
- NULL
- Submitted by
- Invitrogen Antibodies (provider)
- Main image
- Experimental details
- NULL
- Submitted by
- Invitrogen Antibodies (provider)
- Main image
- Experimental details
- NULL
- Submitted by
- Invitrogen Antibodies (provider)
- Main image
- Experimental details
- NULL
- Submitted by
- Invitrogen Antibodies (provider)
- Main image
- Experimental details
- NULL

- Submitted by
- Invitrogen Antibodies (provider)
- Main image
- Experimental details
- NULL
- Submitted by
- Invitrogen Antibodies (provider)
- Main image
- Experimental details
- NULL
- Submitted by
- Invitrogen Antibodies (provider)
- Main image
- Experimental details
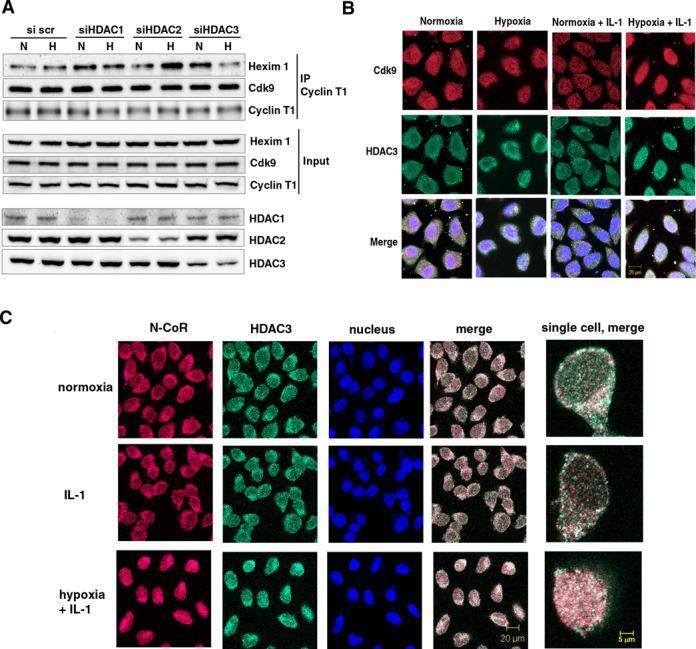
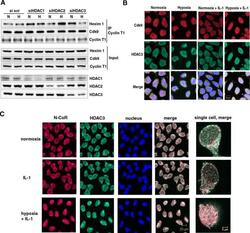
- Figure 2. Effect of depletion of class I HDACs on 7SK snRNA and cellular distribution of N-CoR/HDAC3 and Cdk9 in normoxic and hypoxic HeLa cells. ( A ) Effect of disruption of class I HDACs on the formation of an inactive endogenous P-TEFb complex in response to hypoxia. HeLa cells were exposed for 1 h to a normoxic (N) or hypoxic (H) gas mixture 48 h after transfection with siRNA. Whole cell lysates were immunoprecipitated with a goat anti-Cyclin T1 antibody and analyzed by western blot using rabbit anti-HEXIM1 and an anti-Cdk9 antibody. Direct western blots of HDAC1, HDAC2 and HDAC3 served as a control for siRNA-mediated knockdown. Western blot with an anti-Cyclin T1 antibody served as a control of total immunoprecipitated protein. ( B ) Localization of endogenous Cdk9 (red) and HDAC3 (green). Cells were treated with hypoxia, IL-1beta or their combination for 2 h and analyzed by immunofluorescence staining. ( C ) Immunofluorescence showing cellular localization of endogenous HDAC3 (green) and N-CoR (red) in response to 2 h exposure to IL-1beta alone or in combination with hypoxia. Nucleic acids were stained using TO-PRO-3 (blue).