Explore
 Validate
 Learn
Learn Western blot
 Immunocytochemistry
Antibody data
- Antibody Data
- Antigen structure
- References [2]
- Comments [0]
- Validations
- Immunocytochemistry [4]
- Immunohistochemistry [1]
- Other assay [2]
Submit
Validation data
Reference
Comment
Report error
- Product number
- MA5-14891 - Provider product page

- Provider
- Invitrogen Antibodies
- Product name
- HNF4A Monoclonal Antibody (F.674.9)
- Antibody type
- Monoclonal
- Antigen
- Synthetic peptide
- Description
- It is not recommended to aliquot this antibody.
- Reactivity
- Human
- Host
- Rabbit
- Isotype
- IgG
- Antibody clone number
- F.674.9
- Vial size
- 100 μL
- Concentration
- 52 μg/mL
- Storage
- -20°C
Submitted references Chronic Liver Injury Induces Conversion of Biliary Epithelial Cells into Hepatocytes.
Activation of liver stromal cells is associated with male-biased liver tumor initiation in xmrk and Myc transgenic zebrafish.
Deng X, Zhang X, Li W, Feng RX, Li L, Yi GR, Zhang XN, Yin C, Yu HY, Zhang JP, Lu B, Hui L, Xie WF
Cell stem cell 2018 Jul 5;23(1):114-122.e3
Cell stem cell 2018 Jul 5;23(1):114-122.e3
Activation of liver stromal cells is associated with male-biased liver tumor initiation in xmrk and Myc transgenic zebrafish.
Yang Q, Yan C, Gong Z
Scientific reports 2017 Sep 4;7(1):10315
Scientific reports 2017 Sep 4;7(1):10315
No comments: Submit comment
Supportive validation
- Submitted by
- Invitrogen Antibodies (provider)
- Main image

- Experimental details
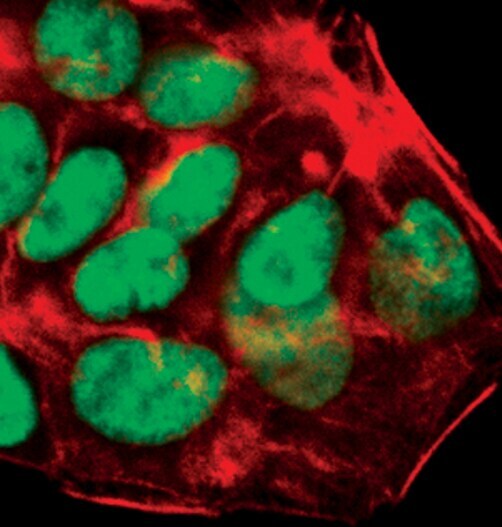
- Immunofluorescent analysis of HNF4-alpha in HepG2 using a HNF4-alpha monoclonal antibody (Product # MA5-14891) (green). Actin filaments are labeled with a fluorescent red phalloidin.

- Submitted by
- Invitrogen Antibodies (provider)
- Main image

- Experimental details
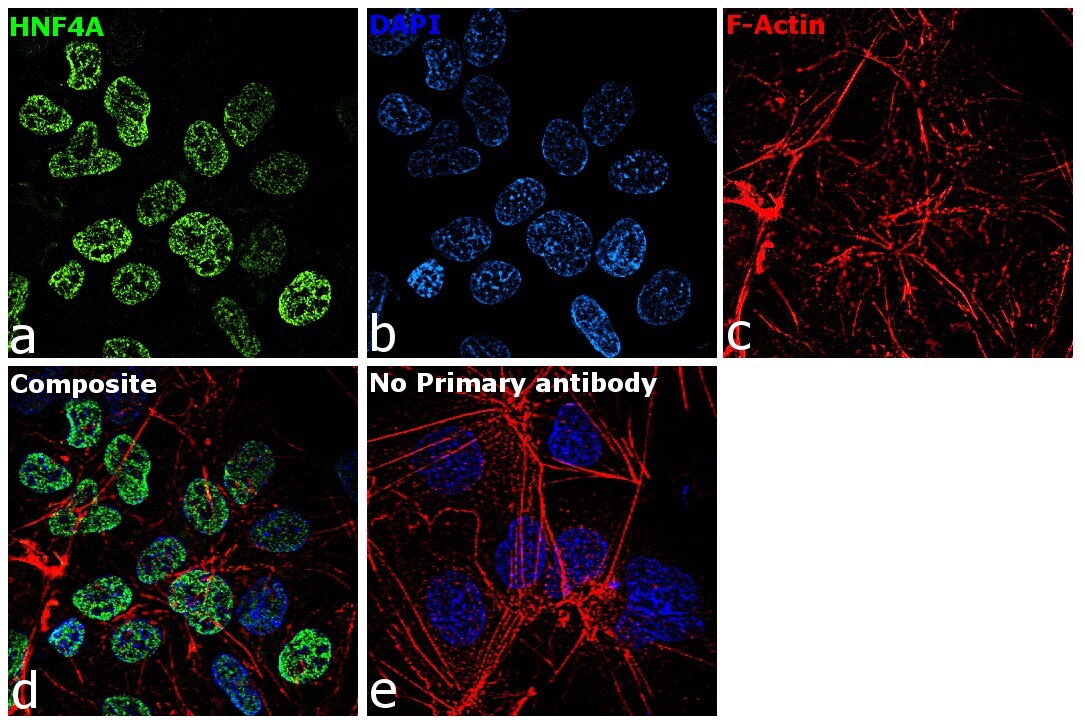
- Immunofluorescence analysis of HNF4A was performed using 70% confluent log phase HeLa cells. The cells were fixed with 4% paraformaldehyde for 10 minutes, permeabilized with 0.1% Triton™ X-100 for 15 minutes, and blocked with 1% BSA for 1 hour at room temperature. The cells were labeled with HNF4A Rabbit Monoclonal Antibody(Product # MA5-14891) at 1:100 dilution in 0.1% BSA, incubated at 4 degree Celsius overnight and then labeled with Goat anti-Rabbit IgG (H+L) Superclonal™ Secondary Antibody, Alexa Fluor® 488 conjugate (Product # A27034) at a dilution of 1:2000 for 45 minutes at room temperature (Panel a: green). Nuclei (Panel b: blue) were stained with ProLong™ Diamond Antifade Mountant with DAPI (Product # P36962). F-actin (Panel c: red) was stained with Rhodamine Phalloidin (Product # R415, 1:300). Panel d represents the merged image showing nucleus localization. Panel e represents control cells with no primary antibody to assess background. The images were captured at 60X magnification.
- Submitted by
- Invitrogen Antibodies (provider)
- Main image

- Experimental details
- Immunofluorescent analysis of HNF4-alpha in HepG2 using a HNF4-alpha monoclonal antibody (Product # MA5-14891) (green). Actin filaments are labeled with a fluorescent red phalloidin.
- Submitted by
- Invitrogen Antibodies (provider)
- Main image
- Experimental details
- Immunofluorescence analysis of HNF4A was performed using 70% confluent log phase HeLa cells. The cells were fixed with 4% paraformaldehyde for 10 minutes, permeabilized with 0.1% Triton™ X-100 for 15 minutes, and blocked with 1% BSA for 1 hour at room temperature. The cells were labeled with HNF4A Rabbit Monoclonal Antibody(Product # MA5-14891) at 1:100 dilution in 0.1% BSA, incubated at 4 degree Celsius overnight and then labeled with Goat anti-Rabbit IgG (Heavy Chain) Superclonal™ Secondary Antibody, Alexa Fluor® 488 conjugate (Product # A27034) at a dilution of 1:2000 for 45 minutes at room temperature (Panel a: green). Nuclei (Panel b: blue) were stained with ProLong™ Diamond Antifade Mountant with DAPI (Product # P36962). F-actin (Panel c: red) was stained with Rhodamine Phalloidin (Product # R415, 1:300). Panel d represents the merged image showing nucleus localization. Panel e represents control cells with no primary antibody to assess background. The images were captured at 60X magnification.

Supportive validation
- Submitted by
- Invitrogen Antibodies (provider)
- Main image

- Experimental details
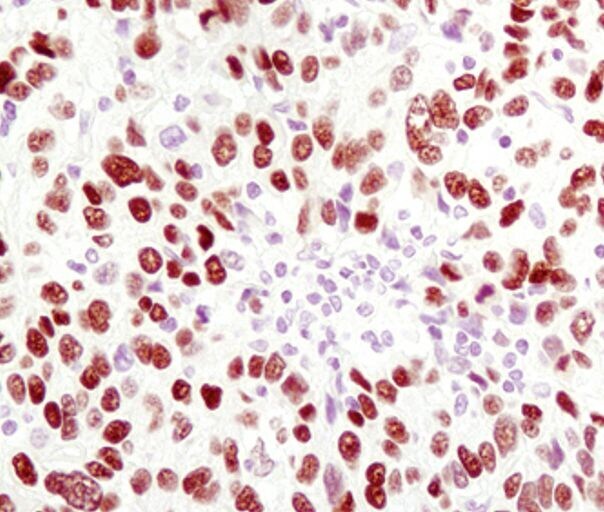
- Immunohistochemical analysis of HNF4-alpha in paraffin-embedded human hepatocellular carcinoma using a HNF4-alpha monoclonal antibody (Product # MA5-14891).
Supportive validation
- Submitted by
- Invitrogen Antibodies (provider)
- Main image
- Experimental details
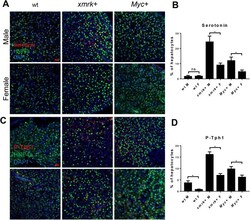
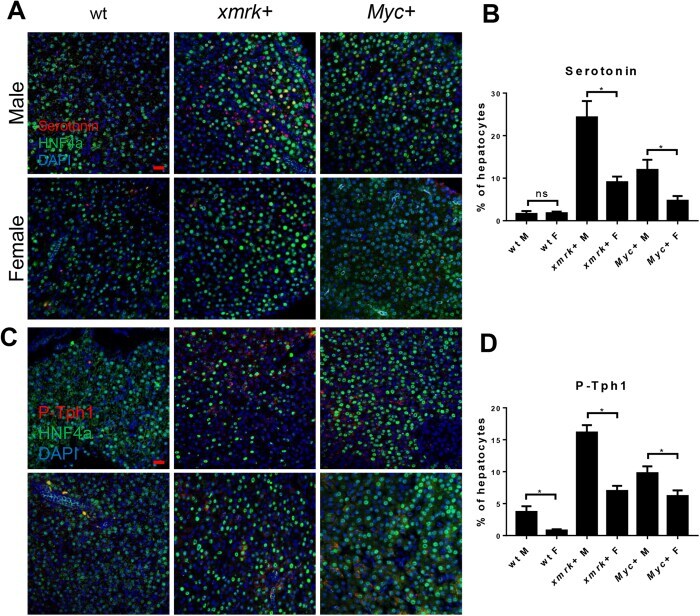
- Figure 4 Immunofluorescent staining for serotonin and P-Tph1 in the livers of male and female xmrk + and Myc + fish following oncogene activation. 10 fish were analyzed in each group and the experiment was repeated once for reproducibility. ( A ) IF co-staining of serotonin (red) and HNF4a (green) in liver sections. ( B ) Quantification of ratio of serotonin-productive hepatocytes in liver sections. ( C ) IF co-staining of P-Tph1 (red) and HNF4a (green) in liver sections. ( D ) Quantification of ratio of P-Tph1-expressed hepatocytes in liver sections. *P < 0.05. Scale bars: 20 mum. ns, non-significance.
- Submitted by
- Invitrogen Antibodies (provider)
- Main image
- Experimental details
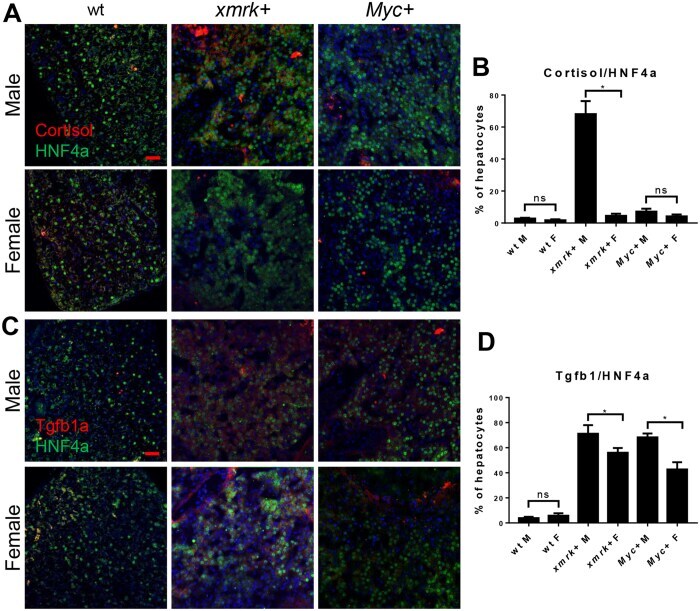
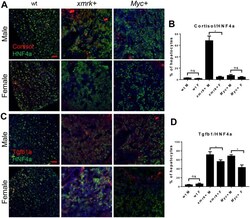
- Figure 6 Immunofluorescent staining for cortisol and Tgfb1a in the livers of male and female xmrk + and Myc + fish following oncogene activation. 10 fish were analyzed in each group and the experiment was repeated once for reproducibility. ( A ) IF co-staining of cortisol (red) and HNF4a (green) in liver sections. ( B ) Quantification of ratio of cortisol-expressing hepatocytes in liver sections. ( C ) IF co-staining of Tgfb1a (red) and HNF4a (green) in liver sections. ( D ) Quantification of ratio of Tgfb1a-expressing hepatocytes in liver sections.