 Explore
 Validate
 Learn
Learn Western blot
 ELISA
ELISAAntibody data
- Antibody Data
- Antigen structure
- References [3]
- Comments [0]
- Validations
- Western blot [5]
- Immunocytochemistry [3]
- Immunoprecipitation [1]
- Other assay [2]
Submit
Validation data
Reference
Comment
Report error
- Product number
- MA5-27542 - Provider product page

- Provider
- Invitrogen Antibodies
- Product name
- SCD Monoclonal Antibody (CD.E10)
- Antibody type
- Monoclonal
- Antigen
- Recombinant full-length protein
- Reactivity
- Human, Mouse, Rat
- Host
- Mouse
- Isotype
- IgG
- Antibody clone number
- CD.E10
- Vial size
- 100 μg
- Concentration
- 1 mg/mL
- Storage
- -20°C, Avoid Freeze/Thaw Cycles
Submitted references Lipidomic Analysis of Archival Pathology Specimens Identifies Altered Lipid Signatures in Ovarian Clear Cell Carcinoma.
SCD Inhibition Protects from α-Synuclein-Induced Neurotoxicity But Is Toxic to Early Neuron Cultures.
Expression of SCD and FADS2 Is Lower in the Necrotic Core and Growing Tumor Area than in the Peritumoral Area of Glioblastoma Multiforme.
Mir SA, Wong SBJ, Narasimhan K, Esther CWL, Ji S, Burla B, Wenk MR, Tan DSP, Bendt AK
Metabolites 2021 Sep 3;11(9)
Metabolites 2021 Sep 3;11(9)
SCD Inhibition Protects from α-Synuclein-Induced Neurotoxicity But Is Toxic to Early Neuron Cultures.
Nicholatos JW, Groot J, Dhokai S, Tran D, Hrdlicka L, Carlile TM, Bennion M, Dalkilic-Liddle I, Hirst WD, Weihofen A
eNeuro 2021 Jul-Aug;8(4)
eNeuro 2021 Jul-Aug;8(4)
Expression of SCD and FADS2 Is Lower in the Necrotic Core and Growing Tumor Area than in the Peritumoral Area of Glioblastoma Multiforme.
Korbecki J, Kojder K, Jeżewski D, Simińska D, Tarnowski M, Kopytko P, Safranow K, Gutowska I, Goschorska M, Kolasa-Wołosiuk A, Wiszniewska B, Chlubek D, Baranowska-Bosiacka I
Biomolecules 2020 May 7;10(5)
Biomolecules 2020 May 7;10(5)
No comments: Submit comment
Supportive validation
- Submitted by
- Invitrogen Antibodies (provider)
- Main image
- Experimental details
- Western blot analysis of SCD1 in HEK293T cells. The samples were probed with SCD1 (Product # MA5-27542) monoclonal antibody.

- Submitted by
- Invitrogen Antibodies (provider)
- Main image
- Experimental details
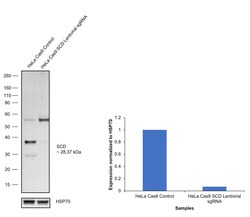
- CRISPR-Cas9 mediated genome editing ofSCD (as confirmed by next generation sequencing) was achieved by using LentiArray™ Lentiviral sgRNA (Product # A32042, Assay ID CRISPR730414_LV) and LentiArray Cas9 Lentivirus (Product # A32064). Fig (a) Western blot analysis of SCD was performed by loading 30 µg of HeLa Cas9 (Lane 1) and HeLa Cas9 cells transduced with SCD Lentiviral sgRNA (Lane 2) whole cell extracts. The samples were electrophoresed using NuPAGE™ Novex™ 4-12% Bis-Tris Protein Gel (Product # NP0322BOX). Resolved proteins were then transferred onto a nitrocellulose membrane (Product # IB23001) by iBlot® 2 Dry Blotting System (Product # IB21001). The blot was probed with Anti-SCD Monoclonal Antibody (CD.E10) (Product # MA5-27542) using 1:1000 dilution and Goat anti-Mouse IgG (H+L) Superclonal™ Recombinant Secondary Antibody, HRP (Product # A28177 1:10000 dilution).Chemiluminescent detection was performed using SuperSignal™ West Dura Extended Duration Substrate (Product # 34076). A reduced signal in sgRNA transduced cells using the LentiArray™ CRISPR product line confirms that antibody is specific toSCD (Fig (b)). An uncharacterized band was observed in all the samples at ~57 kDa.

- Submitted by
- Invitrogen Antibodies (provider)
- Main image
- Experimental details
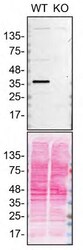
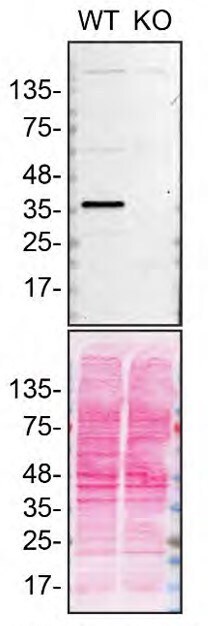
- Western blot of SCD was performed by running 35 µg of HeLa WT (lane 1) and SCD KO (lane 2) cell lysates in RIPA buffer (Product # 89901) on SDS-PAGE. Proteins on the blot were visualized with Ponceau staining (below immunoblot) (Product # BP10310). Proteins were transferred to nitrocellulose membrane and blocked in 5% milk for 1 hr. SCD was detected at approximately 35 kDa using SCD Monoclonal Antibody (CD.E10) (Product # MA5-27542) at a dilution of 1:1,000 in 5% milk in TBST overnight at 4 degrees Celsius. The blot was probed with Goat anti-Mouse IgG (H+L) Secondary Antibody, HRP (Product # 62-6520) diluted to 0.2 µg/mL in TBST with 5% milk for 1 hr at room temperature. Chemiluminescent detection was performed using ECL Western Blotting Substrate and iBright™ CL1500 Imaging System (Product # A44240). Data courtesy of YCharOS Inc., an open science company with the mission of characterizing commercially available antibodies using knockout validation.
- Submitted by
- Invitrogen Antibodies (provider)
- Main image

- Experimental details
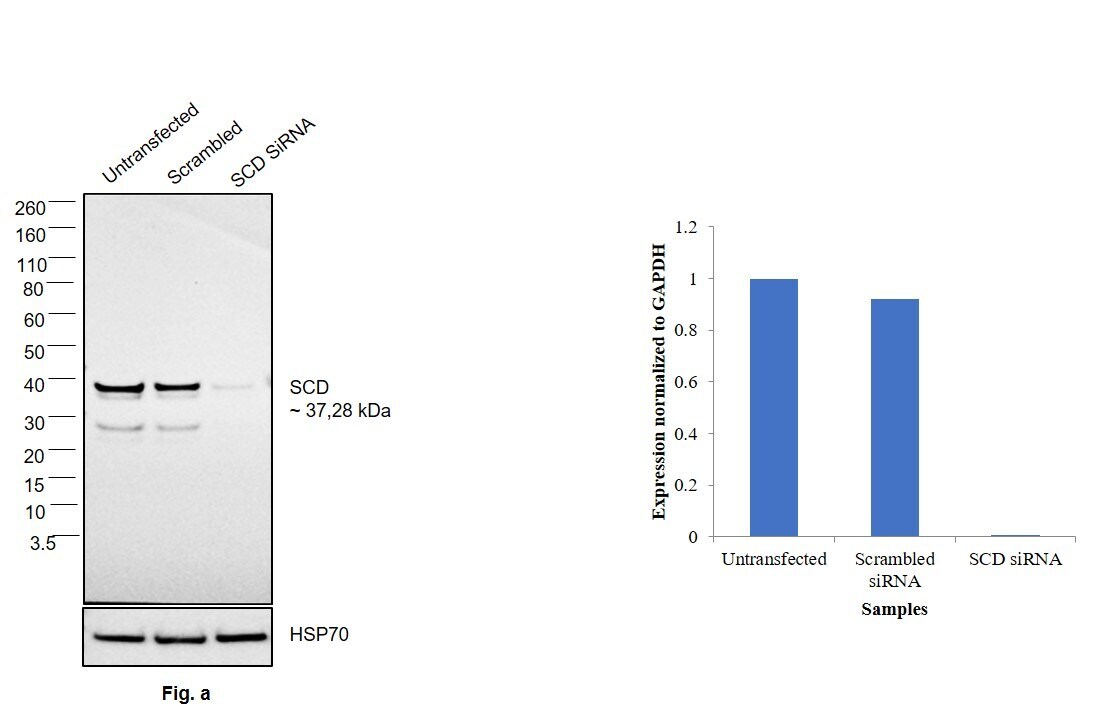
- Knockdown of SCD was achieved by transfecting MCF-7 with SCD specific siRNAs (Silencer® select Product # s12504). Western blot analysis (Fig. a) was performed using whole cell extracts from the SCD knockdown cells (lane 3), non-specific scrambled siRNA transfected cells (lane 2) and untransfected cells (lane 1). The blot was probed with SCD Monoclonal Antibody (CD.E10) (Product # MA5-27542, 1:1000 dilution) and Goat anti-Rabbit IgG (Heavy Chain) Superclonal™ Recombinant Secondary Antibody, HRP (Product # A27036, 0.25 µg/mL, 1:4000 dilution). Densitometric analysis of this western blot is shown in histogram (Fig. b). Decrease in signal upon siRNA mediated knock down confirms that antibody is specific to SCD.
- Submitted by
- Invitrogen Antibodies (provider)
- Main image
- Experimental details
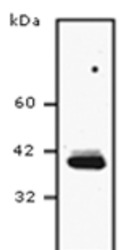
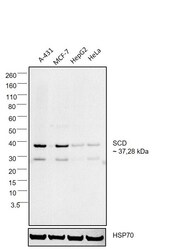
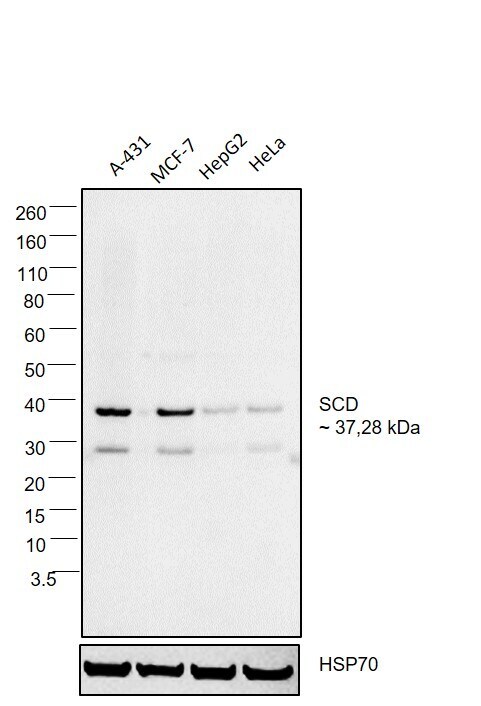
- Western blot was performed using anti-SCD Monoclonal Antibody (CD.E10) (Product # MA5-27542) and 28, 37 kDa band corresponding to SCD was observed across cell lines tested. Whole cell extracts (30 µg lysate) of A-431 (Lane 1), MCF-7 (Lane 2), HepG2 (Lane 3) and HeLa (Lane 4) were electrophoresed using NuPAGE® 4-12 % Bis-Tris gel (Product # NP0322BOX). Resolved proteins were then transferred onto a nitrocellulose membrane (Product # IB23001) by iBlot® 2 Dry Blotting System (Product # IB21001). The blot was probed with the primary antibody (1:1000 dilution) and detected by chemiluminescence with Goat anti-Mouse IgG (H+L) Superclonal™ Recombinant Secondary Antibody, HRP (Product # A28177, 1:4000 dilution) using the iBright FL 1000 (Product # A32752). Chemiluminescent detection was performed using Novex® ECL Chemiluminescent Substrate Reagent Kit (Product # WP20005).
Supportive validation
- Submitted by
- Invitrogen Antibodies (provider)
- Main image

- Experimental details
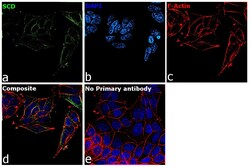
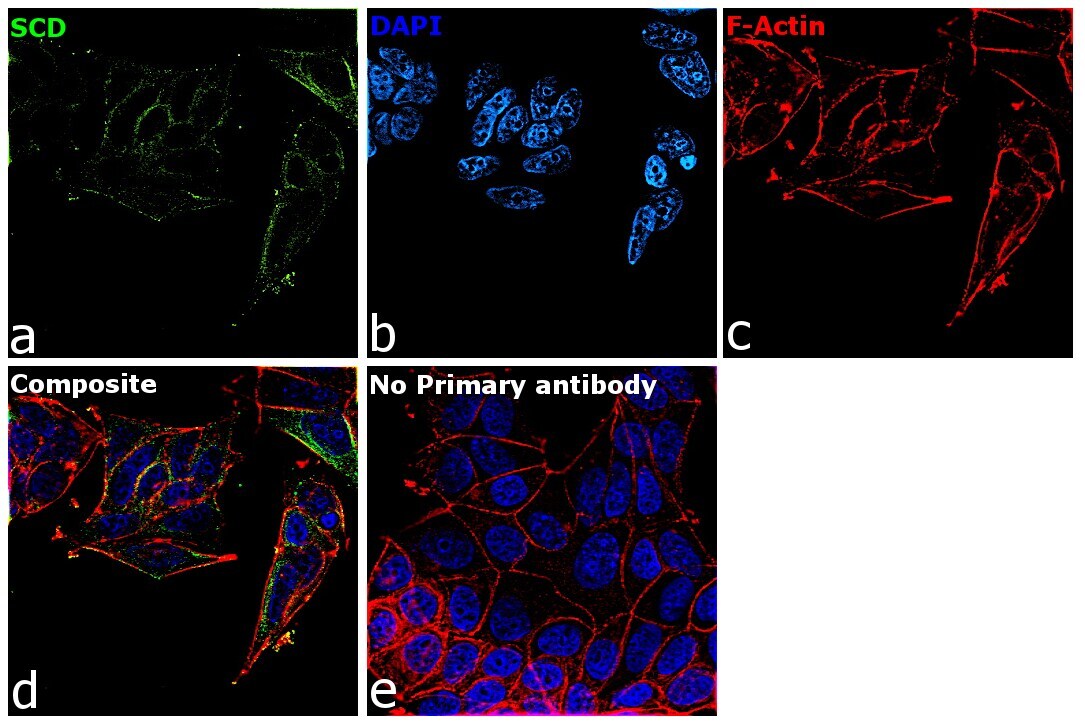
- Immunofluorescence analysis of SCD was performed using 70% confluent log phase MCF-7 cells. The cells were fixed with 4% Paraformaldehyde for 10 minutes, permeabilized with 0.1% Triton™ X-100 for 10 minutes, and blocked with 2% BSA for 10 minutes at room temperature. The cells were labeled with SCD Monoclonal Antibody (CD.E10) (Product # MA5-27542) at 1:100 dilution in 0.1% BSA, incubated at 4 degree Celsius overnight and then labeled with Goat anti-Mouse IgG (H+L) Superclonal™ Recombinant Secondary Antibody, Alexa Fluor® 488 (Product # A28175, 1:2000 dilution) for 45 minutes at room temperature (Panel a: Green). Nuclei (Panel b: Blue) were stained with SlowFade® Gold Antifade Mountant with DAPI (Product # S36938). F-actin (Panel c: Red) was stained with Rhodamine Phalloidin (Product # R415, 1:300). Panel d represents the merged image showing ER like cytoplasmic localization. Panel e represents control cells with no primary antibody to assess background. The images were captured at 60X magnification.

- Submitted by
- Invitrogen Antibodies (provider)
- Main image
- Experimental details
- Immunofluorescence analysis of SCD was performed using 70% confluent log phase MCF-7 cells. The cells were fixed with 4% Paraformaldehyde for 10 minutes, permeabilized with 0.1% Triton™ X-100 for 10 minutes, and blocked with 2% BSA for 10 minutes at room temperature. The cells were labeled with SCD Monoclonal Antibody (CD.E10) (Product # MA5-27542) at 1:100 dilution in 0.1% BSA, incubated at 4 degree Celsius overnight and then labeled with Goat anti-Mouse IgG (H+L) Superclonal™ Recombinant Secondary Antibody, Alexa Fluor® 488 (Product # A28175, 1:2000 dilution) for 45 minutes at room temperature (Panel a: Green). Nuclei (Panel b: Blue) were stained with SlowFade® Gold Antifade Mountant with DAPI (Product # S36938). F-actin (Panel c: Red) was stained with Rhodamine Phalloidin (Product # R415, 1:300). Panel d represents the merged image showing ER like cytoplasmic localization. Panel e represents control cells with no primary antibody to assess background. The images were captured at 60X magnification.
- Submitted by
- Invitrogen Antibodies (provider)
- Main image
- Experimental details
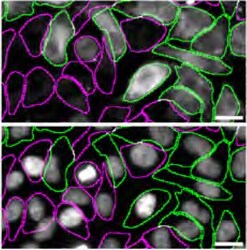
- Immunofluorescence of SCD was performed using HeLa WT and SCD KO cells that were labeled with a green or a far-red fluorescent dye, respectively. Post-labeling, WT and KO cells were mixed and plated to a 1:1 ratio in a 96-well plate with an optically clear flat bottom as a mosaic and incubated for 24 hrs. Cells were fixed in 4% PFA (in PBS) for 15 min at RT; cells were permeabilized with 0.1% Triton X-100 for 10 min at RT and blocked with PBS containing 5% BSA, 5% goat serum, and 0.01% Triton X-100 for 30 min at RT. Cells were stained with SCD Monoclonal Antibody (CD.E10) (Product # MA5-27542) at a 1:1,000 dilution overnight at 4 degrees Celcius. Secondary antibody incubation was performed using 1 µg/mL of Goat anti-Mouse IgG (H+L) Highly Cross-Adsorbed Secondary Antibody, Alexa Fluor™ 555 (Product # A-21424) together with DAPI for 1 hr at RT. Imaging was performed with a 20X water immersion objective. Representative images where WT and KO cells are outlined with a green (WT) or magenta (KO) line, respectively, are shown. The top and bottom panels show antibody and DAPI stainings, respectively. Scale bar = 10 μm. Data courtesy of YCharOS Inc., an open science company with the mission of characterizing commercially available antibodies using knockout validation.

Supportive validation
- Submitted by
- Invitrogen Antibodies (provider)
- Main image

- Experimental details
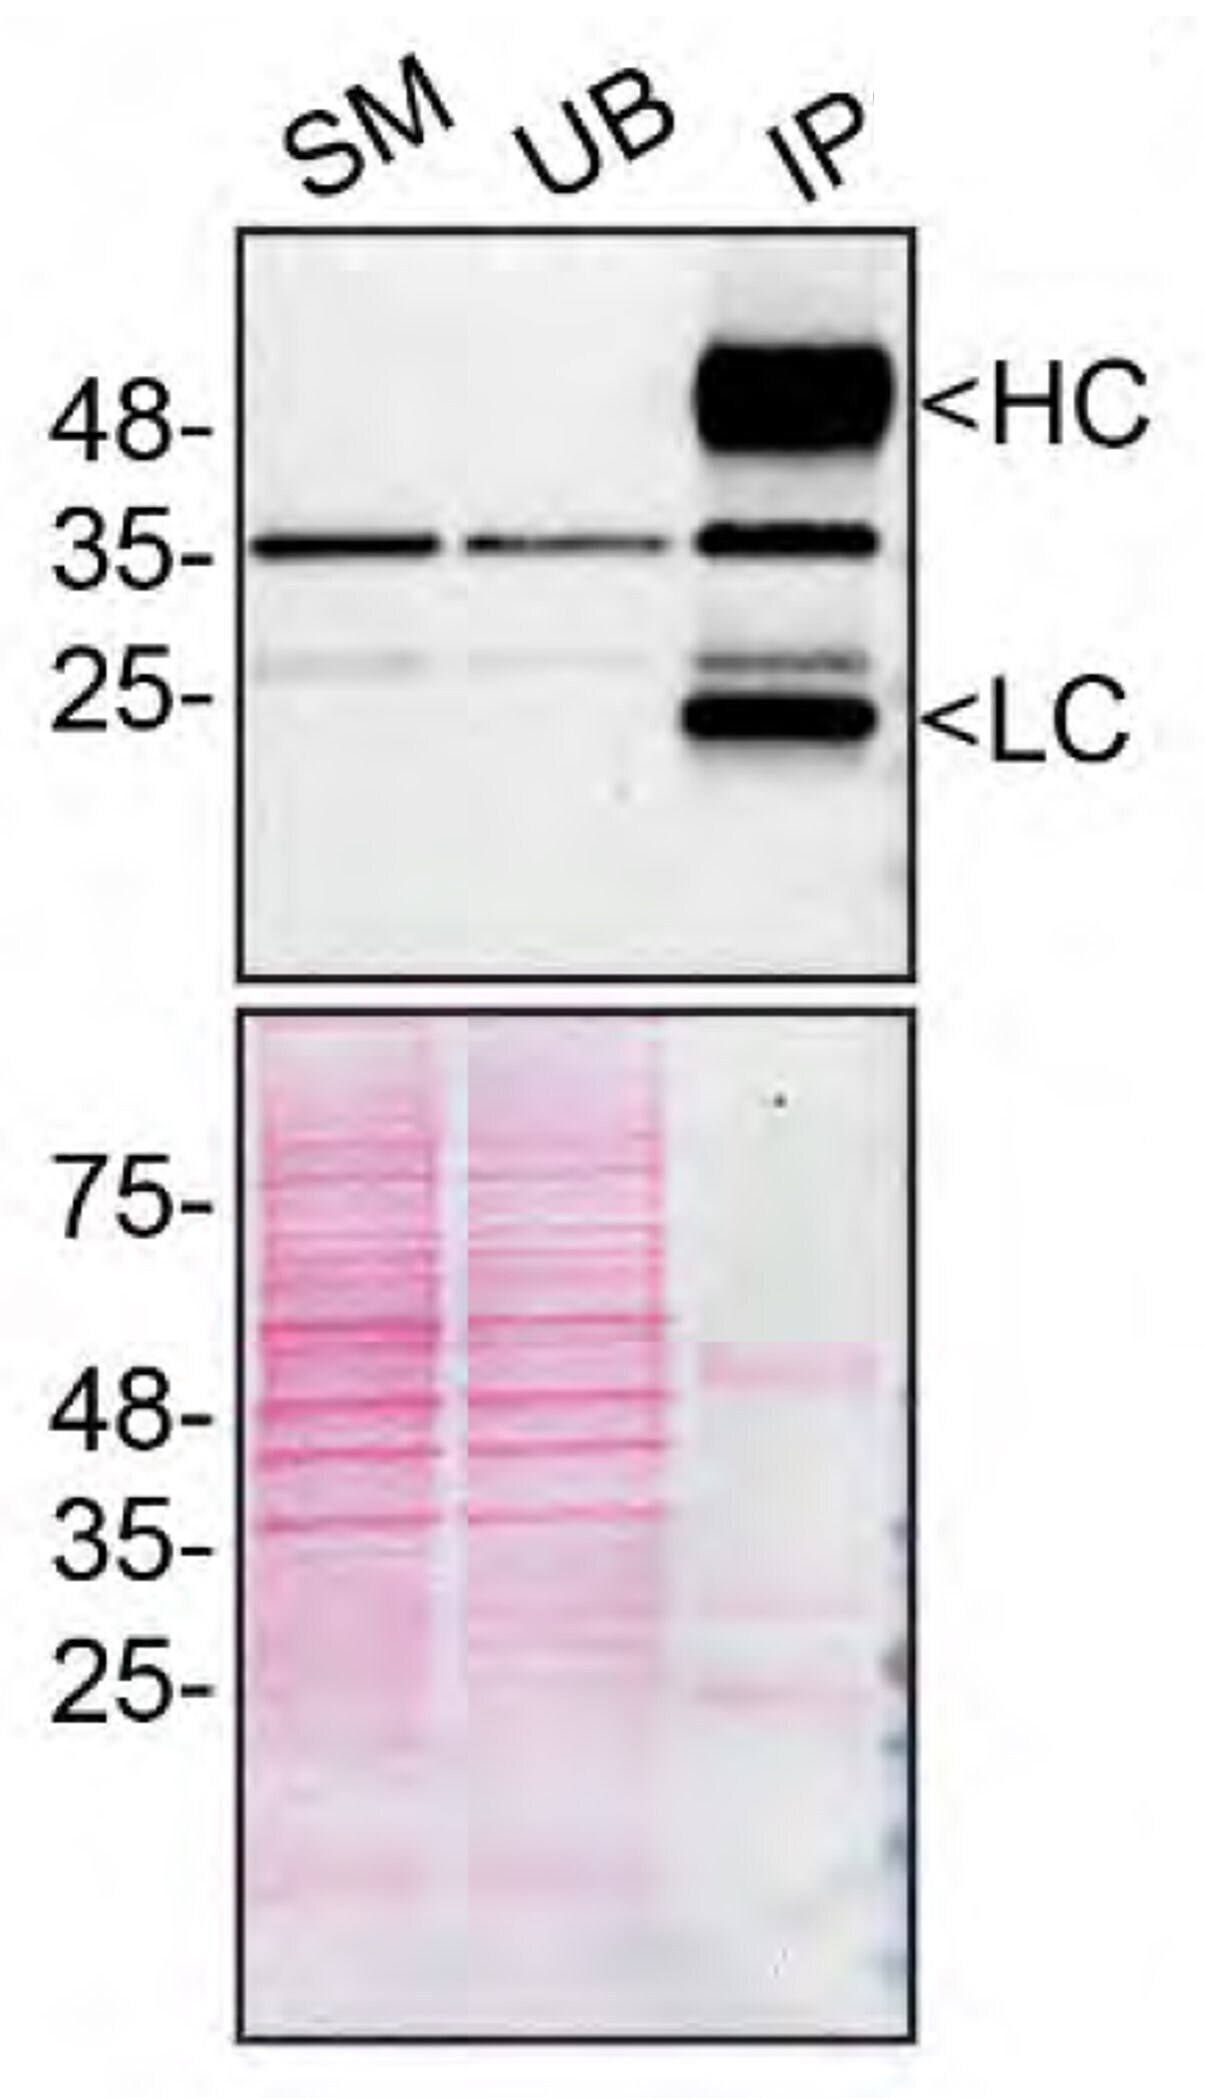
- Immunoprecipitation of SCD was performed on HeLa cell lysate. Antibody-bead conjugate was prepared by adding 2 µg of SCD Monoclonal Antibody (CD.E10) (Product # MA5-27542) and 30 µL of Dynabeads™ Protein G (Product # 10004D) to 500 μl of Pierce™ IP Lysis Buffer (Product # 87788). The mixture was rocked for ~1 hour at 4 degrees Celsius followed by two washes to remove unbound antibodies. Cells were lysed in Pierce™ IP Lysis Buffer (Product # 87788) supplemented with protease inhibitor. The lysate was rocked for 1 hour at 4 degrees Celsius followed by two washes to remove unbound antibodies. one mg of lysate was incubated with the antibody-bead conjugate for ~1 hours at 4 degrees Celsius. Following centrifugation and multiple washes, 4% starting material (SM), 4% unbound fraction (UB) and immunoprecipitated fraction (IP) were processed for immunoblot using a different antibody. Ponceau stained transfer of blot is shown (below immunoblot). Data courtesy of YCharOS Inc., an open science company with the mission of characterizing commercially available antibodies using knockout validation.
Supportive validation
- Submitted by
- Invitrogen Antibodies (provider)
- Main image
- Experimental details
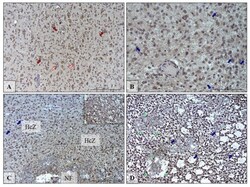
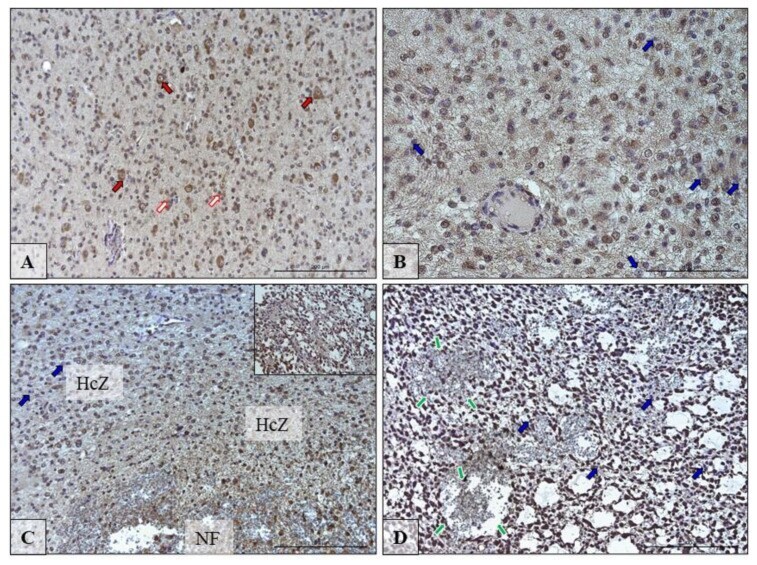
- Figure 4 Representative microphotographs showing the protein expression of desaturase SCD in neurons and glia cells in the peritumoral area ( A ; red and white arrows) and in cells in the growing tumor area ( B ; blue arrows) necrotic core ( C , D ; blue arrows) of brain tumors from patients diagnosed with glioblastoma. Please note that on microphotography of GTA/NC, there are many pathologically changed regions of the brain tissue that indicate brain cell necrosis envelope by hypercellular zones (HcZ), with additional microvascular hyperplasia (green arrows). There are microphotographs from different objective (obj. magnification: A , C , D x20, B x40); scale bar are 200 um or 100 um.
- Submitted by
- Invitrogen Antibodies (provider)
- Main image
- Experimental details
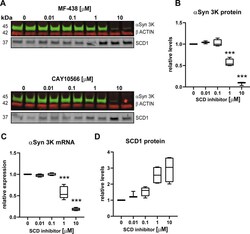
- Figure 3. High SCD inhibitor concentrations suppress alphaSyn 3K-GFP mRNA and protein in neuroblastoma model. A , Representative Licor western blot depicting alphaSyn 3K-GFP, betaactin, and SCD1 protein levels from samples treated with SCD inhibitors (0.01 to 10 muM), alphaSyn 3K-GFP induction and SCD inhibitor treatment was 48 hours before protein isolation. B , Quantification of alphaSyn 3K protein levels as in A , CAY10566 and MF-438 data was equivalent and merged for this plot. C , mRNA levels of alphaSyn 3K-GFP at equivalent time points and treatments as in C . Note the drop in alphaSyn 3K protein and mRNA under SCD inhibition >= 1 muM. D , Quantification of SCD1 protein levels under increasing concentrations of SCD inhibitor, note the dose dependent increase. Please see Extended Data Figure 3-1 for further SCD mRNA and protein characterization under inhibitor treatment. One-way ANOVA run with Dunnett's multiple test correction, all data displayed as boxplots, *** p < 0.001. All plots n >= 3 independent experiments.
