Explore
 Validate
 Learn
Learn Flow cytometry
Antibody data
- Antibody Data
- Antigen structure
- References [26]
- Comments [0]
- Validations
- Flow cytometry [1]
- Other assay [22]
Submit
Validation data
Reference
Comment
Report error
- Product number
- MHCD0417 - Provider product page

- Provider
- Invitrogen Antibodies
- Product name
- CD4 Monoclonal Antibody (S3.5), PE-Texas Red
- Antibody type
- Monoclonal
- Antigen
- Other
- Description
- The R-phycoerythrin (PE)-Texas Red conjugate permits simultaneous multicolor labeling and detection of multiple targets with excitation by a single excitation source-the 488 nm line of the argon-ion laser.
- Reactivity
- Human
- Host
- Mouse
- Isotype
- IgG
- Antibody clone number
- S3.5
- Vial size
- 500 µL
- Storage
- 4° C, store in dark
Submitted references Aberrant newborn T cell and microbiota developmental trajectories predict respiratory compromise during infancy.
Broadly reactive human CD4(+) T cells against Enterobacteriaceae are found in the naïve repertoire and are clonally expanded in the memory repertoire.
Deciphering and predicting CD4+ T cell immunodominance of influenza virus hemagglutinin.
Developing Human Skin Contains Lymphocytes Demonstrating a Memory Signature.
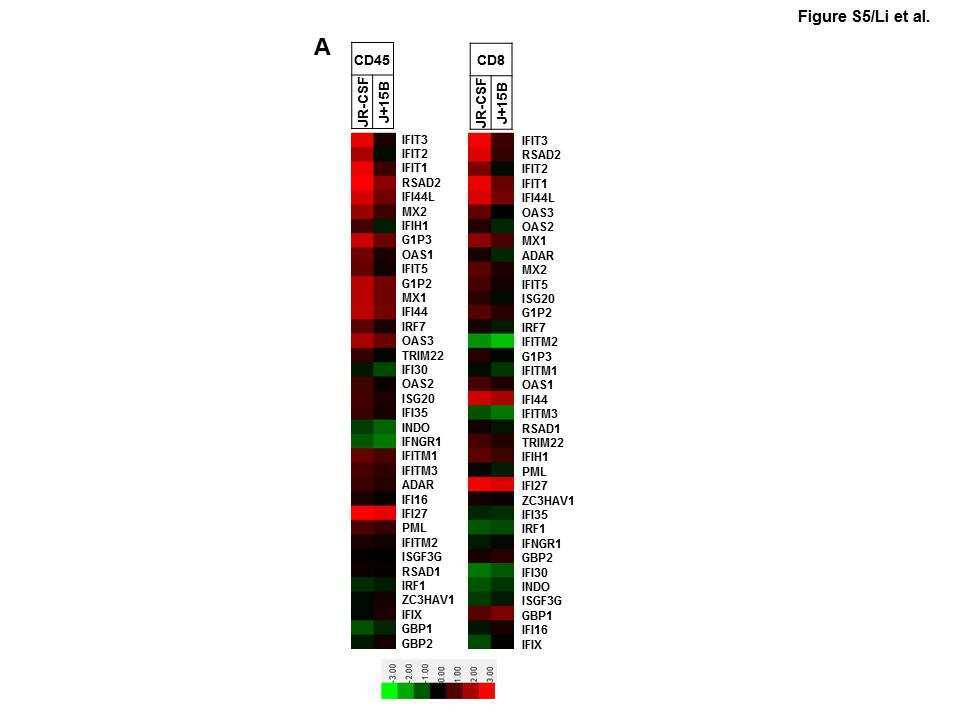
Lower Interferon Regulatory Factor-8 Expression in Peripheral Myeloid Cells Tracks With Adverse Central Nervous System Outcomes in Treated HIV Infection.
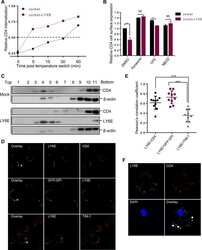
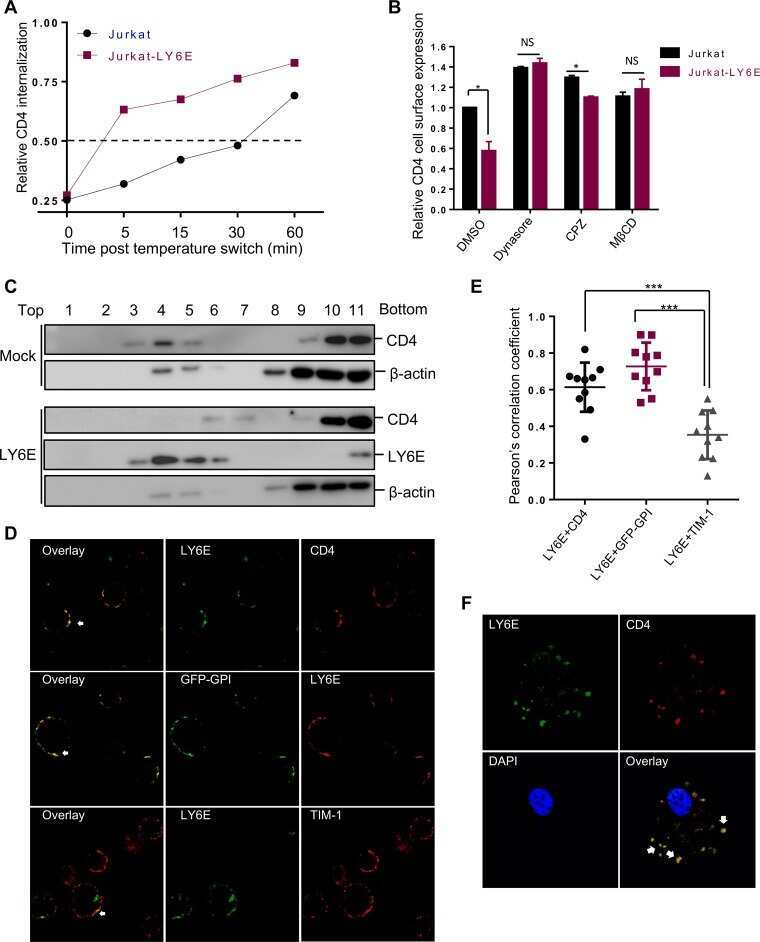
CD4-Dependent Modulation of HIV-1 Entry by LY6E.
RNA-seq and flow-cytometry of conventional, scalp, and palmoplantar psoriasis reveal shared and distinct molecular pathways.
High frequency of intestinal T(H)17 cells correlates with microbiota alterations and disease activity in multiple sclerosis.
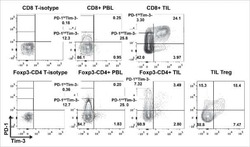
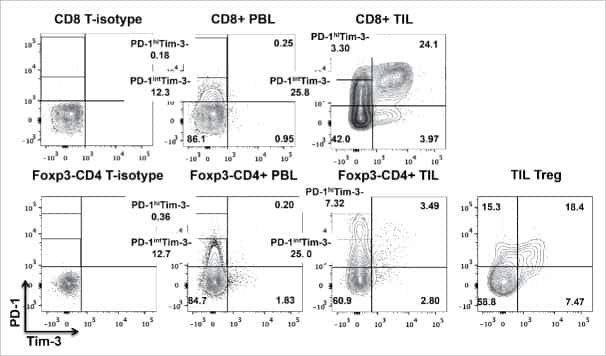
Tumor-infiltrating Tim-3(+) T cells proliferate avidly except when PD-1 is co-expressed: Evidence for intracellular cross talk.
DNA cytosine hydroxymethylation levels are distinct among non-overlapping classes of peripheral blood leukocytes.
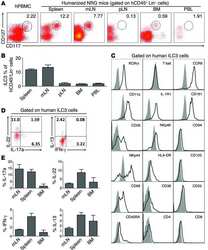
Plasmacytoid dendritic cells promote HIV-1-induced group 3 innate lymphoid cell depletion.
Isolation and cytokine analysis of lamina propria lymphocytes from mucosal biopsies of the human colon.
Select host restriction factors are associated with HIV persistence during antiretroviral therapy.
Optimization of the cytokine secretion assay for human IL-2 in single and combination assays.
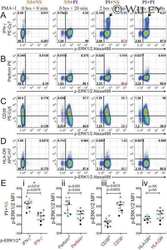
Concomitant evaluation of PMA+ionomycin-induced kinase phosphorylation and cytokine production in T cell subsets by flow cytometry.
Highly heterogeneous, activated, and short-lived regulatory T cells during chronic filarial infection.
Plasmacytoid dendritic cells suppress HIV-1 replication but contribute to HIV-1 induced immunopathogenesis in humanized mice.
High numbers of differentiated effector CD4 T cells are found in patients with cancer and correlate with clinical response after neoadjuvant therapy of breast cancer.
B cell responses to HIV antigen are a potent correlate of viremia in HIV-1 infection and improve with PD-1 blockade.
TH17, TH22 and Treg cells are enriched in the healthy human cecum.
Ki-67 expression reveals strong, transient influenza specific CD4 T cell responses after adult vaccination.
CD8+ T cell immunity to 2009 pandemic and seasonal H1N1 influenza viruses.
HIV-1 infection abrogates CD8+ T cell mitogen-activated protein kinase signaling responses.
Uncoupling of proliferation and cytokines from suppression within the CD4+CD25+Foxp3+ T-cell compartment in the 1st year of human type 1 diabetes.
Peripheral immature CD2-/low T cell development from type 2 to type 1 cytokine production.
Peripheral immature CD2-/low T cell development from type 2 to type 1 cytokine production.
McDavid A, Laniewski N, Grier A, Gill AL, Kessler HA, Huyck H, Carbonell E, Holden-Wiltse J, Bandyopadhyay S, Carnahan J, Dylag AM, Topham DJ, Falsey AR, Caserta MT, Pryhuber GS, Gill SR, Scheible KM
iScience 2022 Apr 15;25(4):104007
iScience 2022 Apr 15;25(4):104007
Broadly reactive human CD4(+) T cells against Enterobacteriaceae are found in the naïve repertoire and are clonally expanded in the memory repertoire.
Cassotta A, Goldstein JD, Durini G, Jarrossay D, Baggi Menozzi F, Venditti M, Russo A, Falcone M, Lanzavecchia A, Gagliardi MC, Latorre D, Sallusto F
European journal of immunology 2021 Mar;51(3):648-661
European journal of immunology 2021 Mar;51(3):648-661
Deciphering and predicting CD4+ T cell immunodominance of influenza virus hemagglutinin.
Cassotta A, Paparoditis P, Geiger R, Mettu RR, Landry SJ, Donati A, Benevento M, Foglierini M, Lewis DJM, Lanzavecchia A, Sallusto F
The Journal of experimental medicine 2020 Oct 5;217(10)
The Journal of experimental medicine 2020 Oct 5;217(10)
Developing Human Skin Contains Lymphocytes Demonstrating a Memory Signature.
Dhariwala MO, Karthikeyan D, Vasquez KS, Farhat S, Weckel A, Taravati K, Leitner EG, Clancy S, Pauli M, Piper ML, Cohen JN, Ashouri JF, Lowe MM, Rosenblum MD, Scharschmidt TC
Cell reports. Medicine 2020 Nov 17;1(8):100132
Cell reports. Medicine 2020 Nov 17;1(8):100132
Lower Interferon Regulatory Factor-8 Expression in Peripheral Myeloid Cells Tracks With Adverse Central Nervous System Outcomes in Treated HIV Infection.
D'Antoni ML, Kallianpur KJ, Premeaux TA, Corley MJ, Fujita T, Laws EI, Ogata-Arakaki D, Chow DC, Khadka VS, Shikuma CM, Ndhlovu LC
Frontiers in immunology 2019;10:2789
Frontiers in immunology 2019;10:2789
CD4-Dependent Modulation of HIV-1 Entry by LY6E.
Yu J, Liang C, Liu SL
Journal of virology 2019 Apr 1;93(7)
Journal of virology 2019 Apr 1;93(7)
RNA-seq and flow-cytometry of conventional, scalp, and palmoplantar psoriasis reveal shared and distinct molecular pathways.
Ahn R, Yan D, Chang HW, Lee K, Bhattarai S, Huang ZM, Nakamura M, Singh R, Afifi L, Taravati K, Munoz-Sandoval P, Pauli M, Rosenblum MD, Liao W
Scientific reports 2018 Jul 27;8(1):11368
Scientific reports 2018 Jul 27;8(1):11368
High frequency of intestinal T(H)17 cells correlates with microbiota alterations and disease activity in multiple sclerosis.
Cosorich I, Dalla-Costa G, Sorini C, Ferrarese R, Messina MJ, Dolpady J, Radice E, Mariani A, Testoni PA, Canducci F, Comi G, Martinelli V, Falcone M
Science advances 2017 Jul;3(7):e1700492
Science advances 2017 Jul;3(7):e1700492
Tumor-infiltrating Tim-3(+) T cells proliferate avidly except when PD-1 is co-expressed: Evidence for intracellular cross talk.
Li J, Shayan G, Avery L, Jie HB, Gildener-Leapman N, Schmitt N, Lu BF, Kane LP, Ferris RL
Oncoimmunology 2016;5(10):e1200778
Oncoimmunology 2016;5(10):e1200778
DNA cytosine hydroxymethylation levels are distinct among non-overlapping classes of peripheral blood leukocytes.
Hohos NM, Lee K, Ji L, Yu M, Kandasamy MM, Phillips BG, Baile CA, He C, Schmitz RJ, Meagher RB
Journal of immunological methods 2016 Sep;436:1-15
Journal of immunological methods 2016 Sep;436:1-15
Plasmacytoid dendritic cells promote HIV-1-induced group 3 innate lymphoid cell depletion.
Zhang Z, Cheng L, Zhao J, Li G, Zhang L, Chen W, Nie W, Reszka-Blanco NJ, Wang FS, Su L
The Journal of clinical investigation 2015 Sep;125(9):3692-703
The Journal of clinical investigation 2015 Sep;125(9):3692-703
Isolation and cytokine analysis of lamina propria lymphocytes from mucosal biopsies of the human colon.
Bowcutt R, Malter LB, Chen LA, Wolff MJ, Robertson I, Rifkin DB, Poles M, Cho I, Loke P
Journal of immunological methods 2015 Jun;421:27-35
Journal of immunological methods 2015 Jun;421:27-35
Select host restriction factors are associated with HIV persistence during antiretroviral therapy.
Abdel-Mohsen M, Wang C, Strain MC, Lada SM, Deng X, Cockerham LR, Pilcher CD, Hecht FM, Liegler T, Richman DD, Deeks SG, Pillai SK
AIDS (London, England) 2015 Feb 20;29(4):411-20
AIDS (London, England) 2015 Feb 20;29(4):411-20
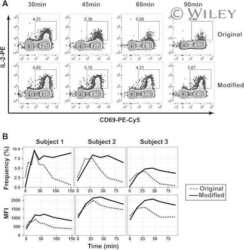
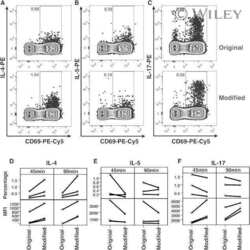
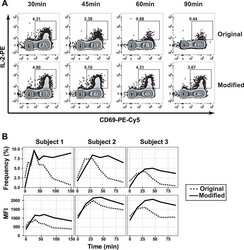
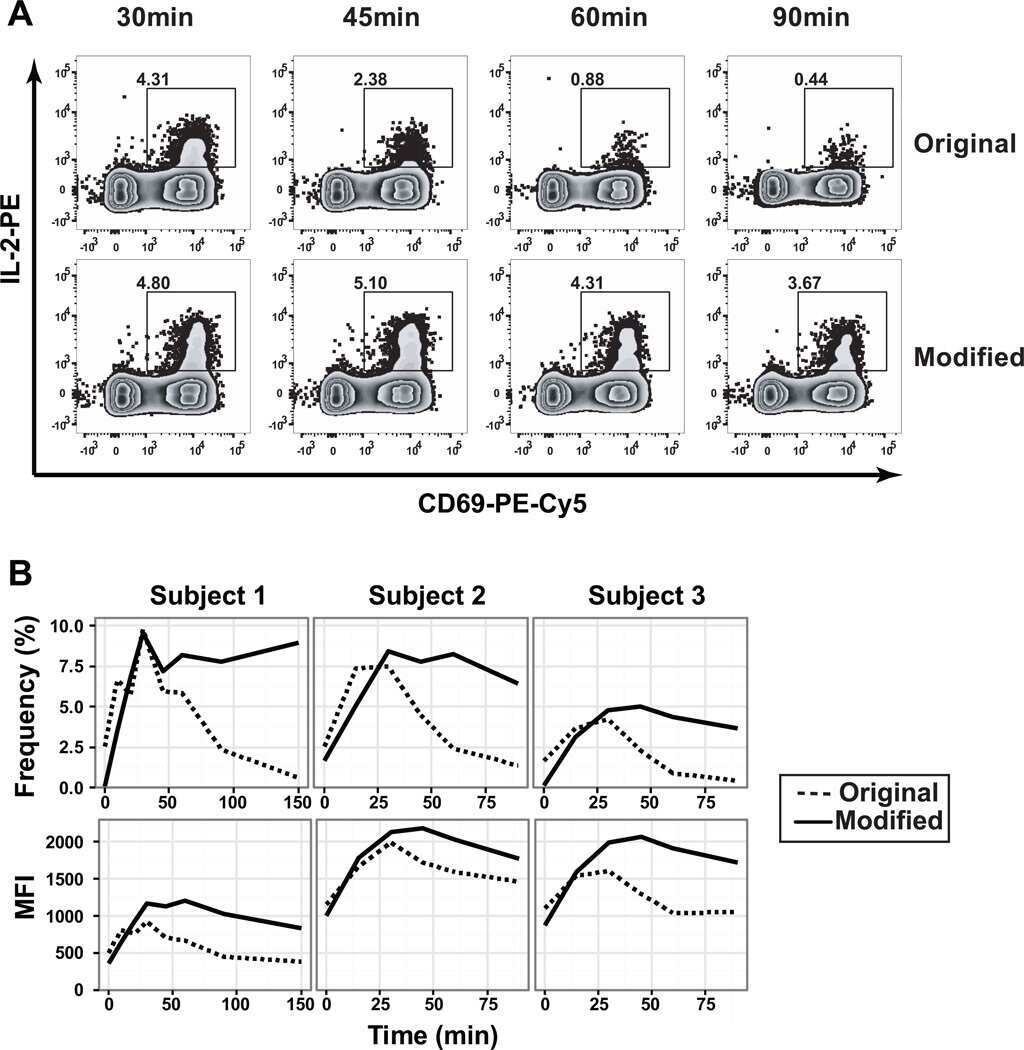
Optimization of the cytokine secretion assay for human IL-2 in single and combination assays.
Deng N, Mosmann TR
Cytometry. Part A : the journal of the International Society for Analytical Cytology 2015 Aug;87(8):777-83
Cytometry. Part A : the journal of the International Society for Analytical Cytology 2015 Aug;87(8):777-83
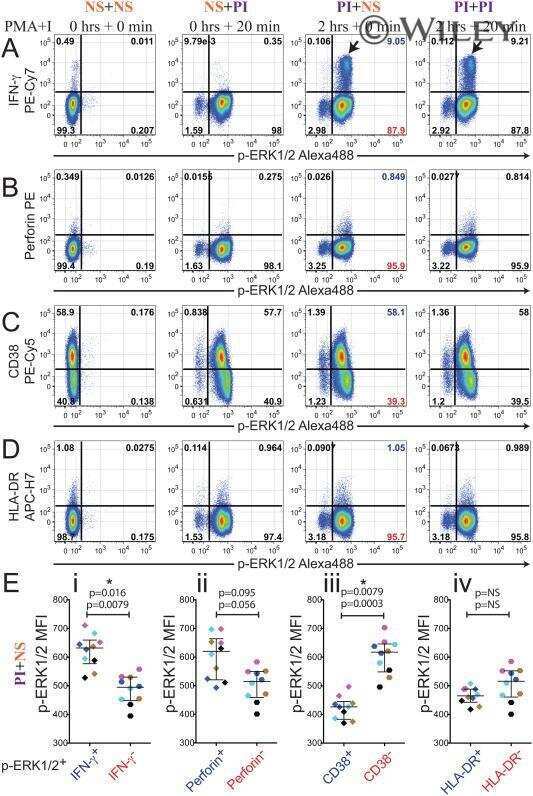
Concomitant evaluation of PMA+ionomycin-induced kinase phosphorylation and cytokine production in T cell subsets by flow cytometry.
Crawford TQ, Jalbert E, Ndhlovu LC, Barbour JD
Cytometry. Part A : the journal of the International Society for Analytical Cytology 2014 Mar;85(3):268-76
Cytometry. Part A : the journal of the International Society for Analytical Cytology 2014 Mar;85(3):268-76
Highly heterogeneous, activated, and short-lived regulatory T cells during chronic filarial infection.
Metenou S, Coulibaly YI, Sturdevant D, Dolo H, Diallo AA, Soumaoro L, Coulibaly ME, Kanakabandi K, Porcella SF, Klion AD, Nutman TB
European journal of immunology 2014 Jul;44(7):2036-47
European journal of immunology 2014 Jul;44(7):2036-47
Plasmacytoid dendritic cells suppress HIV-1 replication but contribute to HIV-1 induced immunopathogenesis in humanized mice.
Li G, Cheng M, Nunoya J, Cheng L, Guo H, Yu H, Liu YJ, Su L, Zhang L
PLoS pathogens 2014 Jul;10(7):e1004291
PLoS pathogens 2014 Jul;10(7):e1004291
High numbers of differentiated effector CD4 T cells are found in patients with cancer and correlate with clinical response after neoadjuvant therapy of breast cancer.
Péguillet I, Milder M, Louis D, Vincent-Salomon A, Dorval T, Piperno-Neumann S, Scholl SM, Lantz O
Cancer research 2014 Apr 15;74(8):2204-16
Cancer research 2014 Apr 15;74(8):2204-16
B cell responses to HIV antigen are a potent correlate of viremia in HIV-1 infection and improve with PD-1 blockade.
Nicholas KJ, Zern EK, Barnett L, Smith RM, Lorey SL, Copeland CA, Sadagopal S, Kalams SA
PloS one 2013;8(12):e84185
PloS one 2013;8(12):e84185
TH17, TH22 and Treg cells are enriched in the healthy human cecum.
Wolff MJ, Leung JM, Davenport M, Poles MA, Cho I, Loke P
PloS one 2012;7(7):e41373
PloS one 2012;7(7):e41373
Ki-67 expression reveals strong, transient influenza specific CD4 T cell responses after adult vaccination.
Li X, Miao H, Henn A, Topham DJ, Wu H, Zand MS, Mosmann TR
Vaccine 2012 Jun 29;30(31):4581-4
Vaccine 2012 Jun 29;30(31):4581-4
CD8+ T cell immunity to 2009 pandemic and seasonal H1N1 influenza viruses.
Scheible K, Zhang G, Baer J, Azadniv M, Lambert K, Pryhuber G, Treanor JJ, Topham DJ
Vaccine 2011 Mar 3;29(11):2159-68
Vaccine 2011 Mar 3;29(11):2159-68
HIV-1 infection abrogates CD8+ T cell mitogen-activated protein kinase signaling responses.
Crawford TQ, Ndhlovu LC, Tan A, Carvidi A, Hecht FM, Sinclair E, Barbour JD
Journal of virology 2011 Dec;85(23):12343-50
Journal of virology 2011 Dec;85(23):12343-50
Uncoupling of proliferation and cytokines from suppression within the CD4+CD25+Foxp3+ T-cell compartment in the 1st year of human type 1 diabetes.
Hughson A, Bromberg I, Johnson B, Quataert S, Jospe N, Fowell DJ
Diabetes 2011 Aug;60(8):2125-33
Diabetes 2011 Aug;60(8):2125-33
Peripheral immature CD2-/low T cell development from type 2 to type 1 cytokine production.
Loza MJ, Perussia B
Journal of immunology (Baltimore, Md. : 1950) 2002 Sep 15;169(6):3061-8
Journal of immunology (Baltimore, Md. : 1950) 2002 Sep 15;169(6):3061-8
Peripheral immature CD2-/low T cell development from type 2 to type 1 cytokine production.
Loza MJ, Perussia B
Journal of immunology (Baltimore, Md. : 1950) 2002 Sep 15;169(6):3061-8
Journal of immunology (Baltimore, Md. : 1950) 2002 Sep 15;169(6):3061-8
No comments: Submit comment
Supportive validation
- Submitted by
- Invitrogen Antibodies (provider)
- Main image
- Experimental details
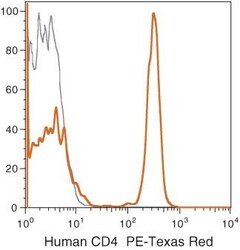
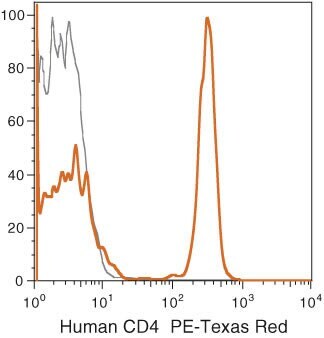
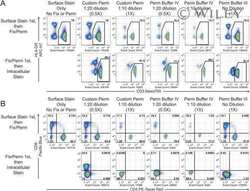
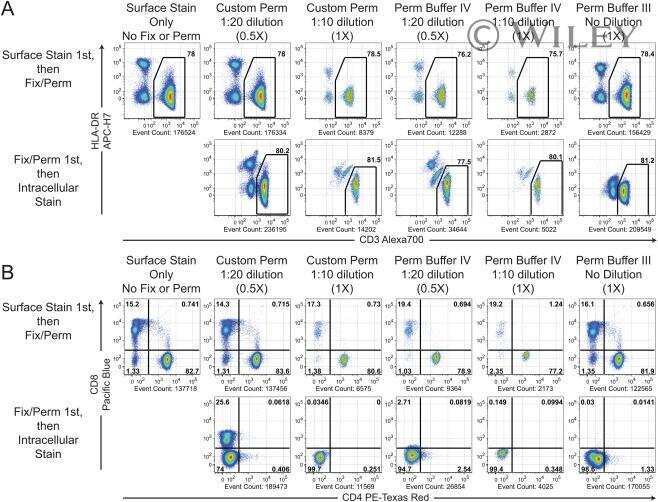
- Human peripheral blood lymphocytes were stained using PE-Texas Red® of anti-human CD4 monoclonal antibody (clone S3.5). The negative control profiles represent unstained cells.
Supportive validation
- Submitted by
- Invitrogen Antibodies (provider)
- Main image

- Experimental details
- NULL
- Submitted by
- Invitrogen Antibodies (provider)
- Main image

- Experimental details
- NULL
- Submitted by
- Invitrogen Antibodies (provider)
- Main image
- Experimental details
- NULL
- Submitted by
- Invitrogen Antibodies (provider)
- Main image
- Experimental details
- NULL
- Submitted by
- Invitrogen Antibodies (provider)
- Main image
- Experimental details
- NULL

- Submitted by
- Invitrogen Antibodies (provider)
- Main image
- Experimental details
- NULL

- Submitted by
- Invitrogen Antibodies (provider)
- Main image
- Experimental details
- NULL
- Submitted by
- Invitrogen Antibodies (provider)
- Main image
- Experimental details
- NULL

- Submitted by
- Invitrogen Antibodies (provider)
- Main image
- Experimental details
- NULL
- Submitted by
- Invitrogen Antibodies (provider)
- Main image
- Experimental details
- NULL
- Submitted by
- Invitrogen Antibodies (provider)
- Main image
- Experimental details
- NULL

- Submitted by
- Invitrogen Antibodies (provider)
- Main image
- Experimental details
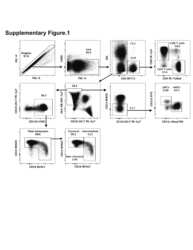
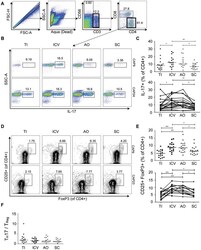
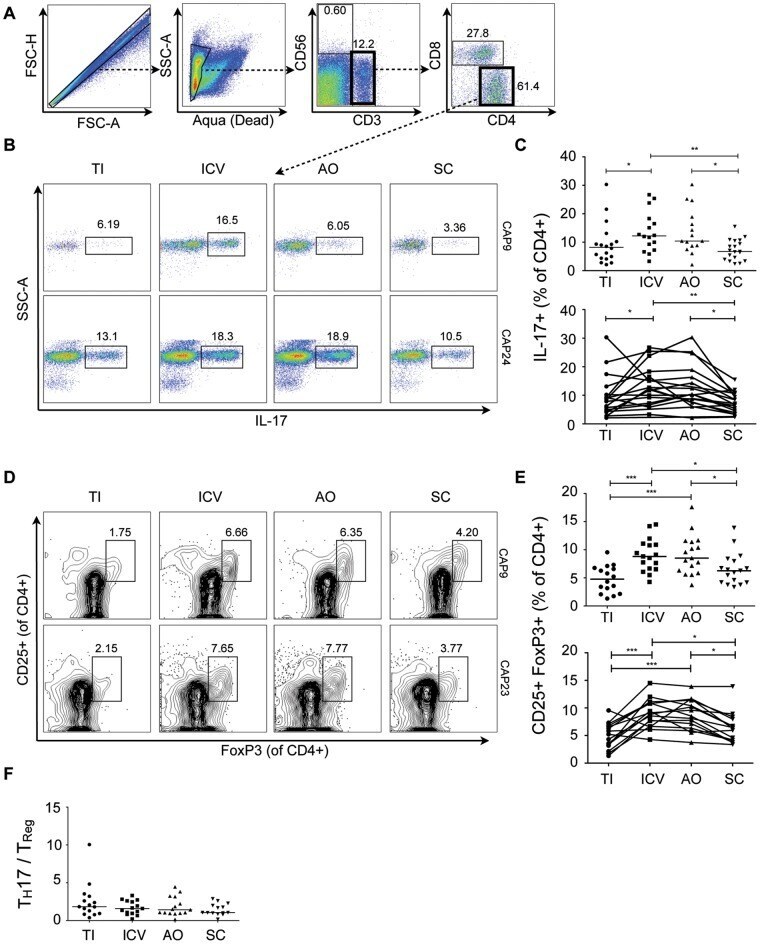
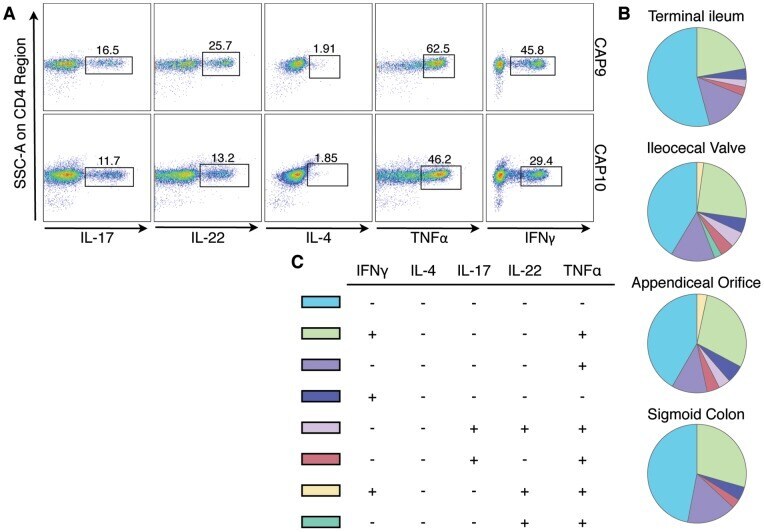
- Figure 1 T H 17 and T Reg cells are enriched in the healthy human cecum. A) Representative gating strategy for the FACS analysis of lamina propria mononuclear cells from pinch biopsies obtained from four regions of healthy colonic mucosa. B) Representative FACS plots for two subjects (CAP9 and CAP24) showing IL-17 + cells (gated on CD4 + cells) from four biopsy locations in each subject. C) Cumulative data of IL-17 + CD4 + cells for all subjects. The top panel includes data from samples from all subjects with available flow cytometry data (N = 19) whereas the bottom panel shows data from subjects who have a complete set of paired samples from all four biopsy locations (N = 15). D) Representative FACS plots for two subjects (CAP9 and CAP23) showing CD25 + FoxP3 + cells (gated on CD4 + cells). E) Cumulative data of CD25 + FoxP3 + cells for all subjects. F) T H 17/T Reg ratios were plotted for all subjects according to biopsy location. Unless otherwise indicated, differences were not significant. * P
- Submitted by
- Invitrogen Antibodies (provider)
- Main image

- Experimental details
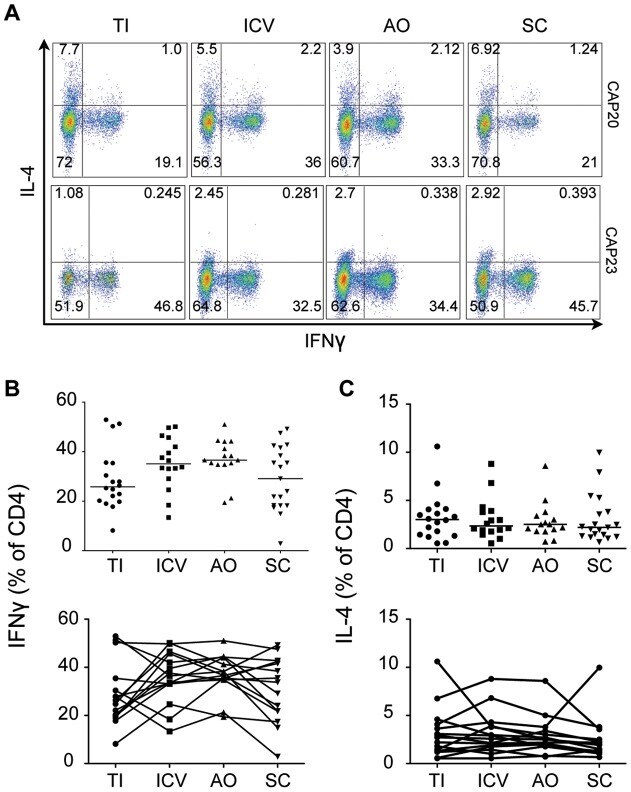
- Figure 4 T H 1 and T H 2 lymphocyte populations do not vary by region. A) Representative gating strategy showing IFNgamma and IL-4 staining of CD4 + cells isolated from four regions of the intestine in two subjects (CAP 20 and CAP23). B) IFNgamma and C) IL-4 production by CD4 + isolated from each region for all subjects. Differences between regions are not statistically significant (two tailed Mann-Whitney). TI: Terminal Ileum, ICV: Ileocecal Valve, AO: Appendiceal Orifice, SC: Sigmoid Colon.
- Submitted by
- Invitrogen Antibodies (provider)
- Main image
- Experimental details
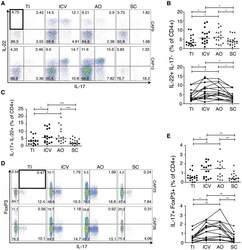
- Figure 3 T H 22 and IL-17 + FoxP3 + cells are enriched in the healthy human cecum. A) Representative FACS plots for two subjects (CAP9 and CAP12) showing intracellular cytokine staining for IL-17 and IL-22 of lamina propria CD4 + cells. B) Cumulative data of IL-22 + IL-17 - CD4 + cells for all subjects. The top panel includes data from all samples from all subjects (N = 19) whereas the bottom panel shows data from subjects (N = 15) who have a complete set of paired samples from all four biopsy locations. C) Representative FACS plots for two subjects (CAP23 and CAP26) showing staining for IL-17 + FoxP3 + lamina propria CD4 + cells. D) Cumulative data of IL-17 + FoxP3 + CD4 + cells for all subjects. Unless otherwise indicated, differences were not significant. * P

- Submitted by
- Invitrogen Antibodies (provider)
- Main image
- Experimental details
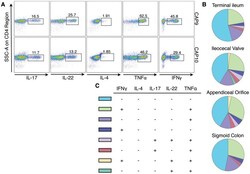
- Figure 5 Polycytokine producing CD4 + cells analyzed by Boolean gate analysis from different regions of the intestinal tract. A) Boolean gates on IL-17, IL-22, IL-4, TNFalpha and IFNgamma positive lamina propria CD4 + cells. Shown are representative FACS plots gated on CD4 + cells from the ileocecal valve of two subjects (CAP9 and CAP10). B) Pie charts showing the averaged pattern of cytokine production in CD4 + cells from the different regions of the gut (from N = 22 subjects). Each slice within the pie chart represents a specific combination of cytokine staining (denoted in C). Data is shown only for combinations with frequencies >2% of the total CD4 + population. IL-22 + TNFalpha + IFNgamma + cells are >2% of CD4 + cells only from the ileocecal valve and appendiceal orifice. The permutation test at 10,000 permutations did not demonstrate significant differences among the pie charts represented.
- Submitted by
- Invitrogen Antibodies (provider)
- Main image
- Experimental details
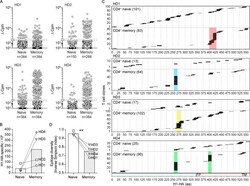
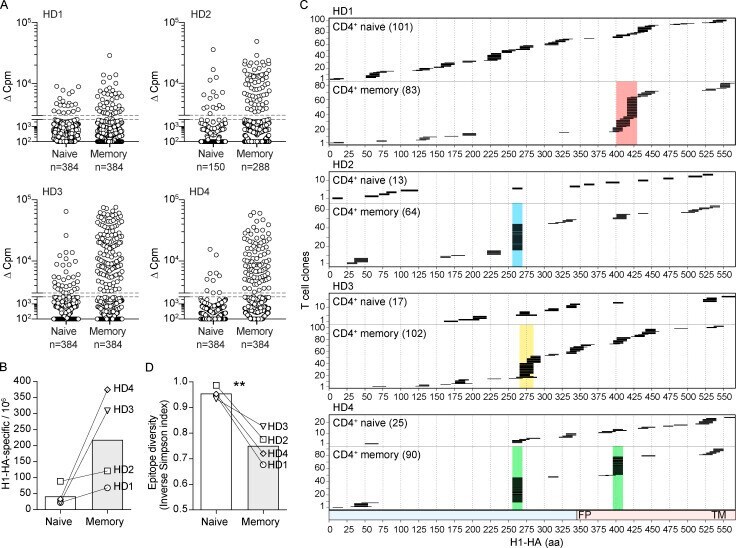
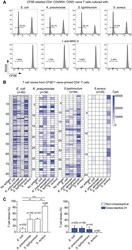
- Figure 2. Isolation and epitope mapping of H1-HA-reactive CD4 + T cells from naive and memory compartments of influenza vaccinated donors. (A) Naive and memory CD4 + T cells were FACS sorted from PBMCs of four donors and polyclonally expanded in multiple wells, each containing 1,000-2,000 cells. The number of wells ranged from 150 to 384, depending on the number of cells isolated (see Materials and methods). After 14-21 d, the amplified naive and memory T cell libraries were screened against a pool of overlapping peptides spanning the entire H1-HA sequence in the presence of autologous APCs. Proliferation was assessed on day 4 after a 16-h pulse with [ 3 H]thymidine. Data are expressed as the counts per minute, after subtraction of background proliferation (Deltacpm). The proliferative response of each T cell clone in the library is represented by a single dot. The specificity of positive cultures was confirmed in three independent experiments. (B) Frequencies of H1-HA-specific T cells within naive or memory CD4 + T cells was calculated based on number of negative wells according to the Poisson distribution. Data are expressed as frequency per million of naive or memory CD4 + T cells. Each symbol indicates a different donor. (C) Epitope mapping of H1-HA-specific T cell clones from naive or memory libraries. The epitopes were identified by screening the T cell cultures with overlapping peptides spanning the entire H1-HA sequence in at least two independent experiments, with co
- Submitted by
- Invitrogen Antibodies (provider)
- Main image
- Experimental details
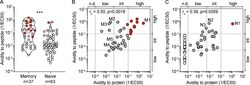
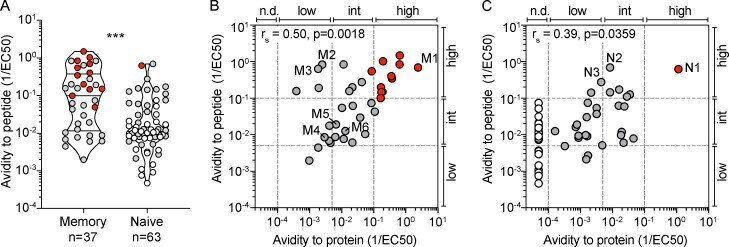
- Figure 3. H1-HA-specific naive and memory CD4 + T cell clones show different functional avidities. Functional avidity of H1-HA-reactive CD4 + T cell clones isolated from donor HD1 was determined by stimulation with titrated doses of synthetic H1-HA peptides or recombinant H1-HA in the presence of autologous monocytes. Proliferation was assessed on day 3 after a 16-h pulse with [ 3 H]thymidine; EC 50 values were calculated by nonlinear regression curve fit. Shown are mean data of one experiment done with each clone in duplicate and are representative of three independent experiments. (A) Violin plots of the frequency distribution of reciprocal EC 50 values of T cell clones from the memory or naive compartment stimulated with titrated doses of H1-HA peptides. T cell clones specific for the immunodominant H1-HA 411-430 epitope are reported as red dots. Lines represent the median and quartiles. ***, P < 0.001 as determined by two-tailed Mann-Whitney U test. (B and C) Scatter plots of reciprocal EC 50 values of T cell clones from the memory (B) or naive (C) compartment, stimulated in parallel with recombinant H1-HA (x axis) and synthetic peptides (y axis). EC 50 values below the detection limit for stimulations with recombinant H1-HA were set arbitrarily to 20 ug/ml; the corresponding T cell clones are reported as white dots. Spearman correlation was calculated based on EC 50 pairs from T cell clones responding to both peptides and recombinant H1-HA (B, n = 36; C, n = 29). Thresho
- Submitted by
- Invitrogen Antibodies (provider)
- Main image
- Experimental details
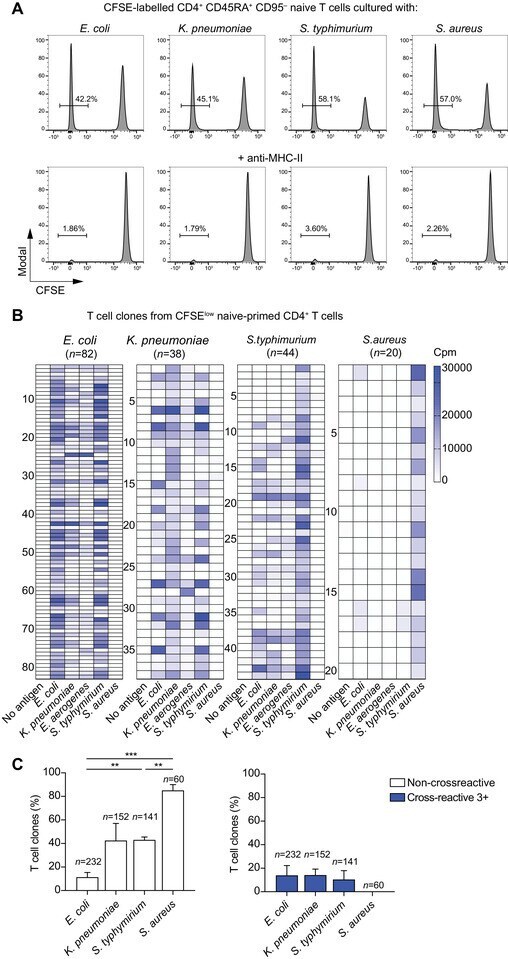
- Figure 5 Cross-reactive T cells to Enterobacteriaceae are already detected in the naive repertoire. (A) Human naive CD4 + CD45RA + CD95 - T cells were flow cytometry-sorted at high purity, labeled with CFSE and primed in vitro for 10 days with the indicated heat-inactivated bacteria and autologous monocytes in absence (upper panel) or presence (lower panel) of anti-MHC-II blocking antibodies. Shown are the CFSE profiles by flow cytometry on day 10 after priming and the percentages of CFSE low proliferating cells from a representative donor out of a total of 6 different donors tested in 6 independent experiments. (B, C) Antigen-primed CFSE low T cells were cloned by limiting dilution. T cell clones isolated from each CFSE low fraction were screened with a panel of heat-inactivated bacteria in the presence of autologous monocytes. Proliferation was assessed on day 3 after a 16-h pulse with [ 3 H]-thymidine and expressed as counts per min (Cpm). The heatmaps report the Cpm of T cell clones isolated from CFSE low fractions of a representative donor. The data are representative of at least two independent experiments (B). The antigen used for the initial in vitro priming and the number of clones tested are reported on top of each heatmap. Each row of the heatmaps refers to an individual T cell clone, stimulated with the antigens reported at the bottom. (C) Pooled data of the patterns of reactivity of T cell clones isolated from each CFSE low fraction of in vitro primed naive CD4 +
- Submitted by
- Invitrogen Antibodies (provider)
- Main image
- Experimental details
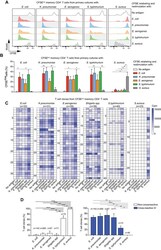
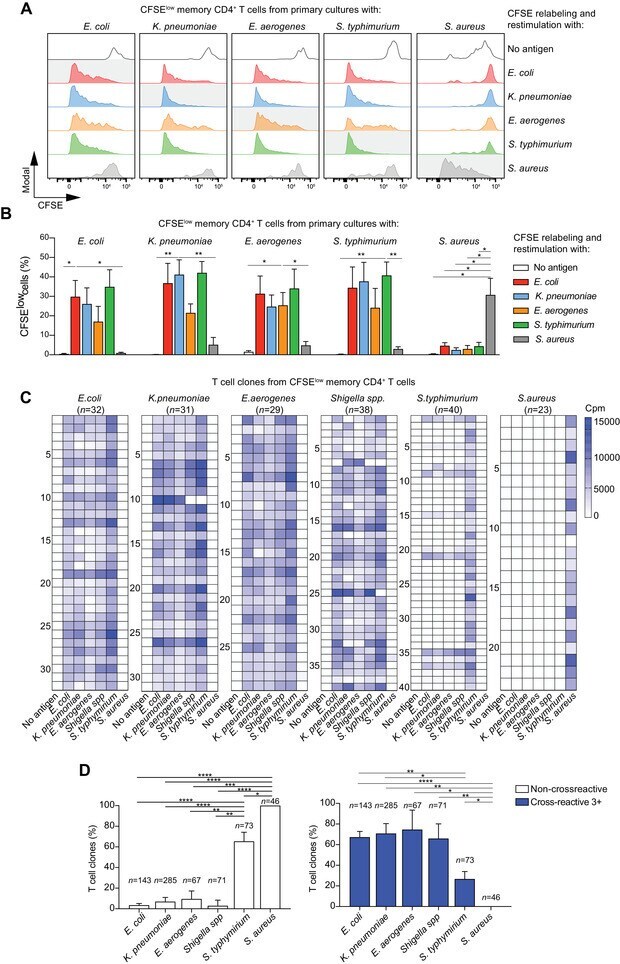
- Figure 3 Memory CD4 + T cells are broadly cross-reactive to Enterobacteriaceae. Bacteria-reactive polyclonal CD4 + T cell lines were obtained by flow cytometry-sorting of CFSE low cells from primary cultures of memory CD4 + T cells. Following expansion, the cells were re-labeled with CFSE and restimulated with the same bacteria (homologous restimulation) or with different bacteria (heterologous restimulation) in the presence of autologous monocytes and measured by flow cytometry. (A) CFSE profiles of polyclonal T cell lines from a representative donor reactive for the bacteria indicated on top and restimulated for 5 days with the bacteria indicated on the right. Homologous restimulation for each culture is highlighted with a grey shadow. (B) Percentage of CFSE low cells after secondary homologous or heterologous restimulation in n = 5 different donors (mean values +- SEM) in five independent experiments. CFSE low cells are reported as percentage of total events after normalization on live lymphocytes. * p -value < 0.05, ** p -value < 0.01, as determined by two tailed paired t -test compared to positive control (homologous antigen in the re-stimulation). (C and D) CFSE low cells from primary cultures of memory CD4 + T cells were also used to isolate a large panel of Enterobacteriaceae-reactive T cell clones by limiting dilution. The T cell clones specific for the bacteria indicated on top of the heatmaps in C were then screened for cross-reactivity with a panel of bacteria as
- Submitted by
- Invitrogen Antibodies (provider)
- Main image

- Experimental details
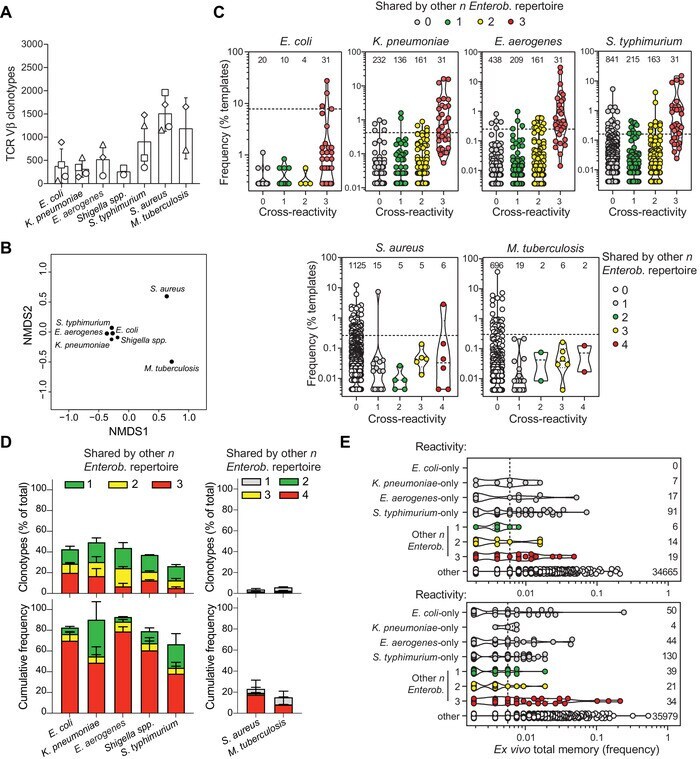
- Figure 4 Extensive clonotype sharing among Enterobacteriaceae-reactive memory CD4 + T cell repertoires. Bacteria-reactive CFSE low cells were flow cytometry-sorted from stimulated memory CD4 + T cells, and their TCR Vbeta repertoire was determined by deep sequencing. (A) Number of unique productive TCR Vbeta nucleotide rearrangements resolved from each bacteria-responsive memory repertoire in n = 2-4 different donors in two independent experiments. Each symbol represents a different donor. Bars indicate mean +- SD ( n = 2-4). (B) Pairwise similarity of each antigen-reactive TCR Vbeta repertoire was calculated by Chao-Jaccard overlap. The reciprocal distance of each TCR Vbeta repertoire was plotted using Kruskal''s nonmetric multidimensional scaling. Each point of the graph represents a distinct bacteria-reactive memory CD4 + TCR Vbeta repertoire (average from n = 2-4 donors): the closer the points, the more similar the repertoires in terms of sharing of TCR Vbeta clonotypes. (C) Violin plots of the frequency distribution of TCR Vbeta clonotypes reactive to Enterobacteriaceae or control bacteria from a representative donor. Each dot represents a unique TCR Vbeta nucleotide rearrangement, and the color code indicates the number of distinct Enterobacteriaceae-reactive repertoires in which the clonotype was found. Median values are reported as dashed lines. The number of clonotypes for each class of reactivity is reported on top. Dotted lines in the graphs indicate the frequency
- Submitted by
- Invitrogen Antibodies (provider)
- Main image
- Experimental details
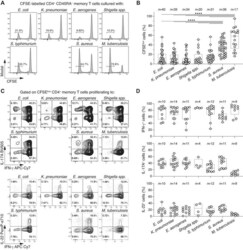
- Figure 1 Enterobacteriaceae-reactive memory CD4 + T cells are present in the blood of healthy donors and show a Th1*/17 phenotype. Human memory CD4 + T cells were isolated from PBMCs, labeled with CFSE and stimulated with the indicated heat-inactivated bacteria in the presence of autologous monocytes and analysed by flow cytometry. (A) CFSE profiles on day 6 in a representative donor. Numbers indicate percentage of CFSE low proliferating T cells. (B) Percentages of CFSE low cells in n =17-40 different donors analyzed in 20 independent experiments (1 or 2 donors per experiment). Each dot represents a donor, boxes are quartile values, whiskers represent the highest and lowest values, and lines represent the median values. Numbers on top indicate the total number of donors analyzed with the indicated bacteria **** p -value < 0.0001, as determined by two-tailed unpaired t -test. (C and D) IFN-gamma, IL-17A, and IL-22 production by CFSE low cells was measured by intracellular staining after stimulation with PMA and ionomycin in the presence of Brefeldin A in a representative donor (C) and in n = 4-14 different donors in seven independent experiments (D). In (C), numbers in quadrants indicate percent cells in each throughout. In (D), each dot represents a donor, boxes are quartile values, whiskers represent the highest and lowest values, and lines represent the median values. Shown are total percentages of cells producing IFN-gamma, IL-17, or IL-22, irrespective of the fact that th

- Submitted by
- Invitrogen Antibodies (provider)
- Main image
- Experimental details
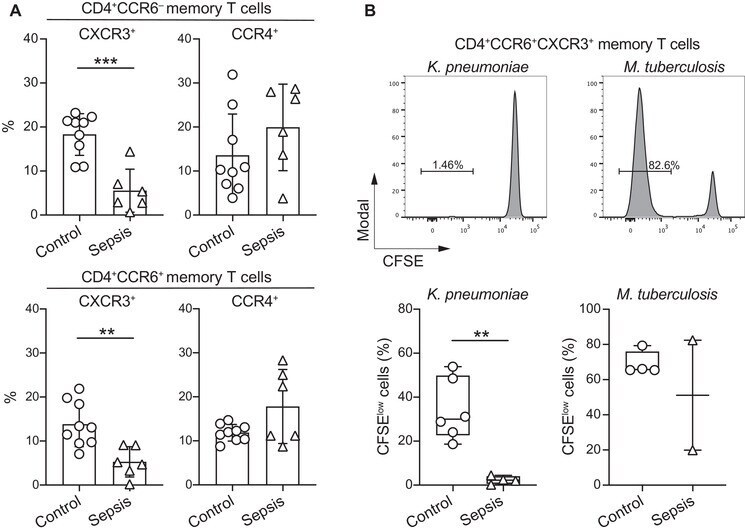
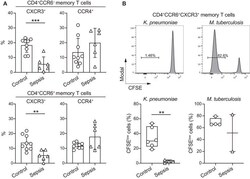
- Figure 2 Septic patients with systemic K. pneumoniae infection show reduced frequency of circulating CXCR3 + T cells and selectively lack K. pneumoniae -reactive T cells. (A) The surface expression of chemokine receptors by memory CD4 + T cells from PBMCs of n = 9 healthy controls and n = 6 septic patients with systemic K. pneumoniae infection was analyzed by flow cytometry. Shown are pooled data (mean +- SD, five independent experiments with samples from one or two septic patients and one or two healthy controls per experiment) of percentage of memory CD4 + T cells positive for combinations of chemokine receptors. (B) Human memory CCR6 + CXCR3 + CCR4 - Th cells were sorted, labeled with CFSE, and stimulated with the indicated antigens in the presence of autologous monocytes. Shown are CFSE profiles on day 6 in a representative septic patient (upper panel), and pooled data of percentage of CFSE low cells in healthy controls or septic patients (lower panel). Each dot represents a donor, boxes are quartile values, whiskers represent highest and lowest values, and lines represent the median values. ** p -value < 0.01, *** p -value < 0.001, as determined by two-tailed unpaired t -test. The data are from three independent experiments with samples from one or two septic patients and two healthy controls per experiment.