Explore
 Validate
 Learn
Learn Western blot
Antibody data
- Antibody Data
- Antigen structure
- References [2]
- Comments [0]
- Validations
- Western blot [2]
- Immunocytochemistry [3]
- Immunohistochemistry [3]
- Other assay [7]
Submit
Validation data
Reference
Comment
Report error
- Product number
- PA5-21444 - Provider product page

- Provider
- Invitrogen Antibodies
- Product name
- Desmoglein 2 Polyclonal Antibody
- Antibody type
- Polyclonal
- Antigen
- Recombinant full-length protein
- Description
- Recommended positive controls: HeLa, 293T, H1299, Molt-4. Predicted reactivity: Mouse (87%), Bovine (87%). Store product as a concentrated solution. Centrifuge briefly prior to opening the vial.
- Reactivity
- Human, Mouse
- Host
- Rabbit
- Isotype
- IgG
- Vial size
- 100 μL
- Concentration
- 0.36 mg/mL
- Storage
- Store at 4°C short term. For long term storage, store at -20°C, avoiding freeze/thaw cycles.
Submitted references Plakophilin 3 and Par3 facilitate desmosomes' association with the apical junctional complex.
Acute effects of cell stretch on keratin filaments in A549 lung cells.
Indra I, Troyanovsky RB, Green KJ, Troyanovsky SM
Molecular biology of the cell 2021 Sep 1;32(19):1824-1837
Molecular biology of the cell 2021 Sep 1;32(19):1824-1837
Acute effects of cell stretch on keratin filaments in A549 lung cells.
Lutz A, Jung D, Diem K, Fauler M, Port F, Gottschalk K, Felder E
FASEB journal : official publication of the Federation of American Societies for Experimental Biology 2020 Aug;34(8):11227-11242
FASEB journal : official publication of the Federation of American Societies for Experimental Biology 2020 Aug;34(8):11227-11242
No comments: Submit comment
Supportive validation
- Submitted by
- Invitrogen Antibodies (provider)
- Main image
- Experimental details
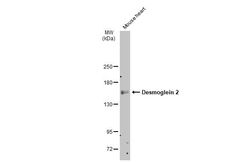
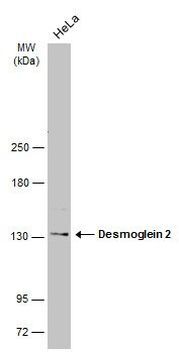
- Western Blot using Desmoglein 2 Polyclonal Antibody (Product # PA5-21444). Mouse tissue extract (50 µg) was separated by 5% SDS-PAGE, and the membrane was blotted with Desmoglein 2 Polyclonal Antibody (Product # PA5-21444) diluted at 1:500. The HRP-conjugated anti-rabbit IgG antibody was used to detect the primary antibody.
- Submitted by
- Invitrogen Antibodies (provider)
- Main image
- Experimental details
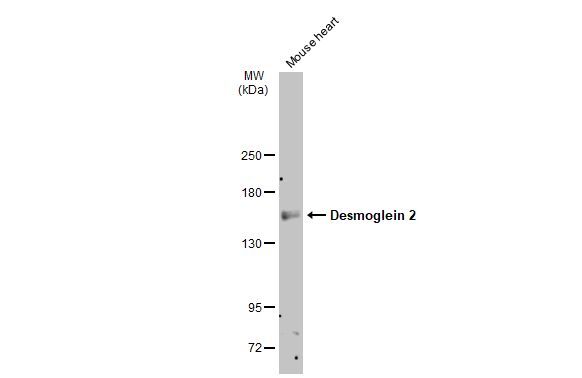
- Western blot analysis of Desmoglein 2 was performed by separating 30 µg of whole cell extract by 5% SDS-PAGE. Proteins were transferred to a membrane and probed with a Desmoglein 2 Polyclonal Antibody (Product # PA5-21444) at a dilution of 1:1000. The HRP-conjugated anti-rabbit IgG antibody was used to detect the primary antibody.
Supportive validation
- Submitted by
- Invitrogen Antibodies (provider)
- Main image
- Experimental details
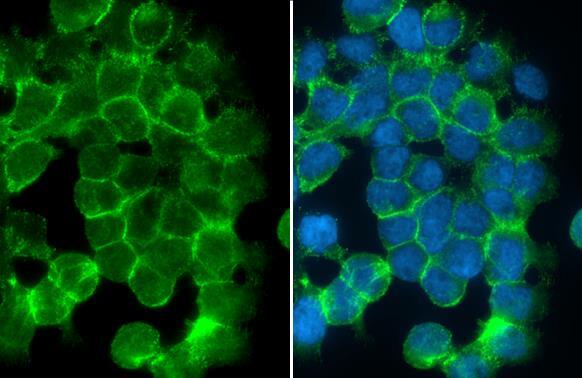
- Immunofluorescent analysis of Desmoglein-2 in paraformaldehyde-fixed A431 cells using a Desmoglein-2 polyclonal antibody (Product # PA5-21444) at a 1:500 dilution.
- Submitted by
- Invitrogen Antibodies (provider)
- Main image

- Experimental details
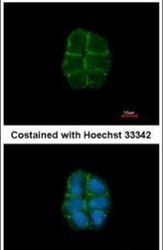
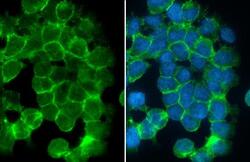
- Desmoglein 2 Polyclonal Antibody detects Desmoglein 2 protein at cell membrane by immunofluorescent analysis. Sample: A431 cells were fixed in 4% paraformaldehyde at RT for 15 min. Green: Desmoglein 2 stained by Desmoglein 2 Polyclonal Antibody (Product # PA5-21444) diluted at 1:500. Blue: Fluoroshield with DAPI .
- Submitted by
- Invitrogen Antibodies (provider)
- Main image
- Experimental details
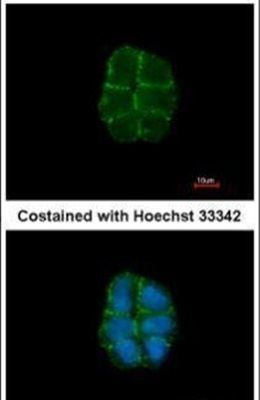
- Desmoglein 2 Polyclonal Antibody detects Desmoglein 2 protein at cell membrane by immunofluorescent analysis. Sample: A431 cells were fixed in 4% paraformaldehyde at RT for 15 min. Green: Desmoglein 2 stained by Desmoglein 2 Polyclonal Antibody (Product # PA5-21444) diluted at 1:500. Blue: Fluoroshield with DAPI .

Supportive validation
- Submitted by
- Invitrogen Antibodies (provider)
- Main image
- Experimental details
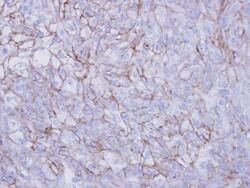
- Immunohistochemical analysis of paraffin-embedded DU145 xenograft , using Desmoglein-2 (Product # PA5-21444) antibody at 1:100 dilution. Antigen Retrieval: EDTA based buffer, pH 8.0, 15 min.

- Submitted by
- Invitrogen Antibodies (provider)
- Main image
- Experimental details
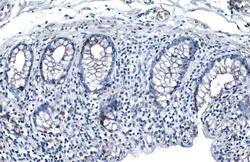
- Desmoglein 2 Polyclonal Antibody detects Desmoglein 2 protein at cell membrane by immunohistochemical analysis. Sample: Paraffin-embedded human colon cancer. Desmoglein 2 stained by Desmoglein 2 Polyclonal Antibody (Product # PA5-21444) diluted at 1:500. Antigen Retrieval: Citrate buffer, pH 6.0, 15 min.

- Submitted by
- Invitrogen Antibodies (provider)
- Main image
- Experimental details
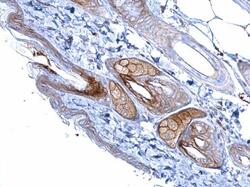
- Immunohistochemistry (Paraffin) analysis of Desmoglein 2 was performed in paraffin-embedded mouse skin tissue using Desmoglein 2 Polyclonal Antibody (Product # PA5-21444) at a dilution of 1:500.

Supportive validation
- Submitted by
- Invitrogen Antibodies (provider)
- Main image

- Experimental details
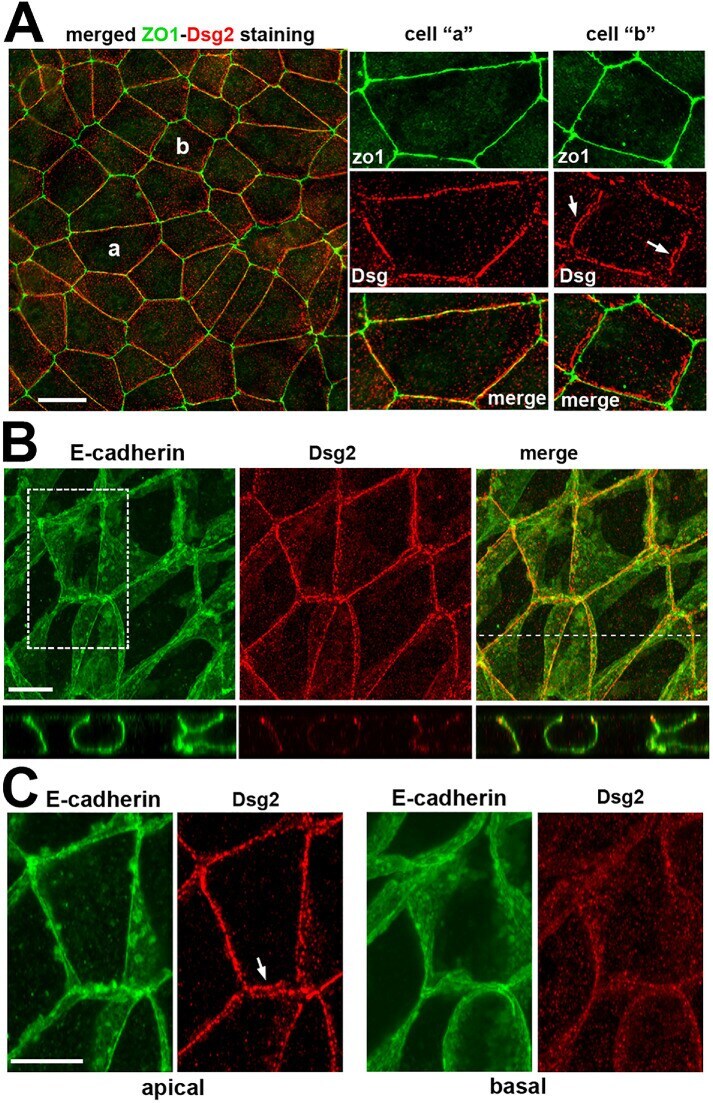
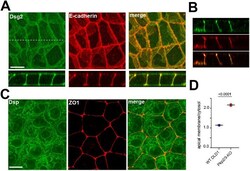
- FIGURE 1: Overall distribution of DSMs in DLD1 cells. (A) Representative widefield images of DLD1 in cell culture showing ZO1-stained TJs (green) and Dsg2-stained DSMs (red). Higher magnification of two cells, marked ""a"" and ""b,"" are shown in the right panels. Note that in a majority of the cells shown here, DSMs are arranged into linear arrays that tightly align with TJs (cell ""a""). In some cases, as in the cell ""b,"" the DSM array deviates from TJs. Bars, 20 um. (B) Confocal images of DLD1 cells stained for the AJ marker E-cadherin (E-cadherin, green) and Dsg2 (red). Projections of all x-y optical slices are shown. Bar, 10 um. The optical z-cross-sections along the white line of the merged image are shown at the bottom. Note that the linear arrays of DSMs are aligned with AJs. (C) The zoomed area indicated by the dashed box in B. Projections of optical z slices spanning apical (apical) and basal (basal) portions of the cells are presented. The apical region is reconstructed by a projection of three optical z slices spanning the most apical 1.5 um of the cells. The basal region is a projection of all nine remaining optical z slices spanning 4.5 um of the cell positioned between the apical region and the basal cell membrane. Note that even those DSM arrays that deviate from the AJC (arrow) are located within the apical section of the cells. Apicobasal distribution of desmosomes is quantified in Figure 3, C and D . Bar, 10 um.
- Submitted by
- Invitrogen Antibodies (provider)
- Main image

- Experimental details
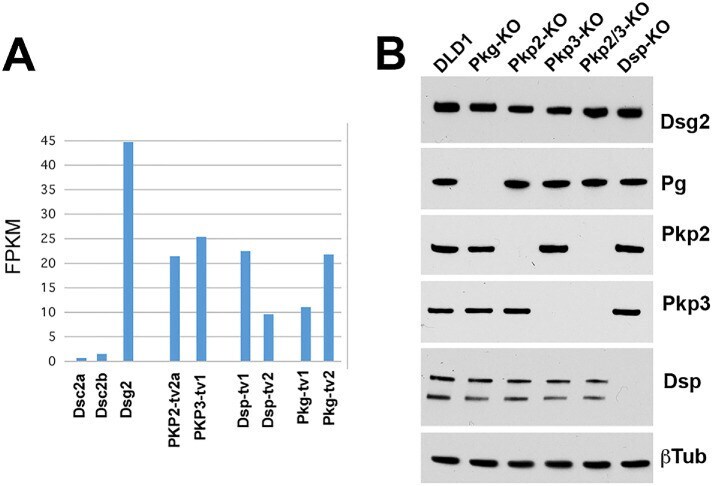
- FIGURE 2: Expression profile of DSM proteins in DLD1 cells and their KO progenitors. (A) FPKM for each of DSM protein genes obtained from the RNA-seq analyses of DLD1 cells. (B) Western blot characterization of the major DSM proteins expressed in wt DLD1 cells and in their progenitors obtained after KO of specific DSM proteins, Pg-KO, Pkp2-KO, Pkp3-KO, Pkp2/3-KO, and Dsp-KO. The presented Western blots were obtained from the same experiment using the same set of protein samples for each blot. beta-Tubulin staining (betaTub) serves as a loading control. Data are representative of three independent experiments. Note that the lack of any of the major DSM proteins does not significantly change the expression levels of other tested proteins.
- Submitted by
- Invitrogen Antibodies (provider)
- Main image
- Experimental details
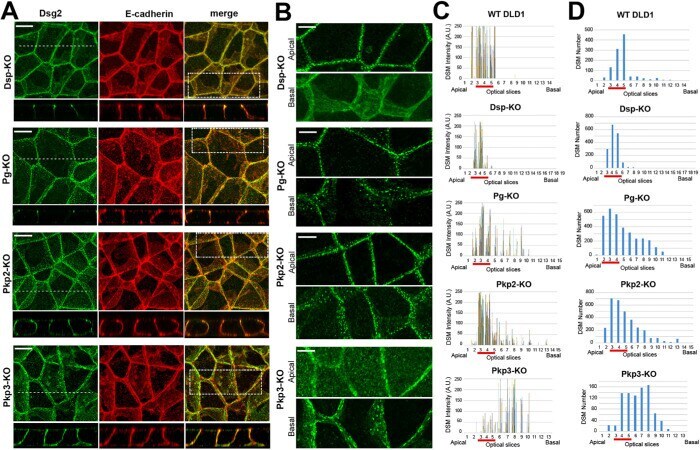
- FIGURE 3: Spatial organization of DSMs in cells on KO of major DSM proteins. (A) DLD1 cells deficient for each of four major DSM proteins (Dsp-KO, Pg-KO, Pkp2-KO, and Pkp3-KO) were stained for Dsg2 (green) and E-cadherin (red) as shown for wt DLD1 cells in Figure 1B . Projections of all x-y optical slices are shown. Bar, 10 um. The optical z-cross-sections along the white dashed lines (depicted in Dsg2 images) are shown at the bottom. (B) The cell areas indicated by dashed boxes in A were split into two ""apical"" and ""basal"" halves as in Figure 1C for wt DLD1 cells. Note that DSMs are significantly more abundant in the apical region in Dsp-KO, Pg-KO, and Pkp2-KO cells. This situation is reversed in the Pkp3-KO cells. Note that the heights of the cells slightly vary from sample to sample, resulting in different numbers of confocal slices. Bar, 5 mum. (C) Apicobasal plots of DSM fluorescence intensity (bars of different colors represent individual DSMs) and (D) their abundance along the confocal slices (the step is 0.5 mum). The graphs quantify the full-view images (50 x 50 mum 2 ) presented in A and the control WT DLD1 cells presented in Figure 1B . Note that each image contains about eight cells. The slice numbering starts from the slice in which the most apical features in at least one cell are in focus. The slices presenting AJC are highlighted with a red line. The slightly different number of slices is due to some variability in the cell heights. A.U., arbitrary unit. D
- Submitted by
- Invitrogen Antibodies (provider)
- Main image
- Experimental details
- FIGURE 4: Dsg2 and Dsp in DLD-Pkp2/3-KO cells. (A) The Pkp2/3-KO cells were stained for Dsg2 (green) and E-cadherin (red) and imaged by confocal microscopy. Projections of all x-y optical slices are shown. Bar, 10 um. The optical z-cross-sections along the white dashed line (depicted in the Dsg2 image) are shown at the bottom. (B) Representative widefield image of DLD1 cell culture showing ZO1-stained TJs (red) and Dsp-stained DSMs (green). Bar, 10 um. (C) Representative optical z-cross-sections of wt DLD cells stained as in A are shown for comparison. (D) The ratios of the apical to cytosolic Dsg2 fluorescence in WT and Pkp2/3-KO DLD1 cells. The measured apical areas do not include cell-cell contacts. Black bar shows t test p values.

- Submitted by
- Invitrogen Antibodies (provider)
- Main image
- Experimental details
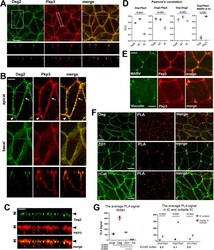
- FIGURE 5: Dual localization of Pkp3 and other junctional proteins in DLD1 cells. (A) Wt DLD1 cells were stained for Dsg2 (green) and E-cadherin (red). Projections of all x-y optical slices are shown. Bar, 10 um. The optical z-cross-sections along the white dashed lines (depicted in Dsg2 image) are shown at the bottom. (B) The cell areas indicated by dashed boxes in A were split into two ""apical"" and ""basal"" halves as described in Figure 1C . Note that the majority of Pkp3 is localized in the apical cell portion together with Dsg2-enriched puncta. However, Pkp3 was also located outside of desmosomal puncta in both bC contacts (arrow) and tC contacts (arrowhead). The optical z-cross-sections show that a proportion of Pkp3 is more apical than DSMs. Bar, 5 um (C) A Z-plane slice of the cell-cell contact marked by dashed line in A. Bar, 3 mum. Note that the majority of DSMs are located within a single confocal frame (arrowhead), while Pkp3 is also abundant in one additional apical frame (arrows). (D) PCC for Dsp-Pkp3, Dsg2-Pkp3, Dsp-Dsg2 pairs quantified for full-view images (Total), only for bC contacts (bC), or only for tC contacts (tC). PCC for Dsp-MARVELD-2 (MARV) and for Pkp3-MARVELD2 was taken only for tC contacts. For quantification details, see Materials and Methods . Blue and black bars represent one-way ANOVA or t test p values, correspondingly. (E) DLD1 cells were double stained for Pkp3 (red) and for markers of tC-TJs, MARVELD-2 (MARVELD-2, green) or tC-AJs, vincul
- Submitted by
- Invitrogen Antibodies (provider)
- Main image

- Experimental details
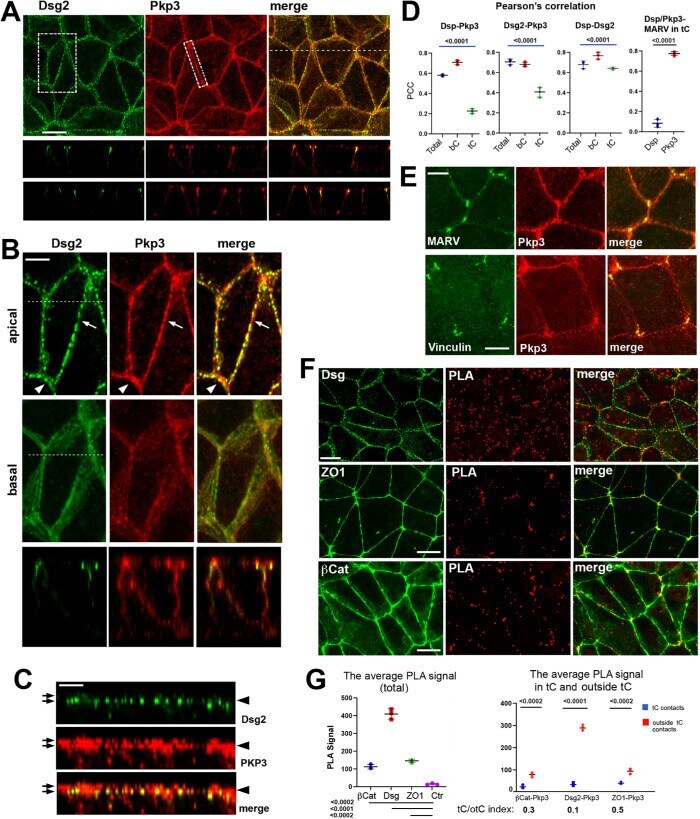
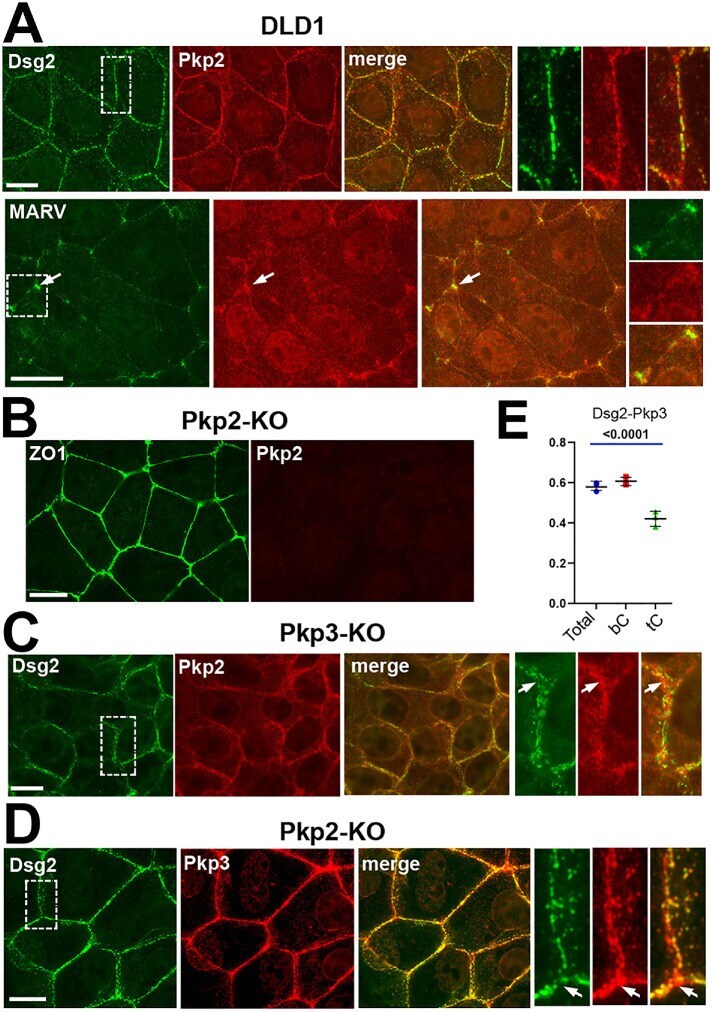
- FIGURE 6: Pkp2 and Pkp3 localizations are mutually independent. Representative widefield images of corresponding cell cultures are shown. The tC contact areas indicated by dashed boxes are zoomed in the right panels. Bars, 10 mum. (A) Wt DLD1 cells are co-stained for Pkp2 (red) and either for Dsg2 (Dsg2) or tC-TJs marker MARVELD-2 (MARV). Note that Pkp2 in tC contacts (arrows), similar to Pkp3, is localized outside of Dsg2-marked DSMs and roughly overlaps with tC-TJs marked by MARVELD-2. (B) Double staining for Pkp2 (Pkp2, red) and ZO1 (ZO1, green) in Pkp2-KO cells. A complete absence of Pkp2 staining in these cells demonstrates specificity of Pkp2 staining in the control wt DLD1 cells presented in A. (C) Dsg2-sPkp2 staining in Pkp3-KO cells. Note that the lack of Pkp3 did not abolish foci of Pkp2 staining at tC contacts (one example is indicated by an arrow in the zoomed area). (D) DLD-Pkp2-KO cells were co-stained for Pkp3 (Pkp3, red) and Dsg2 (Dsg2, green). Note that Pkp3 in these cells is still enriched in the tC areas (arrows). (E) PCC for Dsg2-Pkp3 pair taken from randomly selected images (Total), only for bC contacts (bC), or only for tC contacts (tC). The blue bar represents one-way ANOVA p value.
- Submitted by
- Invitrogen Antibodies (provider)
- Main image
- Experimental details
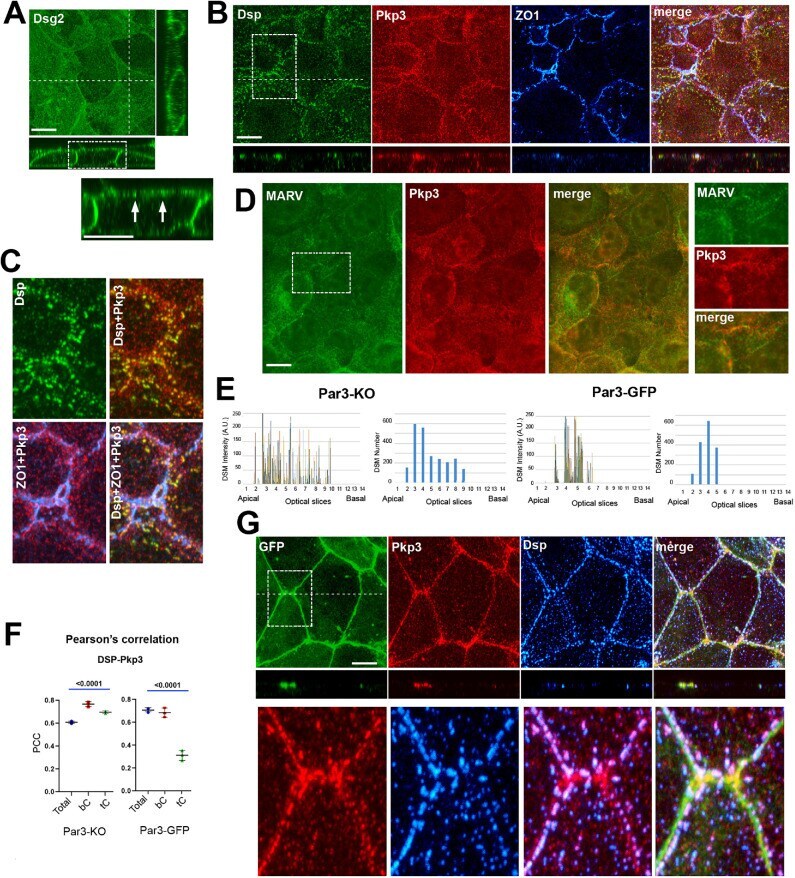
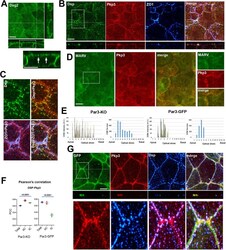
- FIGURE 8: Par3-KO cells are unable to correctly organize DSMs and Pkp3. (A) Par3-deficient DLD1 cells were stained for Dsg2 and processed by confocal microscopy. Two optical confocal cross-sections (along the white lines) are presented at the bottom and right margins. The zoomed region of one of the cross-sections is shown below. Note that Dsg2-stained DSMs are hardly visible because of high membranous Dsg2 staining. Also note that Dsg2 also exhibits apical membrane staining. Arrows show two DSM-like puncta on the apical membrane. Bar, 10 mum (B) Confocal image of Par3-KO cells triple stained for Dsp, Pkp3, and ZO1. Bar, 10 mum. (C) The zoomed area indicated by the dashed box in (B) is presented in four staining combinations as indicated in Figure 7B . Note that no extraDSM Pkp3 staining is detectable in tC contacts. (D) The Pkp3 in Par3-KO cells was co-stained with the tC-TJ marker MARVELD-2. Bar, 10 mum. One of the tC contact areas is magnified in the left panel. No MARVELD-2-enriched tC-TJs could be detected in these areas. (E) The apicobasal plots of DSM distribution and abundance derived from the full-view confocal images of Par3-KO cells (Par3-KO) and the same cells after re-expression of GFP-tagged Par3 (Par3-GFP). (F) Pearson's Dsp-Pkp3 correlation coefficient taken for the entire image (Total), only for bC contacts bC), or only for tC contacts (tC, based on geometric criteria). Blue bars represent one-way ANOVA p value. (G) The GFP-tagged version of Par3 (Par3-GFP) w