Explore
 Validate
 Learn
Learn Western blot
Antibody data
- Antibody Data
- Antigen structure
- References [2]
- Comments [0]
- Validations
- Western blot [3]
- Immunohistochemistry [2]
- Chromatin Immunoprecipitation [1]
Submit
Validation data
Reference
Comment
Report error
- Product number
- MA1-20325 - Provider product page

- Provider
- Invitrogen Antibodies
- Product name
- Phospho-AKT1 (Ser473) Monoclonal Antibody (104A282)
- Antibody type
- Monoclonal
- Antigen
- Synthetic peptide
- Description
- MA1-20325 detects phospho-AKT1 (pS473) in human and mouse samples.
- Reactivity
- Human, Mouse, Chicken/Avian, Zebrafish
- Host
- Mouse
- Isotype
- IgG
- Antibody clone number
- 104A282
- Vial size
- 50 µg
- Concentration
- 1 mg/mL
- Storage
- Store at 4°C short term. For long term storage, store at -20°C, avoiding freeze/thaw cycles.
Submitted references Wild‑type IDH1 affects cell migration by modulating the PI3K/AKT/mTOR pathway in primary glioblastoma cells.
Disentangling Pro-mitotic Signaling during Cell Cycle Progression using Time-Resolved Single-Cell Imaging.
Shen X, Wu S, Zhang J, Li M, Xu F, Wang A, Lei Y, Zhu G
Molecular medicine reports 2020 Sep;22(3):1949-1957
Molecular medicine reports 2020 Sep;22(3):1949-1957
Disentangling Pro-mitotic Signaling during Cell Cycle Progression using Time-Resolved Single-Cell Imaging.
Benary M, Bohn S, Lüthen M, Nolis IK, Blüthgen N, Loewer A
Cell reports 2020 Apr 14;31(2):107514
Cell reports 2020 Apr 14;31(2):107514
No comments: Submit comment
Supportive validation
- Submitted by
- Invitrogen Antibodies (provider)
- Main image

- Experimental details
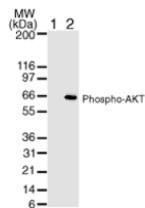
- Western blot analysis of Phospho-AKT1 pSer473 in untreated (lane 1) and PDGF-treated (lane 2) NIH/3T3 extract. Samples were probed with a Phospho-AKT1 pSer473 monoclonal antibody (Product # MA1-20325).
- Submitted by
- Invitrogen Antibodies (provider)
- Main image

- Experimental details
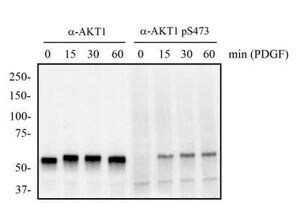
- Western Blot analysis of Phospho-AKT1 (Ser473) was performed by loading 3T3 cells treated with and without PDGF (50 ng/ml). Proteins were transferred to a membrane and probed with a Phospho-AKT1 (Ser473) Monoclonal Antibody (104A282) (Product # MA1-20325) at a dilution of 2 µg/mL.
- Submitted by
- Invitrogen Antibodies (provider)
- Main image

- Experimental details
- Western Blot analysis of Phospho-AKT1 (Ser473) was performed by loading untreated (lane 1) and PDGF treated (lane 2) NIH-3T3 lysates. Proteins were transferred to a membrane and probed with a Phospho-AKT1 (Ser473) Monoclonal Antibody (104A282) (Product # MA1-20325) at a dilution of 2 µg/mL.

Supportive validation
- Submitted by
- Invitrogen Antibodies (provider)
- Main image
- Experimental details
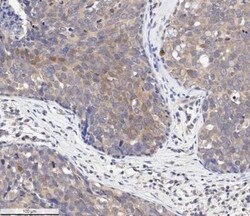
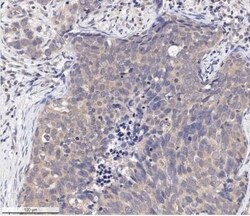
- Immunohistochemistry (Paraffin) analysis of Phospho-AKT1 (Ser473) in human breast carcinoma tissue using Phospho-AKT1 (Ser473) Monoclonal Antibody (104A282) (Product # MA1-20325) at a dilution of 1:250. Antigen retrieval : Heat induced antigen retrieval (HIER) using 10mM sodium citrate buffer (pH 6.0).

- Submitted by
- Invitrogen Antibodies (provider)
- Main image
- Experimental details
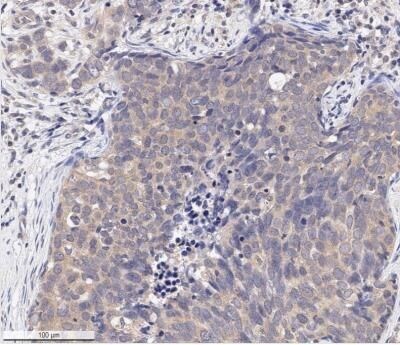
- Immunohistochemistry (Paraffin) analysis of Phospho-AKT1 (Ser473) in human breast carcinoma tissue using Phospho-AKT1 (Ser473) Monoclonal Antibody (104A282) (Product # MA1-20325) at a dilution of 1:250. Antigen retrieval : Heat induced antigen retrieval (HIER) using 10mM sodium citrate buffer (pH 6.0).
Supportive validation
- Submitted by
- Invitrogen Antibodies (provider)
- Main image
- Experimental details
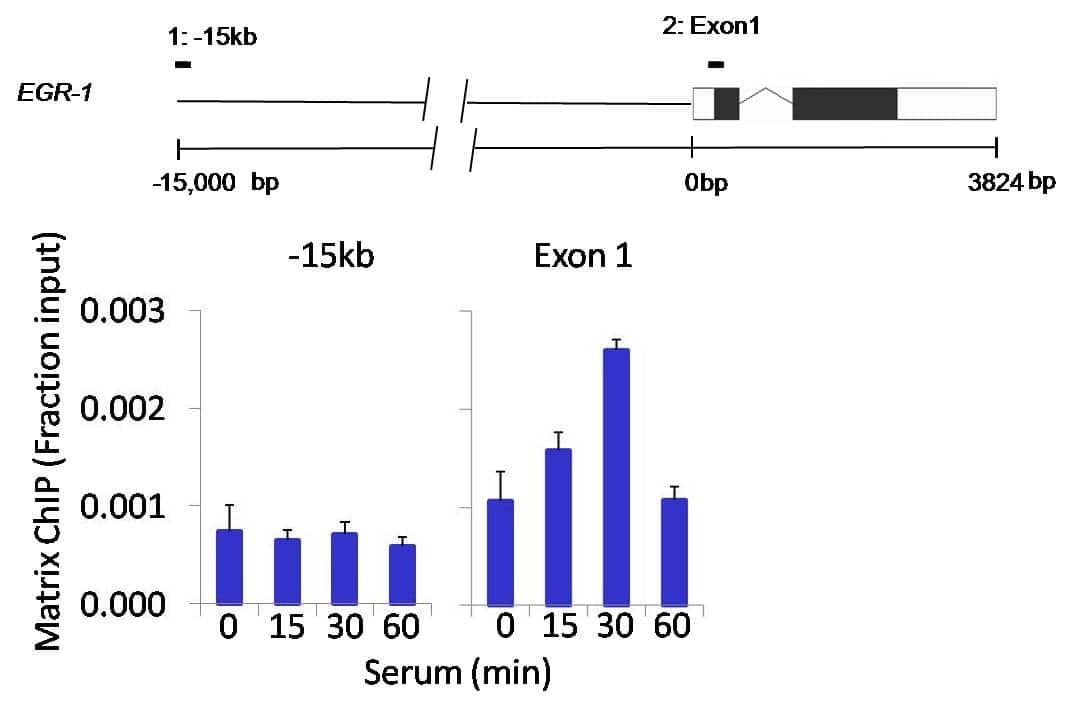
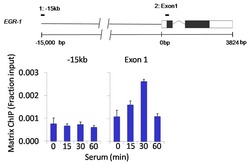
- Chromatin immunoprecipitation analysis of Phospho-AKT1 pSer473 was performed using cross-linked chromatin from 1 x 10⁶ HCT116 colon carcinoma cells treated with serum for 0, 15, 30, and 60 minutes. Immunoprecipitation was performed using a multiplex microplate Matrix ChIP assay (see reference for Matrix ChIP protocol: http://www.ncbi.nlm.nih.gov/pubmed/22098709) with 1.0 µL/100 µL well volume of a Phospho-AKT1 pSer473 monoclonal antibody (Product # MA1-20325). Chromatin aliquots from ~1 x 10⁵ cells were used per ChIP pull-down. Quantitative PCR data were done in quadruplicate using 1 µL of eluted DNA in 2 µL SYBR real-time PCR reactions containing primers to amplify -15kb upstream of the Egr1 gene or exon-1 of Egr1. PCR calibration curves were generated for each primer pair from a dilution series of sheared total genomic DNA. Quantitation of immunoprecipitated chromatin is presented as signal relative to the total amount of input chromatin. Results represent the mean +/- SEM for three experiments. A schematic representation of the Egr-1 locus is shown above the data where boxes represent exons (black boxes = translated regions, white boxes = untranslated regions); the zigzag line represents an intron; and the straight line represents upstream sequence. Regions amplified by Egr-1 primers are represented by black bars. Data courtesy of the Innovators Program.