Explore
 Validate
 Learn
Learn Western blot
Antibody data
- Antibody Data
- Antigen structure
- References [8]
- Comments [0]
- Validations
- Western blot [3]
- Immunocytochemistry [2]
- Other assay [6]
Submit
Validation data
Reference
Comment
Report error
- Product number
- OMA1-03061 - Provider product page

- Provider
- Invitrogen Antibodies
- Product name
- Phospho-AKT1 (Ser473) Monoclonal Antibody (14-6)
- Antibody type
- Monoclonal
- Antigen
- Synthetic peptide
- Description
- OMA1-03061 detects protein kinase B (PKB) phosphorylated at Ser473 from human and mouse samples. OMA1-03061 detects PKB 1,2,and 3.
- Antibody clone number
- 14-6
- Concentration
- 0.5 mg/mL
Submitted references Implications of cell division cycle associated 4 on the Wilm's tumor cells viability via AKT/mTOR signaling pathway.
Hypoxia-induced release, nuclear translocation, and signaling activity of a DLK1 intracellular fragment in glioma.
Sevoflurane inhibits the proliferation and invasion of hepatocellular carcinoma cells through regulating the PTEN/Akt/GSK‑3β/β‑catenin signaling pathway by downregulating miR‑25‑3p.
A-kinase-interacting protein 1 promotes EMT and metastasis via PI3K/Akt/IKKβ pathway in cervical cancer.
Active Vitamin D and Vitamin D Receptor Help Prevent High Glucose Induced Oxidative Stress of Renal Tubular Cells via AKT/UCP2 Signaling Pathway.
Cilostazol disrupts TLR-4, Akt/GSK-3β/CREB, and IL-6/JAK-2/STAT-3/SOCS-3 crosstalk in a rat model of Huntington's disease.
New insights on thyroid hormone mediated regulation of herpesvirus infections.
Fucoidan inhibits the migration and proliferation of HT-29 human colon cancer cells via the phosphoinositide-3 kinase/Akt/mechanistic target of rapamycin pathways.
Li S, Qin C, Chen Y, Wei D, Tan Z, Meng J
Renal failure 2021 Dec;43(1):1470-1478
Renal failure 2021 Dec;43(1):1470-1478
Hypoxia-induced release, nuclear translocation, and signaling activity of a DLK1 intracellular fragment in glioma.
Grassi ES, Pantazopoulou V, Pietras A
Oncogene 2020 May;39(20):4028-4044
Oncogene 2020 May;39(20):4028-4044
Sevoflurane inhibits the proliferation and invasion of hepatocellular carcinoma cells through regulating the PTEN/Akt/GSK‑3β/β‑catenin signaling pathway by downregulating miR‑25‑3p.
Cao Y, Lv W, Ding W, Li J
International journal of molecular medicine 2020 Jul;46(1):97-106
International journal of molecular medicine 2020 Jul;46(1):97-106
A-kinase-interacting protein 1 promotes EMT and metastasis via PI3K/Akt/IKKβ pathway in cervical cancer.
Zhang X, Liu S, Zhu Y
Cell biochemistry and function 2020 Aug;38(6):782-791
Cell biochemistry and function 2020 Aug;38(6):782-791
Active Vitamin D and Vitamin D Receptor Help Prevent High Glucose Induced Oxidative Stress of Renal Tubular Cells via AKT/UCP2 Signaling Pathway.
Zhu X, Wu S, Guo H
BioMed research international 2019;2019:9013904
BioMed research international 2019;2019:9013904
Cilostazol disrupts TLR-4, Akt/GSK-3β/CREB, and IL-6/JAK-2/STAT-3/SOCS-3 crosstalk in a rat model of Huntington's disease.
El-Abhar H, Abd El Fattah MA, Wadie W, El-Tanbouly DM
PloS one 2018;13(9):e0203837
PloS one 2018;13(9):e0203837
New insights on thyroid hormone mediated regulation of herpesvirus infections.
Figliozzi RW, Chen F, Hsia SV
Cell & bioscience 2017;7:13
Cell & bioscience 2017;7:13
Fucoidan inhibits the migration and proliferation of HT-29 human colon cancer cells via the phosphoinositide-3 kinase/Akt/mechanistic target of rapamycin pathways.
Han YS, Lee JH, Lee SH
Molecular medicine reports 2015 Sep;12(3):3446-3452
Molecular medicine reports 2015 Sep;12(3):3446-3452
No comments: Submit comment
Supportive validation
- Submitted by
- Invitrogen Antibodies (provider)
- Main image

- Experimental details
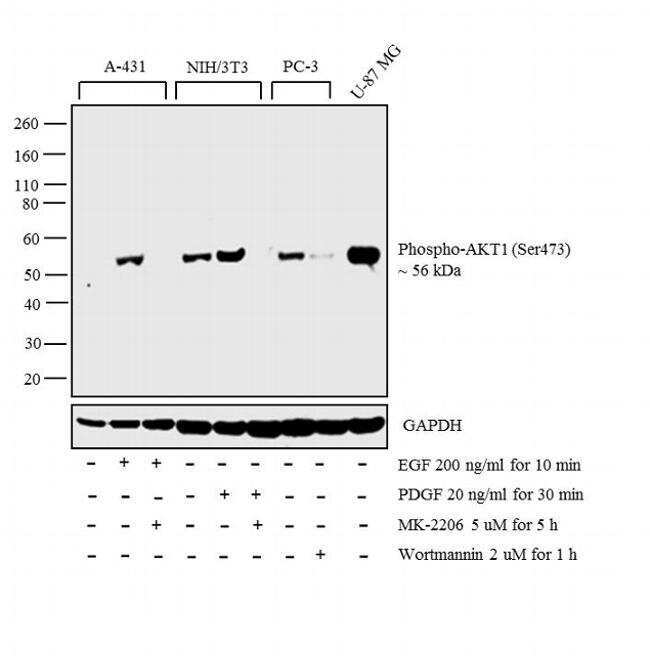
- Western blot analysis was performed on whole cell extracts (30 µg lysate) of A-431 (Lane 1), A-431 treated with EGF (200 ng/mL for 10 min) (Lane 2), A-431 treated with MK-2206 (5 uM for 5 h) followed by EGF treatment (200 ng/mL for 10 min) (Lane 3), NIH/3T3 (Lane 4), NIH/3T3 treated with PDGF (20 ng/mL for 30 min) (Lane 5), NIH/3T3 treated with MK-2206 (5uM for 5 h) followed by PDGF (20 ng/mL for 30 min) (Lane 6), PC-3 (Lane 7), PC-3 treated with Wortmannin (2 uM for 1 h) (Lane 8) and U-87 MG (Lane 9). The blot was probed with Anti-Phospho-AKT1 (Ser473) Monoclonal Antibody (Product # OMA1-03061, 1:500 dilution) and detected by chemiluminescence using Goat anti-Rabbit IgG (H+L) Superclonal™ Secondary Antibody, HRP conjugate (Product # A27036, 0.25 µg/mL, 1:4000 dilution). A 56 kDa band corresponding to Phospho-AKT1 (Ser473) was enhanced upon growth factor treatment across the cell lines tested and reduced upon drug treatment.
- Submitted by
- Invitrogen Antibodies (provider)
- Main image

- Experimental details
- Western blot analysis was performed on whole cell extracts (30 µg lysate) of A-431 (Lane 1), A-431 treated with EGF (200 ng/mL for 10 min) (Lane 2), A-431 treated with MK-2206 (5 uM for 5 h) followed by EGF treatment (200 ng/mL for 10 min) (Lane 3), NIH/3T3 (Lane 4), NIH/3T3 treated with PDGF (20 ng/mL for 30 min) (Lane 5), NIH/3T3 treated with MK-2206 (5uM for 5 h) followed by PDGF (20 ng/mL for 30 min) (Lane 6), PC-3 (Lane 7), PC-3 treated with Wortmannin (2 uM for 1 h) (Lane 8) and U-87 MG (Lane 9). The blot was probed with Anti-Phospho-AKT1 (Ser473) Monoclonal Antibody (Product # OMA1-03061, 1:500 dilution) and detected by chemiluminescence using Goat anti-Rabbit IgG (H+L) Superclonal™ Secondary Antibody, HRP conjugate (Product # A27036, 0.25 µg/mL, 1:4000 dilution). A 56 kDa band corresponding to Phospho-AKT1 (Ser473) was enhanced upon growth factor treatment across the cell lines tested and reduced upon drug treatment.

- Submitted by
- Invitrogen Antibodies (provider)
- Main image
- Experimental details
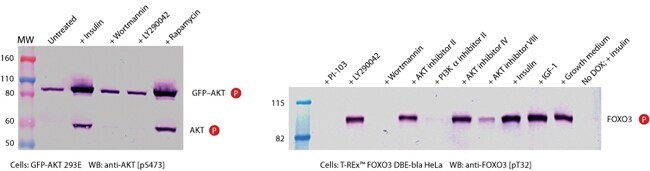
- Western blot analysis of LanthaScreen™ and CellSensor® cell lines using a phospho-AKT pSer473 monoclonal antibody (Product # OMA1-03061). (A) LanthaScreen™ GFP-AKT HEK293E cells were treated under the indicated conditions, including IGF-1 (Product # PHG9071), LY294002 (Product # PHZ1144), and wortmannin (Product # PHZ1301). Cell extracts were resolved by SDS-PAGE and transferred to nitrocellulose with the iBlot® Gel Transfer Device (Product # IB1001). The membrane was then probed with the anti-AKT (PS473) PSSA (Product # OMA1-03061), and the signal was detected using a WesternBreeze® Chromogenic Kit (Product # WB7105). (B) CellSensor® T REx™ FOXO3 DBE-bla HeLa cell lysates were generated by treatment with doxycycline to induce FOXO3 expression, followed by incubation with the indicated stimulants or inhibitors and lysis. The nitrocellulose membrane was prepared and developed as in (A), except that the PSSA used in this case was anti-FOXO3 (PT32) (Product # 44-1240G).
Supportive validation
- Submitted by
- Invitrogen Antibodies (provider)
- Main image

- Experimental details
- Immunofluorescence analysis of Phospho-AKT pSer473 in serum-starved NIH-3T3 cells left untreated (left) or treated with PDGF (right) using a Phospho-AKT pSer473 monoclonal antibody (Product # OMA1-03061).

- Submitted by
- Invitrogen Antibodies (provider)
- Main image

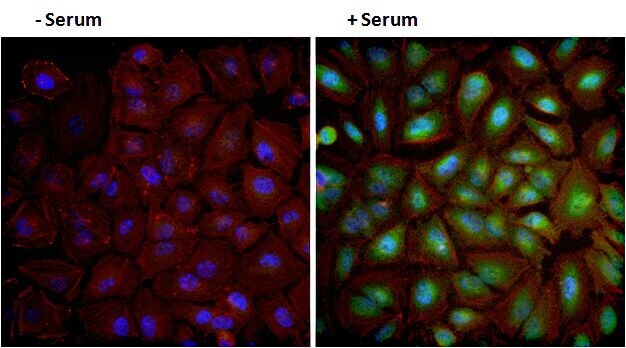
- Experimental details
- Immunofluorescent analysis of phospho-AKT pSer473 (green) in HeLa cells either serum starved overnight (left panel) or treated with 10% FBS (right panel) for 30 minutes. Formalin fixed cells were permeabilized with 0.1% Triton X-100 in TBS for 10 minutes at room temperature and blocked with 1% Blocker BSA (Product # 37525) for 15 minutes at room temperature. Cells were probed with a phospho-AKT pSer473 monoclonal antibody (Product # OMA1-03061) at a dilution of 1:100 for at least 1 hour at room temperature, washed with PBS, and incubated with DyLight 488 goat anti-rabbit IgG secondary antibody (Product # 35552) at a dilution of 1:400 for 30 minutes at room temperature. F-Actin (red) was stained with DyLight-554 Phalloidin (Product # 21834) and nuclei (blue) were stained with Hoechst 33342 dye (Product # 62249). Images were taken on a Thermo Scientific ArrayScan at 20X magnification.
Supportive validation
- Submitted by
- Invitrogen Antibodies (provider)
- Main image

- Experimental details
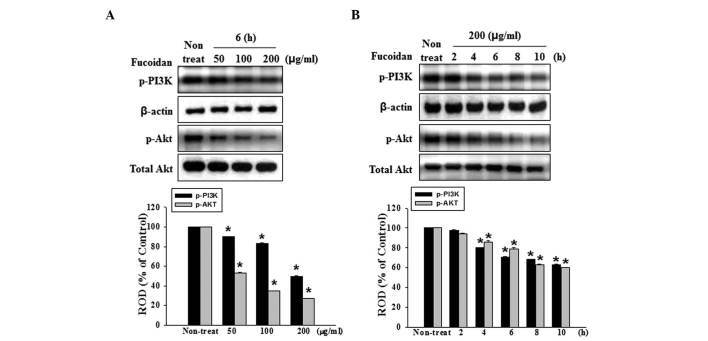
- Figure 3 Dose- and time-dependent effects of fucoidan on PI3K and Akt in HT-29 cells. (A) HT-29 cells were incubated for 6 h with various concentrations of fucoidan (0-200 mu g/ml) and the phosphorylation of PI3K and Akt was detected by western blotting. (B) HT-29 cells were treated with fucoidan (200 mu g/ml) for 0, 2, 4, 6, 8 and 10 h and the phosphorylation of PI3K and Akt was detected by western blotting. The protein expression levels were quantified and vallues are expressed as the mean +- standard error of the mean of five experiments, as determined by densitometry against beta-actin ( * P
- Submitted by
- Invitrogen Antibodies (provider)
- Main image

- Experimental details
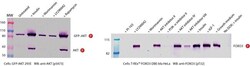
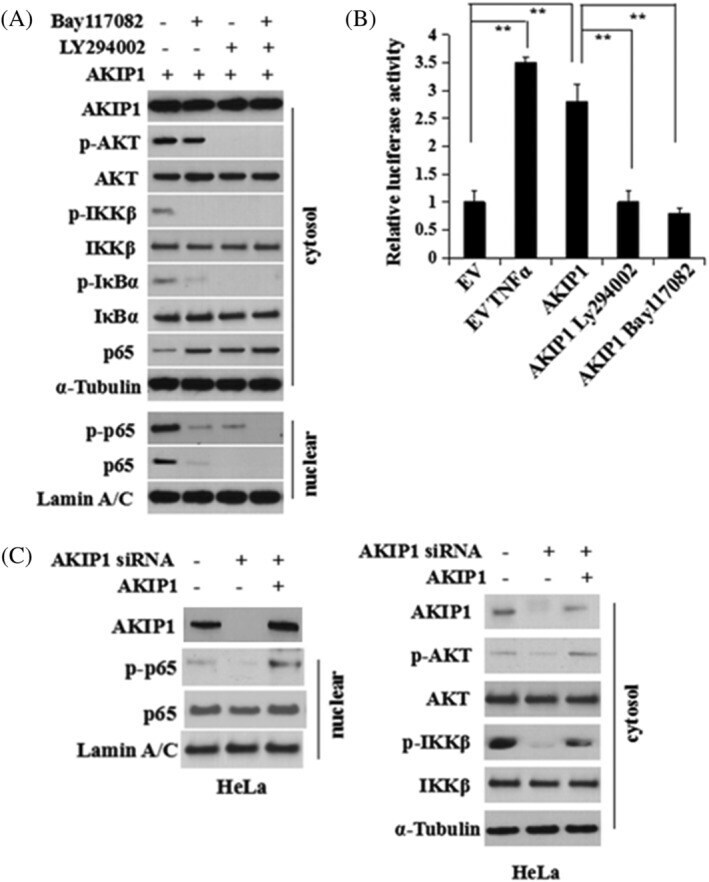
- FIGURE 5 AKIP1 mediates NF-kappaB regulation via the Akt/IKKbeta pathway during the EMT. A, Serum-starved HeLa cells were pretreated with PI3K inhibitor Ly294002 (40 muM) or IKK inhibitor Bay117082 (15 muM) for 4 hours, followed by stimulation with AKIP1 protein (80 ng/mL) for 4 hours. Cell lysates were harvested and the levels of indicated proteins were measured using western blot analysis. B, pGL4.32 (luc2NF-kappaB-RE/Hygro) vector and pRL4-TK Renilla luciferase constructs were used for co-transfection of HeLa cells. The cells were further transfected 24 hours later with empty vector (EV) or AKIP1 expression plasmid. Some of the AKIP1-transfected cells were pretreated with Ly294002 (40 muM) or Bay117082 (15 muM) for 4 hours. The dual luciferase reporter assay was performed 24 hours following transfection of AKIP1. EV-transfected cells treated with TNFalpha (40 ng/mL) for 1 hour after transfection were used as the positive control. ** indicates P < .01. C, The HeLa cells were transfected with AKIP1 siRNA to knock down AKIP1. After 72 hours transfection, AKIP1 protein (80 ng/mL) was used to stimulate HeLa cells for 4 hours and the cell lysates were analysed using western blot
- Submitted by
- Invitrogen Antibodies (provider)
- Main image
- Experimental details
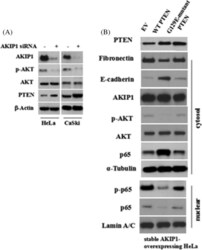
- FIGURE 6 AKIP1 Suppresses PTEN during the EMT. A, HeLa and CaSki cervical cancer cells were transfected with a control siRNA (siNC) or AKIP1 siRNA. The cell lysates were collected and the protein expression of PTEN, AKIP1, p-Akt, total Akt, and beta-Actin was detected using western blot. B, Stable AKIP1-expressing cells were transfected with EV, wild-type PTEN, or G129E-mutant PTEN plasmids. At 48 hours after transfection, cell lysates were harvested after cell fractionation. Levels of indicated proteins were determined using western blot analysis

- Submitted by
- Invitrogen Antibodies (provider)
- Main image

- Experimental details
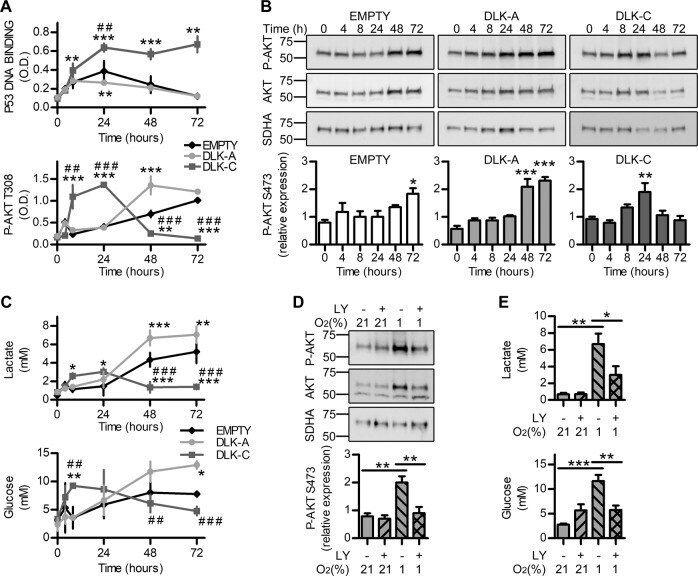
- Fig. 6 Temporal modulation of Akt and p53 balance by DLK1 cleavage regulates cell metabolism at hypoxia. a ELISA time course experiments showing p53 DNA-binding activity and Akt T308 phosphorylation variations in U3084S stable cell lines grown in 1% O 2 for up to 72 h. b Western blot time course experiments showing variations in Akt S473 phosphorylation and total Akt levels in 3084 stable cell lines grown in 1% O 2 for up to 72 h. SDHA was used as loading control. c Colorimetric assay time course experiment showing different modulation of glucose consumption and lactate production in 3084 S stable cell lines grown in 1% O 2 for up to 72 h. d Representative images and densitometric analysis of western blots showing phosphorylated and total AKT levels in U3084S stable cell lines pre-treated for 24 h with 10 uM PI3K inhibitor LY294002 and then grown in 21% or 1% O 2 for 48 h. SDHA was used as loading control. e Colorimetric assay experiment showing glucose consumption and lactate production variations in U3084S stable cell lines pre-treated for 24 h with 10 uM PI3K inhibitor LY294002 and then grown in 21% or 1% O 2 for 48 h. Statistical analysis: all data are from four independent experiments, with the exception of point c with n = 3, and expressed as mean +- SEM. Statistical significance was determined by two-way ANOVA ( a , c ) and one-way ANOVA ( b , d , e ), followed by Bonferroni post hoc test. In the whole figure significance is represented as * p < 0.05, ** p < 0.01, and
- Submitted by
- Invitrogen Antibodies (provider)
- Main image
- Experimental details
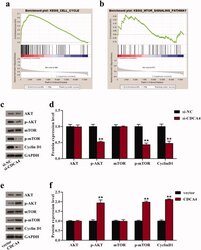
- Figure 4. CDCA4 affected cell cycle and AKT/mTOR signaling pathway. (a-b) GSEA was utilized to identify the relative signaling pathway associated with high CDCA4 expression. (c-f) The effects of CDCA4-knockdown (c-d) and -overexpression (e-f) on the AKT/mTOR relative markers and Cyclin D1 protein were evaluated using western blot analysis. (d) Quantification of c. (f) Quantification of e. ** p < 0.01 vs . si-NC or vector group.

- Submitted by
- Invitrogen Antibodies (provider)
- Main image
- Experimental details
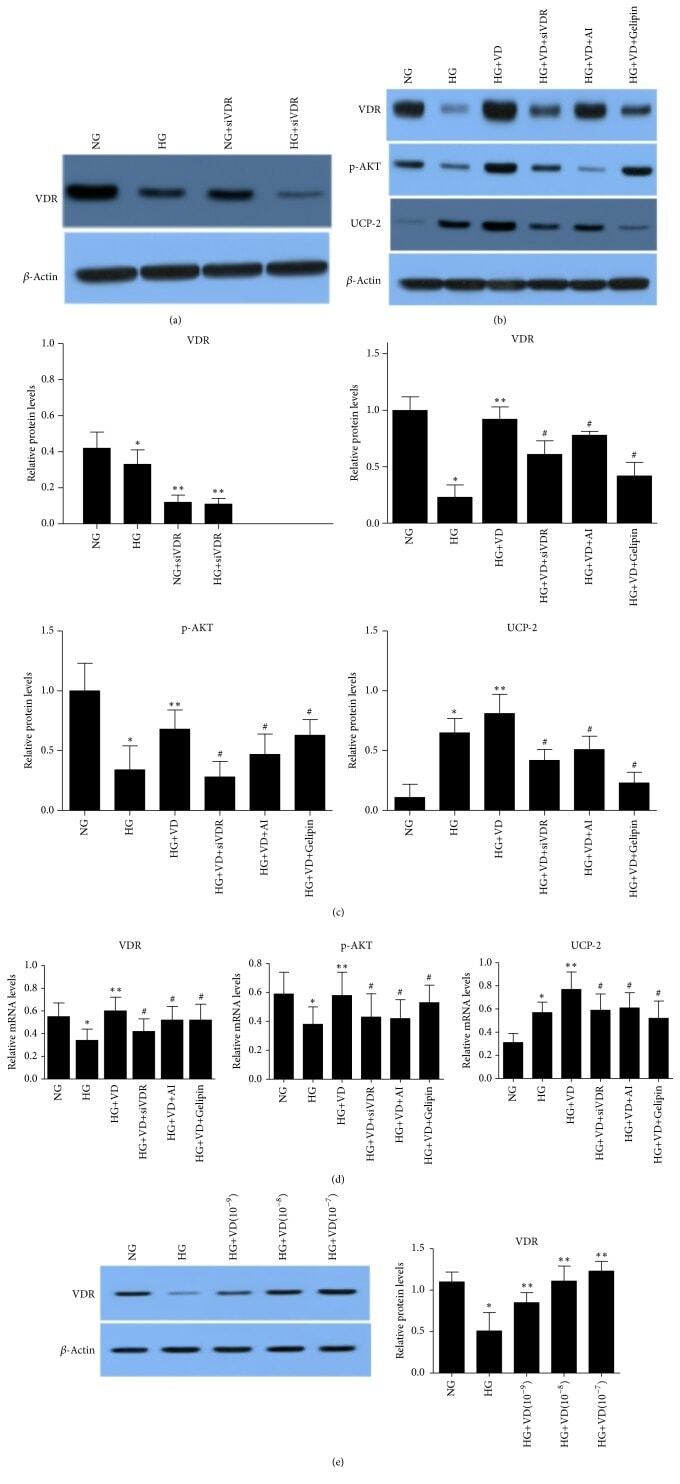
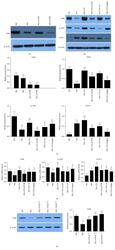
- Figure 3 Protein and mRNA levels of HK2 cells analyzed by western blot and RT-PCR. (a), (b), and (c) show the protein levels of VDR, p-AKT, and UCP2 evaluated by western blot. (d) mRNA levels of VDR, AKT, and UCP2 measured by RT-PCR. Results are presented as the fold change in activity relative to normoxic cells. The data are expressed as the mean +- SD. *p