 Explore
 Validate
 Learn
LearnPA5-47035
antibody from Invitrogen Antibodies
Targeting: CXCL13
ANGIE, ANGIE2, BCA-1, BLC, BLR1L, SCYB13
 Western blot
 Immunohistochemistry
 Blocking/Neutralizing
Antibody data
- Antibody Data
- Antigen structure
- References [3]
- Comments [0]
- Validations
- Immunohistochemistry [1]
- Other assay [8]
Submit
Validation data
Reference
Comment
Report error
- Product number
- PA5-47035 - Provider product page

- Provider
- Invitrogen Antibodies
- Product name
- CXCL13 Polyclonal Antibody
- Antibody type
- Polyclonal
- Antigen
- Recombinant full-length protein
- Description
- Reconstitute at 0.2 mg/mL in sterile PBS. Endoxin level is
- Reactivity
- Human
- Host
- Goat
- Isotype
- IgG
- Vial size
- 100 μg
- Concentration
- 0.2 mg/mL
- Storage
- -20°C, Avoid Freeze/Thaw Cycles
Submitted references Single-Cell RNA Sequencing Identifies New Inflammation-Promoting Cell Subsets in Asian Patients With Chronic Periodontitis.
Dysregulation of T(FH)-B-T(RM) lymphocyte cooperation is associated with unfavorable anti-PD-1 responses in EGFR-mutant lung cancer.
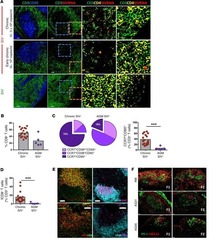
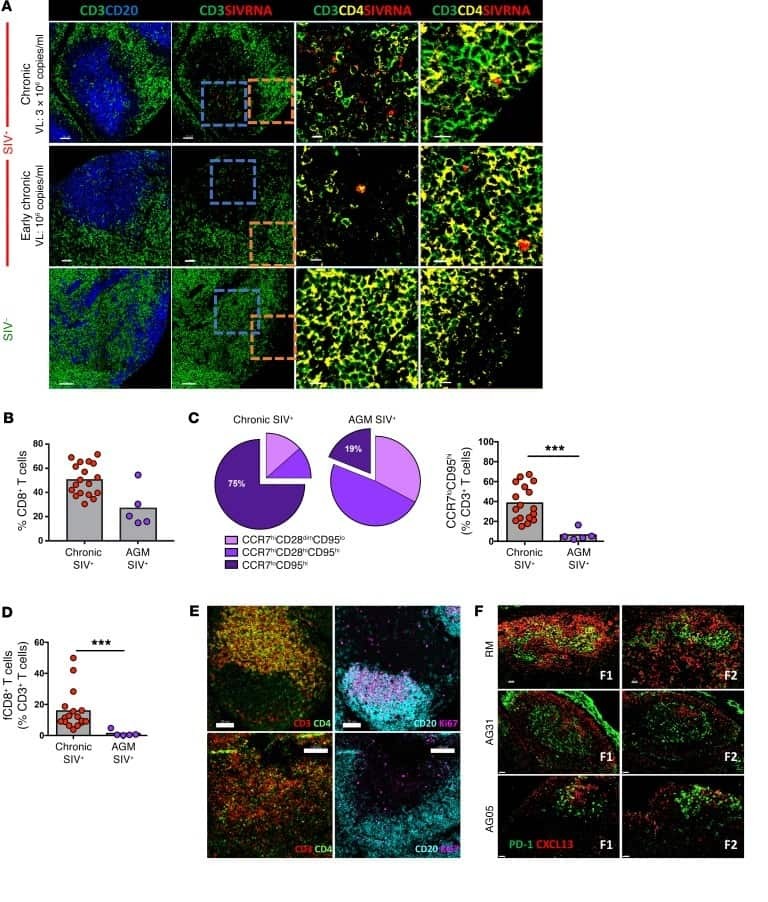
Accumulation of follicular CD8+ T cells in pathogenic SIV infection.
Qian SJ, Huang QR, Chen RY, Mo JJ, Zhou LY, Zhao Y, Li B, Lai HC
Frontiers in immunology 2021;12:711337
Frontiers in immunology 2021;12:711337
Dysregulation of T(FH)-B-T(RM) lymphocyte cooperation is associated with unfavorable anti-PD-1 responses in EGFR-mutant lung cancer.
Cho JW, Park S, Kim G, Han H, Shim HS, Shin S, Bae YS, Park SY, Ha SJ, Lee I, Kim HR
Nature communications 2021 Oct 18;12(1):6068
Nature communications 2021 Oct 18;12(1):6068
Accumulation of follicular CD8+ T cells in pathogenic SIV infection.
Ferrando-Martinez S, Moysi E, Pegu A, Andrews S, Nganou Makamdop K, Ambrozak D, McDermott AB, Palesch D, Paiardini M, Pavlakis GN, Brenchley JM, Douek D, Mascola JR, Petrovas C, Koup RA
The Journal of clinical investigation 2018 May 1;128(5):2089-2103
The Journal of clinical investigation 2018 May 1;128(5):2089-2103
No comments: Submit comment
Supportive validation
- Submitted by
- Invitrogen Antibodies (provider)
- Main image

- Experimental details
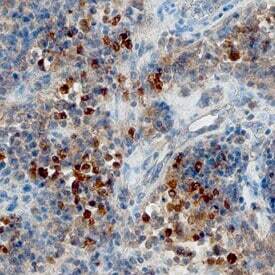
- Immunohistochemical analysis of CXCL13 in immersion fixed paraffin-embedded sections of human lymphoma. Samples were incubated in CXCL13 polyclonal antibody (Product # PA5-47035) using a dilution of 10 µg/mL overnight at 4 °C. Before incubation with the primary antibody, tissue was subjected to heat-induced epitope retrieval using Antigen Retrieval Reagent-Basic. Tissue was stained using the Anti-Goat HRP-DAB Cell & Tissue Staining Kit (brown) and counterstained with hematoxylin (blue). Specific staining was localized to cytoplasm.
Supportive validation
- Submitted by
- Invitrogen Antibodies (provider)
- Main image
- Experimental details
- NULL
- Submitted by
- Invitrogen Antibodies (provider)
- Main image
- Experimental details
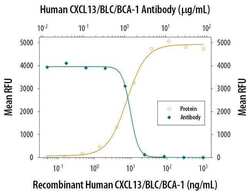
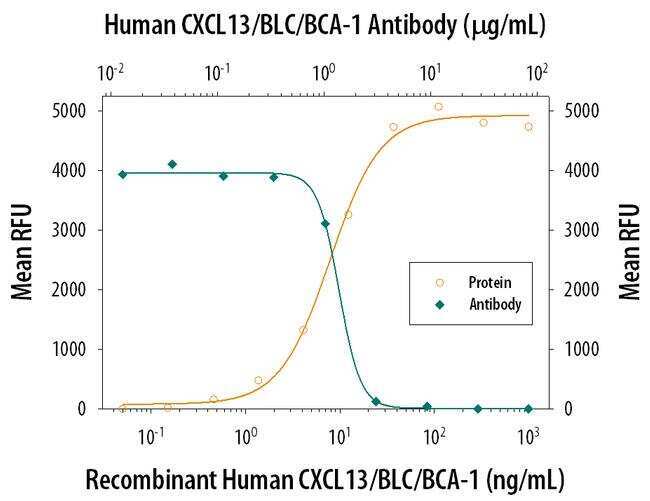
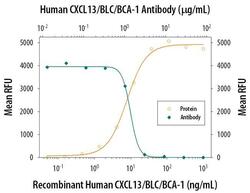
- Neutralization antibody testing demonstrates the specificity of an antibody through a correlation between antibody binding and the activity of the target. Neutralization of CXCL13 is shown by the decrease in mean RFU (relative fluorescence units –chemotaxis measured by Resazurin) with increasing concentrations of CXCL13 polyclonal antibody (Product # PA5-47035).
- Submitted by
- Invitrogen Antibodies (provider)
- Main image
- Experimental details
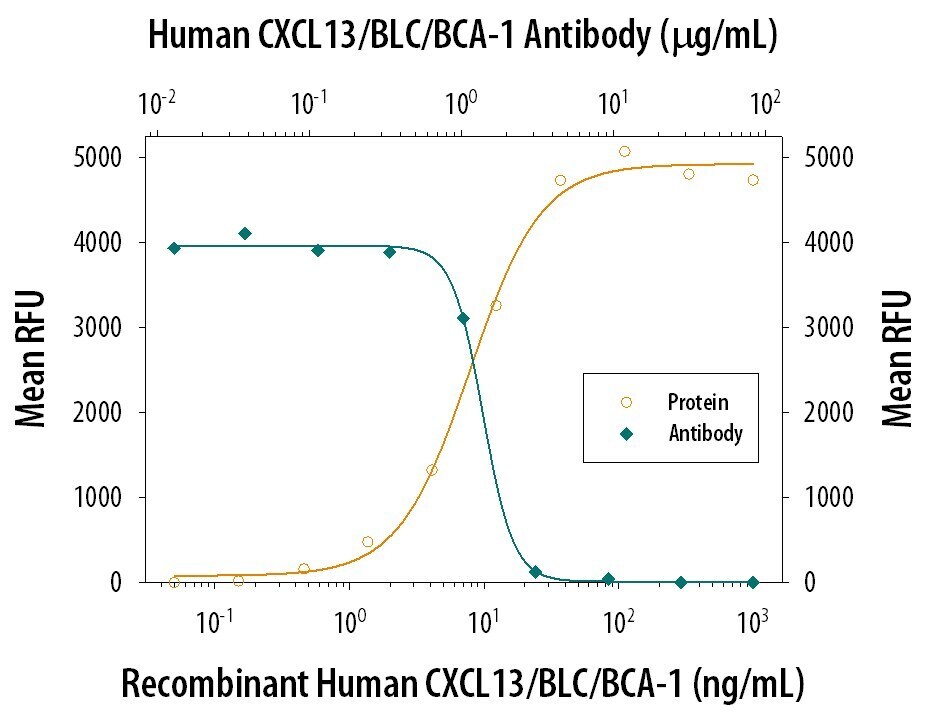
- Neutralization of CXCL13 in BaF3 mouse pro‚B cell line transfected with human CXCR5. Samples were incubated in CXCL13 polyclonal antibody (Product # PA5-47035). Recombinant Human CXCL13/BLC/BCA‚1 chemoattracts the BaF3 mouse pro‚B cell line transfected with human CXCR5 in a dose-dependent manner (orange line). The amount of cells that migrated through to the lower chemotaxis chamber was measured by Resazurin. Chemotaxis elicited by Recombinant Human CXCL13/BLC/BCA‚1 (50 ng/mL) is neutralized (green line) by increasing concentrations of Goat Anti-Human CXCL13/BLC/BCA‚1 Antigen Affinity-purified Polyclonal Antibody. The ND50 is typically 1‚4 µg/mL.

- Submitted by
- Invitrogen Antibodies (provider)
- Main image
- Experimental details
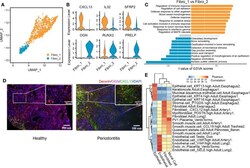
- Figure 5 CXCL13 + fibroblast subcluster associated with immune response. (A) UMAP visualization of two fibroblast subclusters in the combined health ( n = 2; 244 cells) and periodontitis ( n = 2; 1,260 cells) dataset. (B) Violin plots showing the expression distribution of selected genes associated with functions in the fibroblast clusters. The gene expression levels are normalized and transformed as ln (CPM/10). (C) Differences in pathway activities scored per cell by GSVA between fibro_1 and fibro_2. Shown are t values from a linear model, corrected for fibro_1. (D) Immunofluorescent (IF) staining validation of fibroblast subtypes. Red shows the signal of decorin staining (fibroblast marker); green shows the signal of CXCL13 staining; purple shows the signal of osteoglycin (OGN), and blue shows DAPI staining. Scale bar: 100 mum for main images and 50 mum for detail images. (E) Application of scHCL analysis for nonimmune cells. Each row represents one cell type in scHCL. Each column represents a cell cluster in our dataset. Pearson's correlation coefficient was used to evaluate cell-type gene expression similarity. Red indicates a high correlation; blue indicates a low correlation.

- Submitted by
- Invitrogen Antibodies (provider)
- Main image
- Experimental details
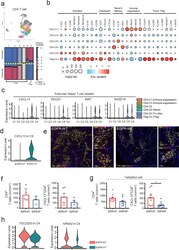
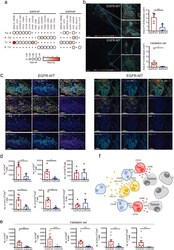
- Fig. 3 Characterization of subsets for CD4+ T cells based on marker gene expression and multiplexed immunofluorescence (IF) analysis. a UMAP and mosaic plot for CD4 + T cells. The p -value shown in the mosaic plot was obtained from a one-sided chi-square test. b Dot plots for the expression of marker genes for various functional properties of CD4 + T cells. Subset-DEGs are represented as a red circle with statistical significance indicated by the dot size. c Violin plots for the expression of genes related to follicular helper T cells across subsets. d Violin plots for the expression of CXCL13 genes in C9 cells of EGFR-WT and EGFR-MT. e Representative multiplexed IF (scale bar 100 mum: left, scale bars 50 mum: right magnified) of CD4 and CXCL13 in tumor specimens from EGFR-WT ( n = 14) and EGFR-MT ( n = 14) patients. Asterisks mark the double-positive CD4 + CXCL13 + cells. f The cell counts of CD4 + , CXCL13 + CD4 + T cells per mm 2 of EGFR-WT ( n = 5) and EGFR-MT ( n = 4) tumors were depicted in the bar graph. g The cell counts of CD4 + , CXCL13 + CD4 + T cells per mm 2 of tumors from independent patients with EGFR-WT ( n = 9) and EGFR-MT ( n = 10) for validation were depicted in the bar graph (* p

- Submitted by
- Invitrogen Antibodies (provider)
- Main image
- Experimental details
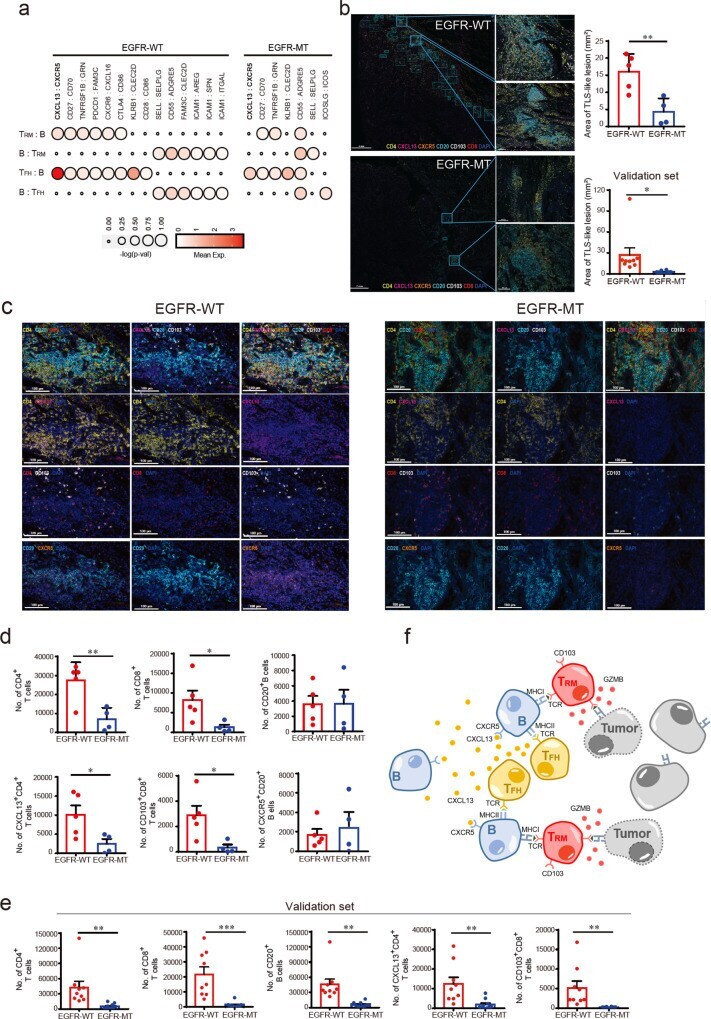
- Fig. 6 T FH -B-T RM lymphocyte cooperation and their co-localization in lung tumors. a The dot plot summarizing the cell-cell interactions among CD8-C2 (T RM -like), B, and CD4-C9 (T FH -like) cells by CellPhoneDB analysis. Only significant ligand-receptor interactions are presented here. The size of the circle indicates the statistical significance, and the color gradient indicates the mean expression value of gene pairs. b Representative multiplexed immunofluorescence (IF) of TLS-like lesion in EGFR-WT ( n = 14) (upper) (scale bar 100 mum: left, scale bars 50 mum: right magnified) and EGFR-MT ( n = 14) (lower) (scale bar 100 mum: left, scale bars 50 mum: right magnified) tumors. Summarized graph for the area of TLS-like lesions in EGFR-WT ( n = 5) and EGFR-MT ( n = 4) tumors for single-cell analysis (** p
- Submitted by
- Invitrogen Antibodies (provider)
- Main image

- Experimental details
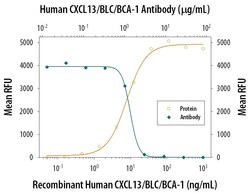
- Neutralization of CXCL13 in BaF3 mouse pro‚B cell line transfected with human CXCR5. Samples were incubated in CXCL13 polyclonal antibody (Product # PA5-47035). Recombinant Human CXCL13/BLC/BCA‚1 chemoattracts the BaF3 mouse pro‚B cell line transfected with human CXCR5 in a dose-dependent manner (orange line). The amount of cells that migrated through to the lower chemotaxis chamber was measured by Resazurin. Chemotaxis elicited by Recombinant Human CXCL13/BLC/BCA‚1 (50 ng/mL) is neutralized (green line) by increasing concentrations of Goat Anti-Human CXCL13/BLC/BCA‚1 Antigen Affinity-purified Polyclonal Antibody. The ND50 is typically 1‚4 µg/mL.
- Submitted by
- Invitrogen Antibodies (provider)
- Main image
- Experimental details
- Neutralization antibody testing demonstrates the specificity of an antibody through a correlation between antibody binding and the activity of the target. Neutralization of CXCL13 is shown by the decrease in mean RFU (relative fluorescence units –chemotaxis measured by Resazurin) with increasing concentrations of CXCL13 polyclonal antibody (Product # PA5-47035).
