Explore
 Validate
 Learn
Learn Western blot
 Immunocytochemistry
 Immunoprecipitation
Antibody data
- Antibody Data
- Antigen structure
- References [1]
- Comments [0]
- Validations
- Immunocytochemistry [2]
- Immunohistochemistry [1]
- Other assay [2]
Submit
Validation data
Reference
Comment
Report error
- Product number
- PA5-22369 - Provider product page

- Provider
- Invitrogen Antibodies
- Product name
- Ataxin 3 Polyclonal Antibody
- Antibody type
- Polyclonal
- Antigen
- Recombinant full-length protein
- Description
- Recommended positive controls: SK-N-SH, SK-N-AS, mouse brain, human Ataxin3-transfected 293T. Predicted reactivity: Mouse (96%), Rat (96%), Zebrafish (85%), Pig (99%), Chicken (89%), Sheep (98%), Bovine (98%). Store product as a concentrated solution. Centrifuge briefly prior to opening the vial.
- Reactivity
- Human, Mouse
- Host
- Rabbit
- Isotype
- IgG
- Vial size
- 100 μL
- Concentration
- 0.36 mg/mL
- Storage
- Store at 4°C short term. For long term storage, store at -20°C, avoiding freeze/thaw cycles.
Submitted references Aldosterone and angiotensin II induce protein aggregation in renal proximal tubules.
Cheema MU, Poulsen ET, Enghild JJ, Hoorn EJ, Fenton RA, Praetorius J
Physiological reports 2013 Sep;1(4):e00064
Physiological reports 2013 Sep;1(4):e00064
No comments: Submit comment
Supportive validation
- Submitted by
- Invitrogen Antibodies (provider)
- Main image
- Experimental details
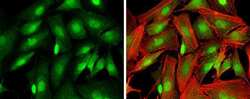
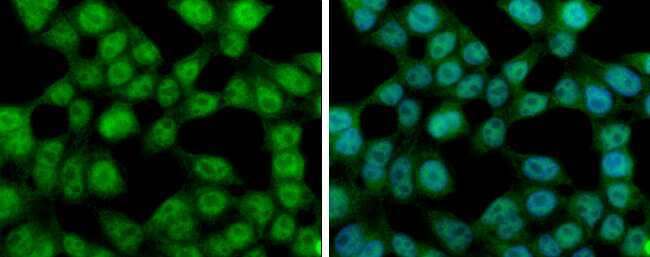
- Immunocytochemistry-Immunofluorescence analysis of Ataxin 3 was performed in SK N SH cells fixed in 4% paraformaldehyde at RT for 15 min. Green: Ataxin 3 Polyclonal Antibody (Product # PA5 22369) diluted at 1:250. Blue: Hoechst 33342 staining.
- Submitted by
- Invitrogen Antibodies (provider)
- Main image
- Experimental details
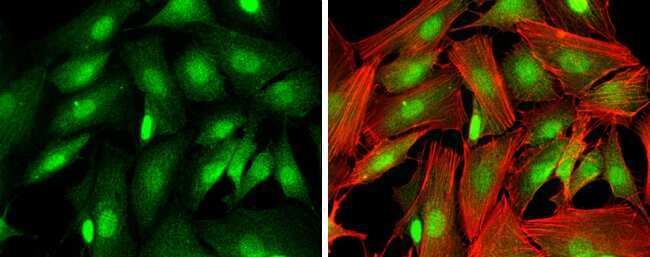
- Immunocytochemistry-Immunofluorescence analysis of Ataxin 3 was performed in 293T cells fixed in 4% paraformaldehyde at RT for 15 min. Green: Ataxin 3 Polyclonal Antibody (Product # PA5 22369) diluted at 1:500. Blue: Hoechst 33342 staining.
Supportive validation
- Submitted by
- Invitrogen Antibodies (provider)
- Main image
- Experimental details
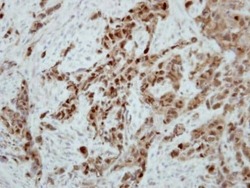
- Immunohistochemical analysis of paraffin-embedded H661 xenograft, using Ataxin 3 (Product # PA5-22369) antibody at 1:500 dilution. Antigen Retrieval: EDTA based buffer, pH 8.0, 15 min.

Supportive validation
- Submitted by
- Invitrogen Antibodies (provider)
- Main image
- Experimental details
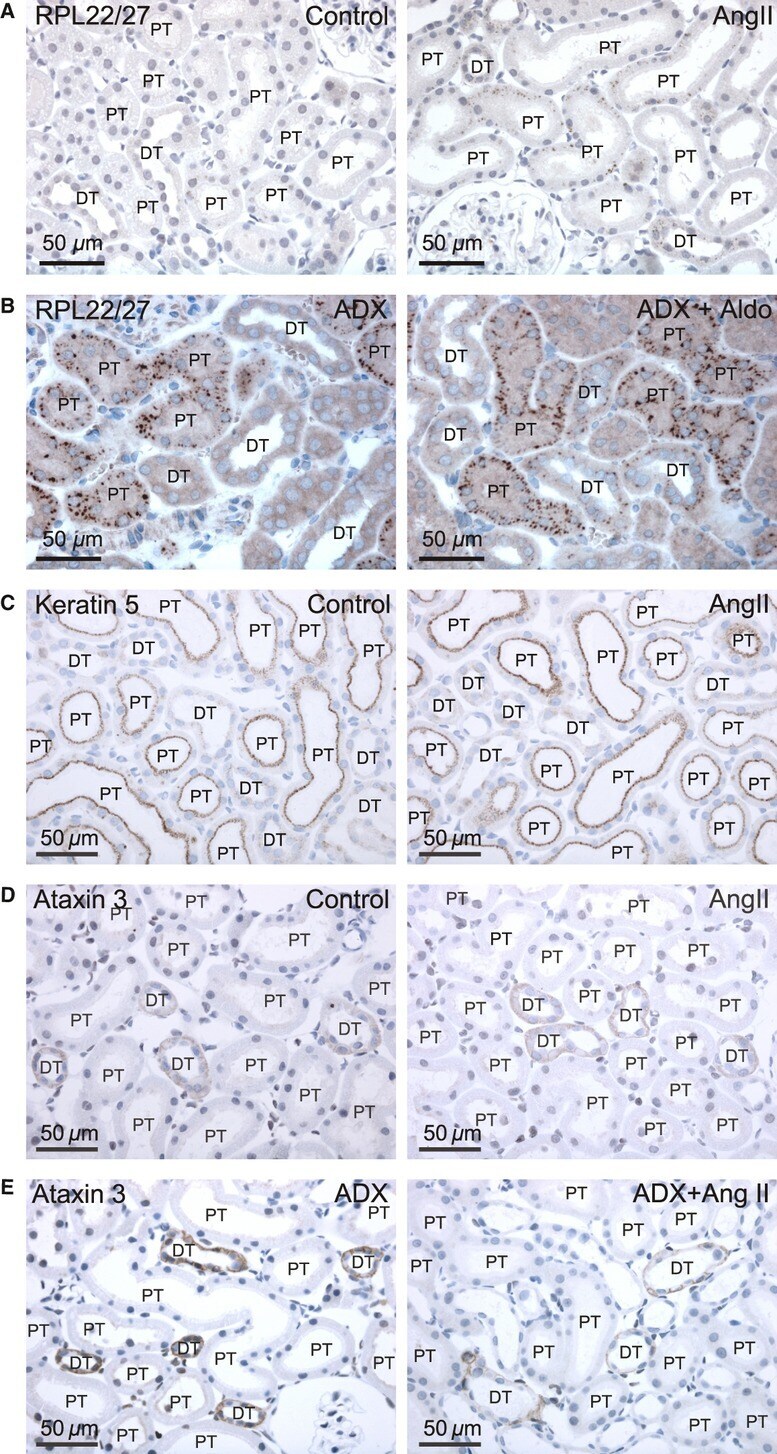
- Figure 6 Protein aggregation in renal proximal tubules after angiotensin II treatment. Angiotensin was administered to rats to increase cellular protein turnover in proximal tubules, and aggregation-prone protein content was analyzed by immunohistochemistry. Angiotensin II was elevated by either infusion from subcutaneous minipumps or by adrenalectomy with glucocorticoid substitution. (A) Representative example of the RPL22/27 immunostaining in the kidney cortex from a control and angiotensin II (AngII)-treated rats, as indicated. PT denotes proximal tubules, while DT marks distal tubules and connecting tubules. (B) Similar RPL22/27 staining in sections from dexamethasone-treated adrenalectomized rats (ADX) and from similar rats with aldosterone and dexamethasone coadministration (ADX+Aldo). (C) Micrographs comparing keratin 5 immunoreactivity in renal cortex from control and angiotensin II-treated rats. (D) Immunolabeling for ataxin-3 in the angiotensin II versus vehicle administration model, as indicated. (E) Similar staining in model of dexamethasone-corrected adrenalectomy with and without angiotensin II administration (ADX+AngII), as indicated.
- Submitted by
- Invitrogen Antibodies (provider)
- Main image
- Experimental details
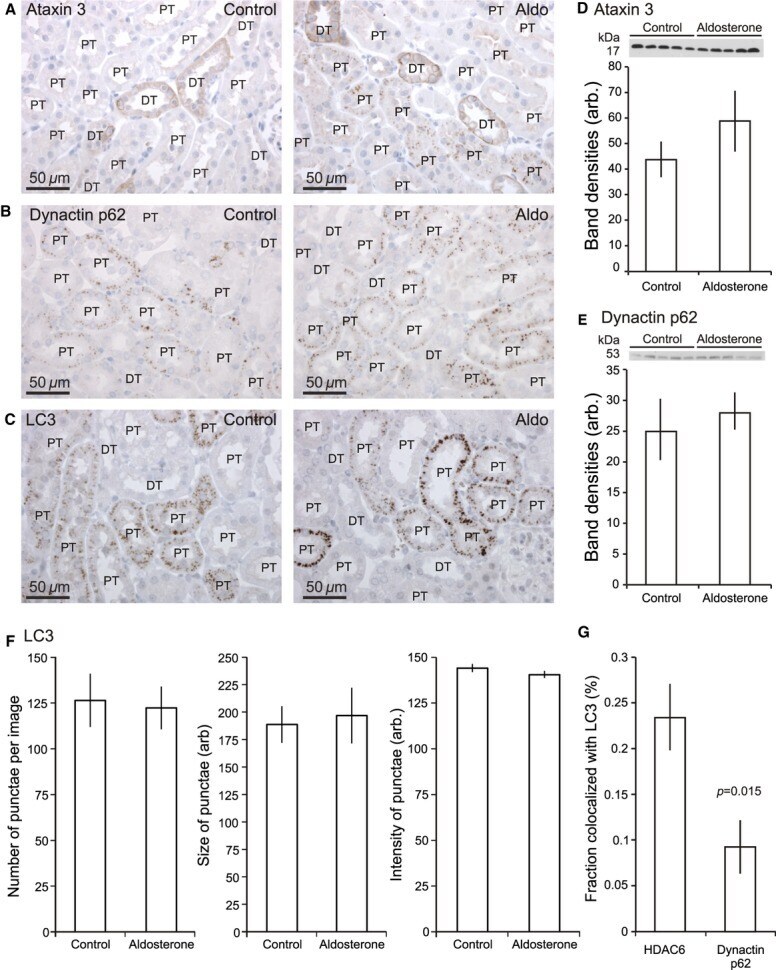
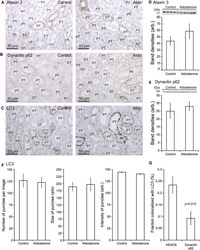
- Figure 5 Effect of aldosterone on expression of proteins involved in aggregate handling. For transfer of aggregated proteins to aggresomes, a partial deubiquitination by ataxin-3 must first occur. (A) Ataxin-3 immunoreactivity in control and aldosterone (Aldo)-treated rat kidney sections. Proximal tubules (PT); distal tubules and connecting tubules (DT). (B) Micrographs comparing dynactin p62 labeling in renal cortex from control and aldosterone-treated rats. (C) LC3 immunoreactivity in proximal tubules in control and aldosterone-treated rat kidney sections. (D) Bar graph showing the densitometry of the 17 kDa ataxin-3 band from the inserted immunoblot ( P > 0.05, n = 5). (E) Bar graph shows the semi-quantitation of immunoblot analysis of the 53 kDa dynactin p62 band (insert). (F) The bar graphs show the quantitation of the number, the mean area, and the fluorescence intensity of the renal cortical LC3 staining in the two experimental groups. (G) Quantitative analysis of the proximal tubular colocalization of LC3 with dynactin p62 and HDAC6, respectively, in aldosterone-treated rats.