 Explore
 Validate
 Learn
LearnPA5-55143
antibody from Invitrogen Antibodies
Targeting: SNTB1
59-DAP, A1B, BSYN2, SNT2, SNT2B1, TIP-43
 Immunohistochemistry
Antibody data
- Antibody Data
- Antigen structure
- References [1]
- Comments [0]
- Validations
- Immunohistochemistry [1]
- Other assay [2]
Submit
Validation data
Reference
Comment
Report error
- Product number
- PA5-55143 - Provider product page

- Provider
- Invitrogen Antibodies
- Product name
- SNTB1 Polyclonal Antibody
- Antibody type
- Polyclonal
- Antigen
- Recombinant protein fragment
- Description
- Immunogen sequence: QGCHNSAELI AEISTACTYK NQECRLTIHY ENGFSITTEP QEGAFPKTII QSPYEKLKMS SDDG Highest antigen sequence identity to the following orthologs: Mouse - 91%, Rat - 91%.
- Reactivity
- Human
- Host
- Rabbit
- Isotype
- IgG
- Vial size
- 100 μL
- Concentration
- 0.1 mg/mL
- Storage
- Store at 4°C short term. For long term storage, store at -20°C, avoiding freeze/thaw cycles.
Submitted references Upregulation of SNTB1 correlates with poor prognosis and promotes cell growth by negative regulating PKN2 in colorectal cancer.
Liu L, Chen Y, Lin X, Wu M, Li J, Xie Q, Sferra TJ, Han Y, Liu H, Cao L, Yao M, Peng J, Shen A
Cancer cell international 2021 Oct 18;21(1):547
Cancer cell international 2021 Oct 18;21(1):547
No comments: Submit comment
Supportive validation
- Submitted by
- Invitrogen Antibodies (provider)
- Main image
- Experimental details
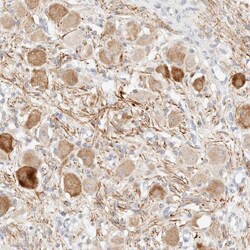
- Immunohistochemical staining of SNTB1 in human soft tissue using a SNTB1 Polyclonal Antibody (Product # PA5-55143) shows cytoplasmic positivity in peripheral neurons.

Supportive validation
- Submitted by
- Invitrogen Antibodies (provider)
- Main image
- Experimental details
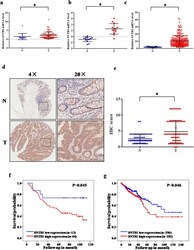
- Fig. 2 Levels of SNTB1 mRNA and protein in colorectal cancer tissues. a SNTB1 mRNA expression in CRC tissues (T: n=79) and non-cancerous colorectal tissues (N: n=15) on the CRC cDNA chip was analyzed by qPCR. GAPDH was used as an internal control. * P < 0.05. b , c SNTB1 mRNA expression in CRC tissues (T) and non-cancerous colorectal tissues (N) from GEO ( b ) and TCGA ( c ) were analyzed. d , e SNTB1 protein expression in CRC tissues (T) and non-cancerous colorectal tissues (N) was determined by immunohistochemistry of a tissue microarray. Representative images were taken at magnification of 40x or 200x (right panel); the IHC score was calculated as intensity score x percentage score (left panel, see Methods). * P < 0.05. f , g Kaplan-Meier plots of survival of CRC patients, stratified by SNTB1 mRNA expression based on cDNA array ( f ) and TCGA database ( g ). Survival was analyzed with log-rank test

- Submitted by
- Invitrogen Antibodies (provider)
- Main image
- Experimental details
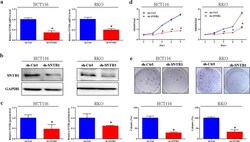
- Fig. 3 SNTB1 knockdown inhibits colorectal cancer (CRC) cell growth. HCT116 and RKO cells were transduced with lentivirus encoding either anti-SNTB1 small hairpin RNA (sh-SNTB1) or control shRNA (sh-Ctrl). a The mRNA levels of SNTB1 were determined by qPCR, GAPDH was used as an internal control. * P < 0.05. b , c The protein levels of SNTB1 were determined by Western-blot analysis. The representative images of SNTB1 and GAPDH are shown ( b ) and were quantitated using ImageLab software ( c ). GAPDH was used as an internal control and normalized to GAPDH. * P < 0.05. d The cell viability of CRC cells was determined by the CCK-8 assay. Data were normalized to the viability on Day 1 and are represented as fold change. * P < 0.05. e The colony formation assay was performed to determine cell survival. The images were obtained and the number of colonies formed were determined and normalized to the survival of control cells. * P < 0.05
