Explore
 Validate
 Learn
Learn Western blot
 Immunocytochemistry
Antibody data
- Antibody Data
- Antigen structure
- References [2]
- Comments [0]
- Validations
- Immunocytochemistry [2]
- Chromatin Immunoprecipitation [1]
Submit
Validation data
Reference
Comment
Report error
- Product number
- 701142 - Provider product page

- Provider
- Invitrogen Antibodies
- Product name
- PDGFRA Recombinant Rabbit Monoclonal Antibody (7H13L1)
- Antibody type
- Monoclonal
- Antigen
- Synthetic peptide
- Description
- Intact IgG appears on a non-reducing gel as ~150 kDa band and upon reduction generating a ~25 kDa light chain band and a ~50 kDa heavy chain. Recombinant rabbit monoclonal antibodies are produced using in vitro expression systems. The expression systems are developed by cloning in the specific antibody DNA sequences from immunoreactive rabbits. Then, individual clones are screened to select the best candidates for production. The advantages of using recombinant rabbit monoclonal antibodies include: better specificity and sensitivity, lot-to-lot consistency, animal origin-free formulations, and broader immunoreactivity to diverse targets due to larger rabbit immune repertoire.
- Reactivity
- Human
- Host
- Rabbit
- Isotype
- IgG
- Antibody clone number
- 7H13L1
- Vial size
- 100 μg
- Concentration
- 0.5 mg/mL
- Storage
- Store at 4°C short term. For long term storage, store at -20°C, avoiding freeze/thaw cycles.
Submitted references Rhythmic Calcium Events in the Lamina Propria Network of the Urinary Bladder of Rat Pups.
EGF as a New Therapeutic Target for Medulloblastoma Metastasis.
Heppner TJ, Hennig GW, Nelson MT, Vizzard MA
Frontiers in systems neuroscience 2017;11:87
Frontiers in systems neuroscience 2017;11:87
EGF as a New Therapeutic Target for Medulloblastoma Metastasis.
Rico-Varela J, Singh T, McCutcheon S, Vazquez M
Cellular and molecular bioengineering 2015 Dec;8(4):553-565
Cellular and molecular bioengineering 2015 Dec;8(4):553-565
No comments: Submit comment
Supportive validation
- Submitted by
- Invitrogen Antibodies (provider)
- Main image
- Experimental details
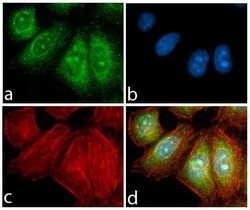
- Immunofluorescent analysis of PDGFR alpha in HeLa cells using a PDGFR alpha recombinant rabbit monoclonal antibody (Product # 701142) followed by detection using an Alexa Fluor 488-conjugated goat anti-rabbit secondary antibody (green) (Image A). Nuclei were stained using DAPI (Image B) and actin stained with Alexa Fluor 594 phalloidin (red) (image C). Image D is a composite image showing cytoplasmic and nuclear membrane localization of PDGFR-alpha.

- Submitted by
- Invitrogen Antibodies (provider)
- Main image

- Experimental details
- Immunofluorescent analysis of PDGFR alpha in HeLa cells using a PDGFR alpha recombinant rabbit monoclonal antibody (Product # 701142) followed by detection using an Alexa Fluor 488-conjugated goat anti-rabbit secondary antibody (green) (Image A). Nuclei were stained using DAPI (Image B) and actin stained with Alexa Fluor 594 phalloidin (red) (image C). Image D is a composite image showing cytoplasmic and nuclear membrane localization of PDGFR-alpha.

Supportive validation
- Submitted by
- Invitrogen Antibodies (provider)
- Main image
- Experimental details
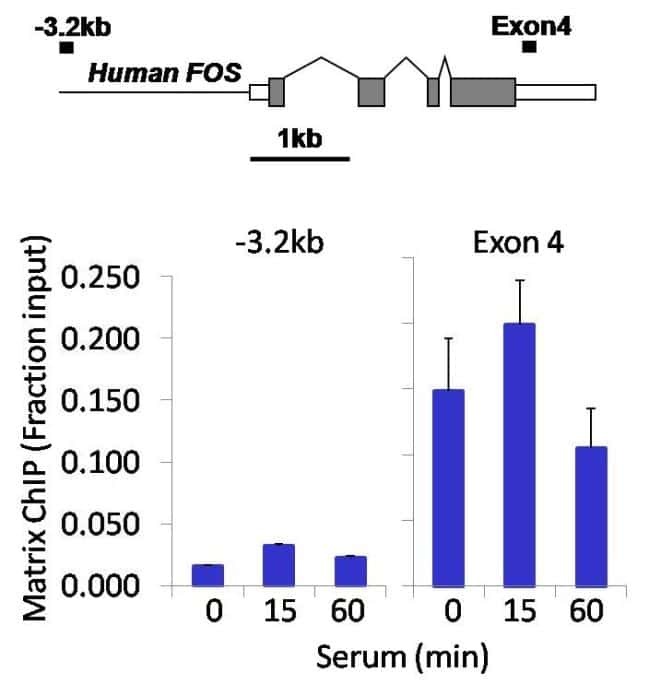
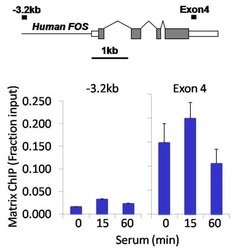
- Chromatin immunoprecipitation analysis of PDGF Receptor alpha was performed using cross-linked chromatin from 1 x 10^6 HCT116 human colon carcinoma cells treated with serum for 0, 15, and 60 minutes. Immunoprecipitation was performed using a multiplex microplate Matrix ChIP assay (see reference for Matrix ChIP protocol: http://www.ncbi.nlm.nih.gov/pubmed/22098709) with 1.0 µL/100 µL well volume of a PDGF Receptor alpha rabbit monoclonal antibody (Product # 701142). Chromatin aliquots from ~1 x 10^5 cells were used per ChIP pull-down. Quantitative PCR data were done in quadruplicate using 1 µL of eluted DNA in 2 µL SYBR real-time PCR reactions containing primers to amplify -3.2kb upstream of the human FOS gene, or exon-4 of human FOS. PCR calibration curves were generated for each primer pair from a dilution series of sheared total genomic DNA. Quantitation of immunoprecipitated chromatin is presented as signal relative to the total amount of input chromatin. Results represent the mean +/- SEM for three experiments. A schematic representation of the FOS locus is shown above the data where boxes represent exons (grey boxes = translated regions, white boxes = untranslated regions), the zigzag lines represent introns, and the straight line represents upstream sequence. Regions amplified by FOS primers are represented by black bars. Data courtesy of the Innovators Program.