Explore
 Validate
 Learn
Learn Western blot
 Flow cytometry
Antibody data
- Antibody Data
- Antigen structure
- References [43]
- Comments [0]
- Validations
- Flow cytometry [1]
- Other assay [28]
Submit
Validation data
Reference
Comment
Report error
- Product number
- PA1-822A - Provider product page

- Provider
- Invitrogen Antibodies
- Product name
- PPAR alpha Polyclonal Antibody
- Antibody type
- Polyclonal
- Antigen
- Synthetic peptide
- Description
- PA1-822A detects peroxisome proliferator activated receptor (PPAR) alpha from mouse samples. PA1-822A has been successfully used in Western blot, immunoprecipitation and immunofluoresence procedures. By Western blot, this antibody detects an ~52 kDa protein representing PPAR alpha from 3T3-L1 cell lysate. Immunofluoresence staining is observed predominantly in the nucleus as well as the cytoplasm. PA1-822A immunogen is a synthetic peptide corresponding to residues M(1) V D T E S P I C P L S P L E A D D(18) C of mouse PPAR alpha. A single amino acid substitution (I8 to L8) exists between the mouse and human protein. This immunizing peptide (Cat.# PEP-025) is available for use in neutralization and control experiments.
- Reactivity
- Human, Mouse
- Host
- Rabbit
- Isotype
- IgG
- Vial size
- 100 µL
- Concentration
- 1 mg/mL
- Storage
- -20°C, Avoid Freeze/Thaw Cycles
Submitted references Sex Differences in Cardiac Pathology of SARS-CoV2 Infected and Trypanosoma cruzi Co-infected Mice.
Early-Life Exposure to Low-Dose Cadmium Accelerates Diethylnitrosamine and Diet-Induced Liver Cancer.
ACOX2 is a prognostic marker and impedes the progression of hepatocellular carcinoma via PPARα pathway.
Molecular and phenotypic analysis of rodent models reveals conserved and species-specific modulators of human sarcopenia.
Simiao Decoction Alleviates Gouty Arthritis by Modulating Proinflammatory Cytokines and the Gut Ecosystem.
Satellite glial cells promote regenerative growth in sensory neurons.
Combined deletion of Glut1 and Glut3 impairs lung adenocarcinoma growth.
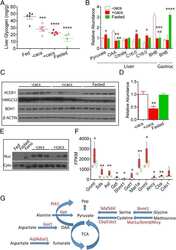
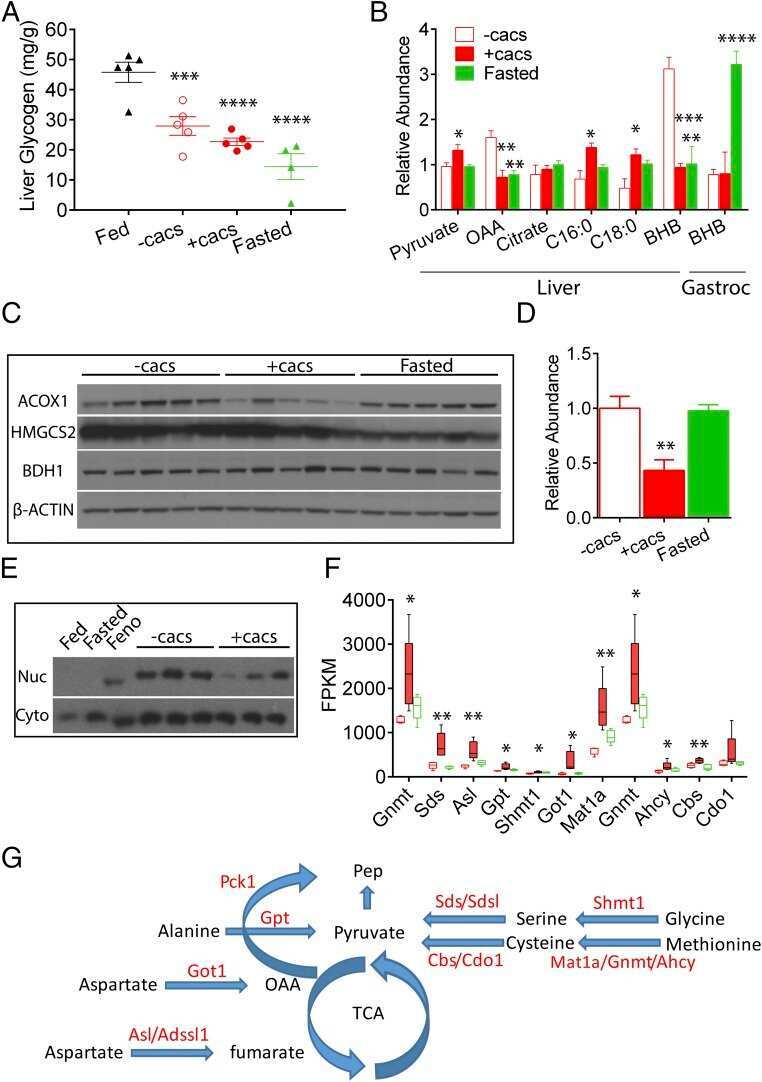
Diet Alters Serum Metabolomic Profiling in the Mouse Model of Chronic Chagas Cardiomyopathy.
Ginsenoside Rb1 Induces Beta 3 Adrenergic Receptor-Dependent Lipolysis and Thermogenesis in 3T3-L1 Adipocytes and db/db Mice.
Fibrates as drugs with senolytic and autophagic activity for osteoarthritis therapy.
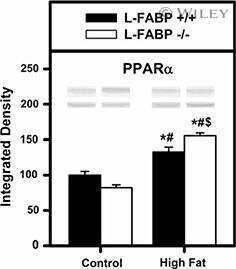
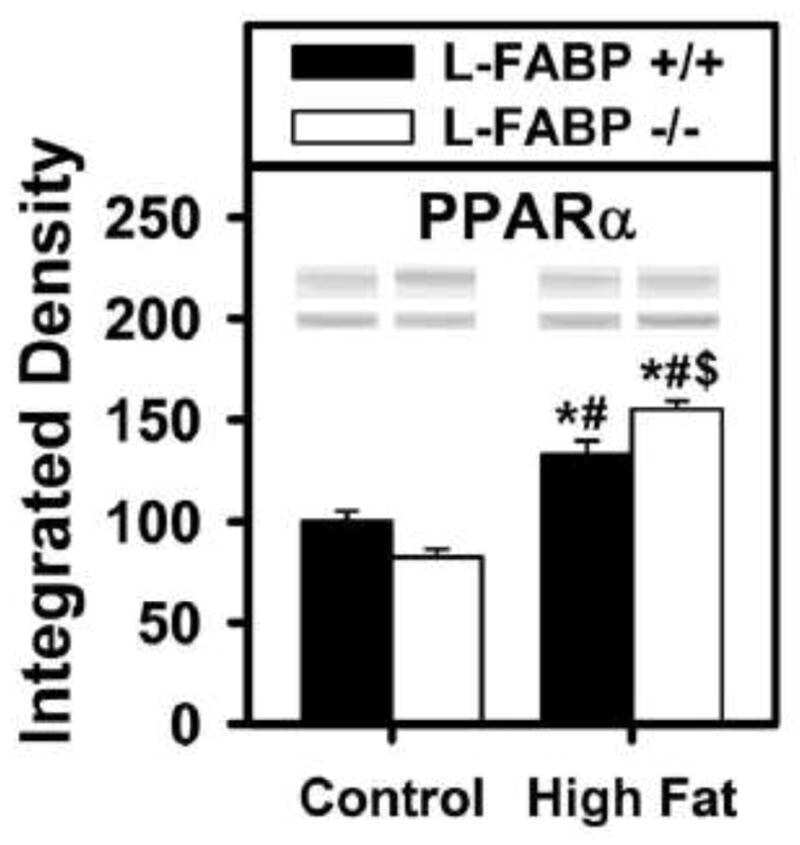
Effect of liver fatty acid binding protein (L-FABP) gene ablation on lipid metabolism in high glucose diet (HGD) pair-fed mice.
Lysosomal inhibition attenuates peroxisomal gene transcription via suppression of PPARA and PPARGC1A levels.
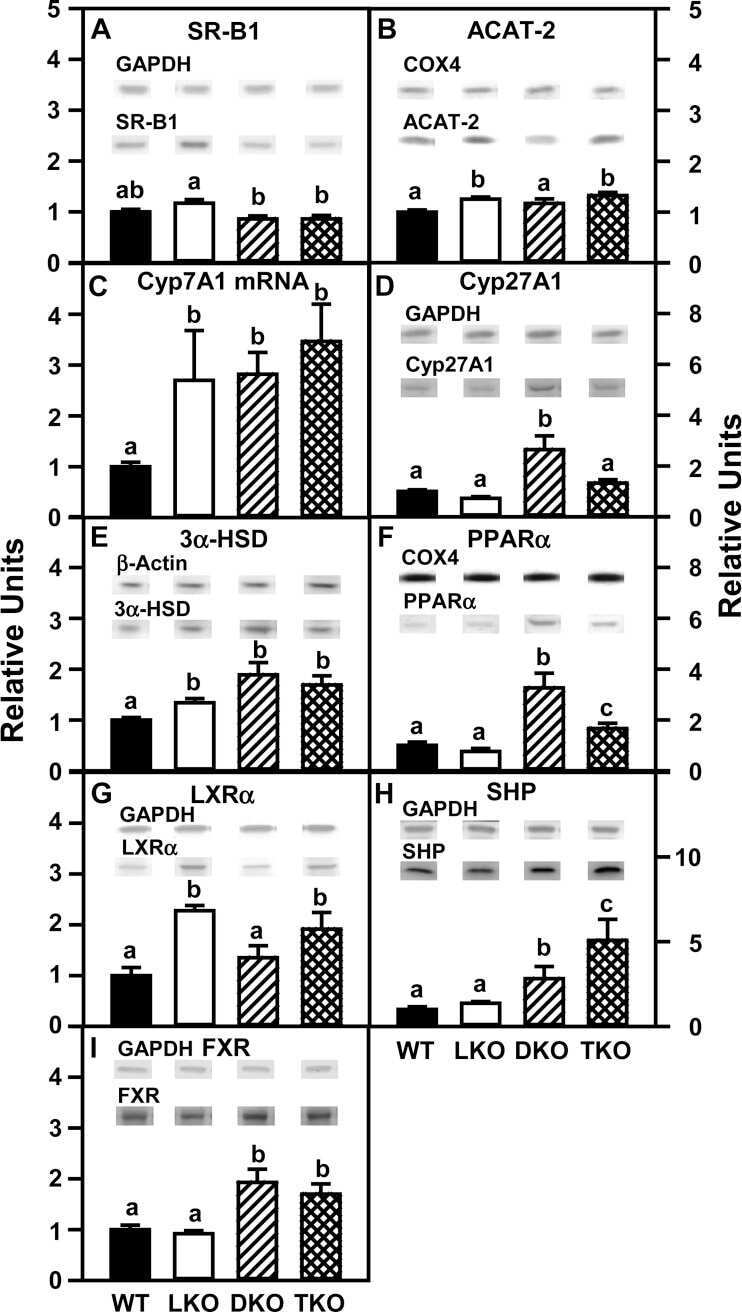
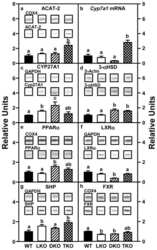
Ablating both Fabp1 and Scp2/Scpx (TKO) induces hepatic phospholipid and cholesterol accumulation in high fat-fed mice.
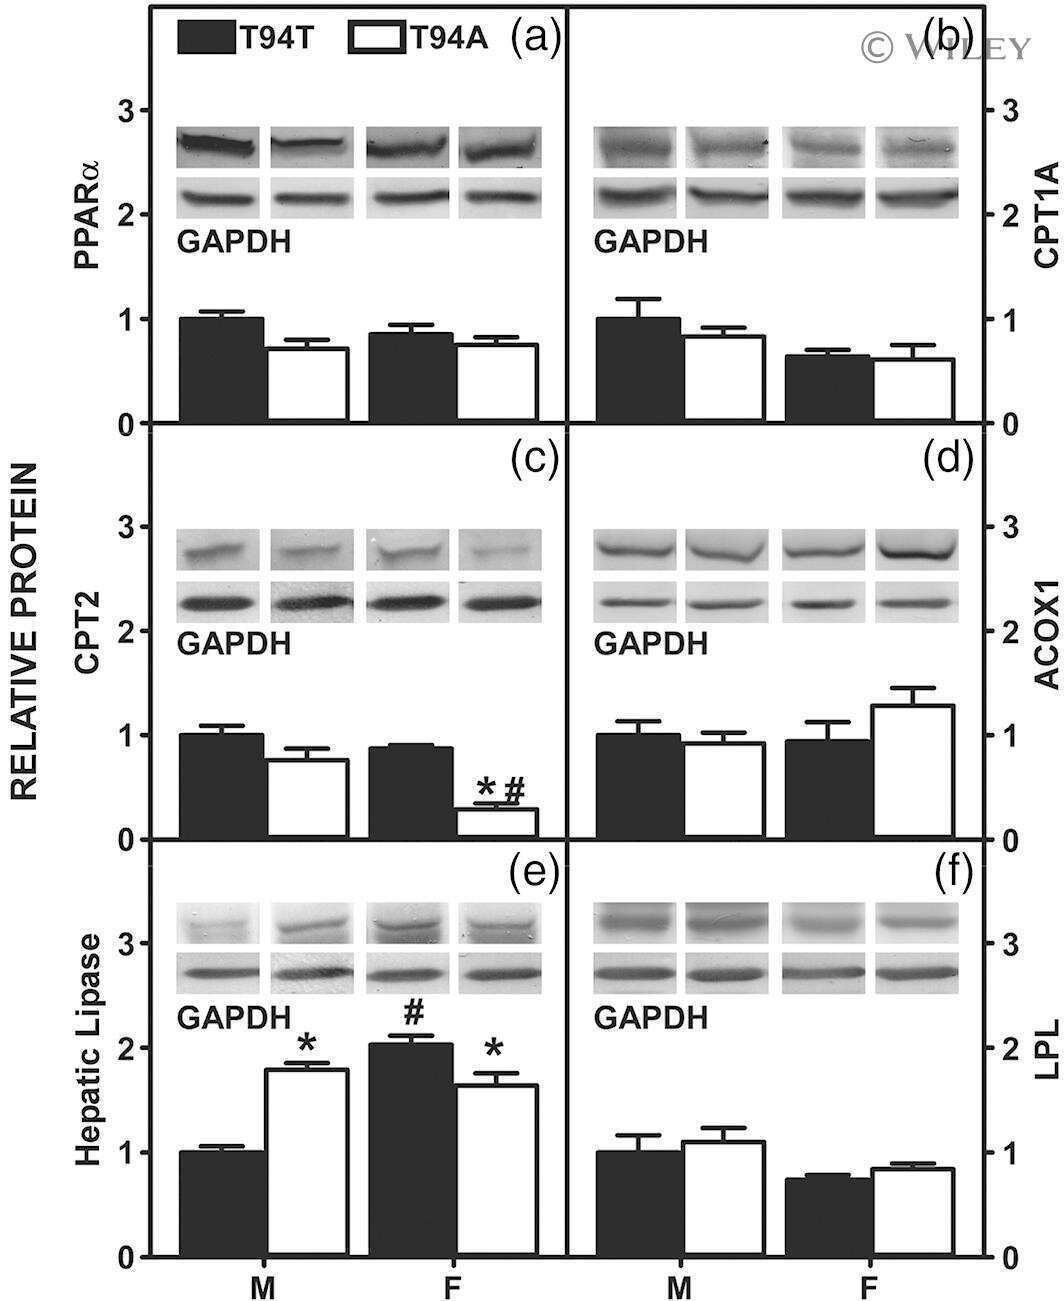
Human Liver Fatty Acid Binding Protein-1 T94A Variant, Nonalcohol Fatty Liver Disease, and Hepatic Endocannabinoid System.
Fenofibrate prevents skeletal muscle loss in mice with lung cancer.
Effect of Fabp1/Scp-2/Scp-x Ablation on Whole Body and Hepatic Phenotype of Phytol-Fed Male Mice.
Impact of dietary phytol on lipid metabolism in SCP2/SCPX/L-FABP null mice.
Peroxisome Proliferator-Activated Receptor α Facilitates Osteogenic Differentiation in MC3T3-E1 Cells via the Sirtuin 1-Dependent Signaling Pathway.
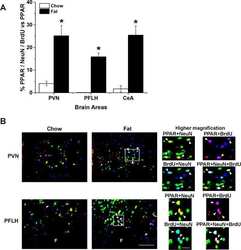
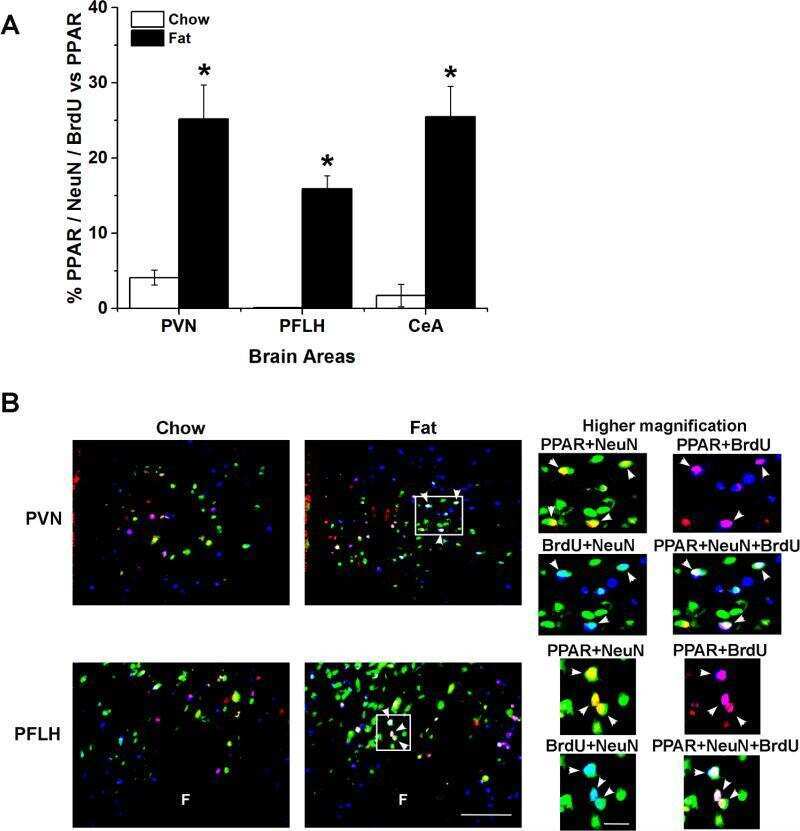
Prenatal fat exposure and hypothalamic PPAR β/δ: Possible relationship to increased neurogenesis of orexigenic peptide neurons.
Expression of Peroxisome Proliferator-Activated Receptor alpha (PPARα) in somatotropinomas: Relationship with Aryl hydrocarbon receptor Interacting Protein (AIP) and in vitro effects of fenofibrate in GH3 cells.
PPAR-δ is repressed in Huntington's disease, is required for normal neuronal function and can be targeted therapeutically.
Impact of SCP-2/SCP-x gene ablation and dietary cholesterol on hepatic lipid accumulation.
Relative contributions of L-FABP, SCP-2/SCP-x, or both to hepatic biliary phenotype of female mice.
Loss of L-FABP, SCP-2/SCP-x, or both induces hepatic lipid accumulation in female mice.
Enzogenol improves diabetes-related metabolic change in C57BL/KsJ-db/db mice, a model of type 2 diabetes mellitus.
Ablating L-FABP in SCP-2/SCP-x null mice impairs bile acid metabolism and biliary HDL-cholesterol secretion.
Inhibitors of Fatty Acid Synthesis Induce PPAR α -Regulated Fatty Acid β -Oxidative Genes: Synergistic Roles of L-FABP and Glucose.
Susceptibility of L-FABP-/- mice to oxidative stress in early-stage alcoholic liver.
Liver fatty acid binding protein gene-ablation exacerbates weight gain in high-fat fed female mice.
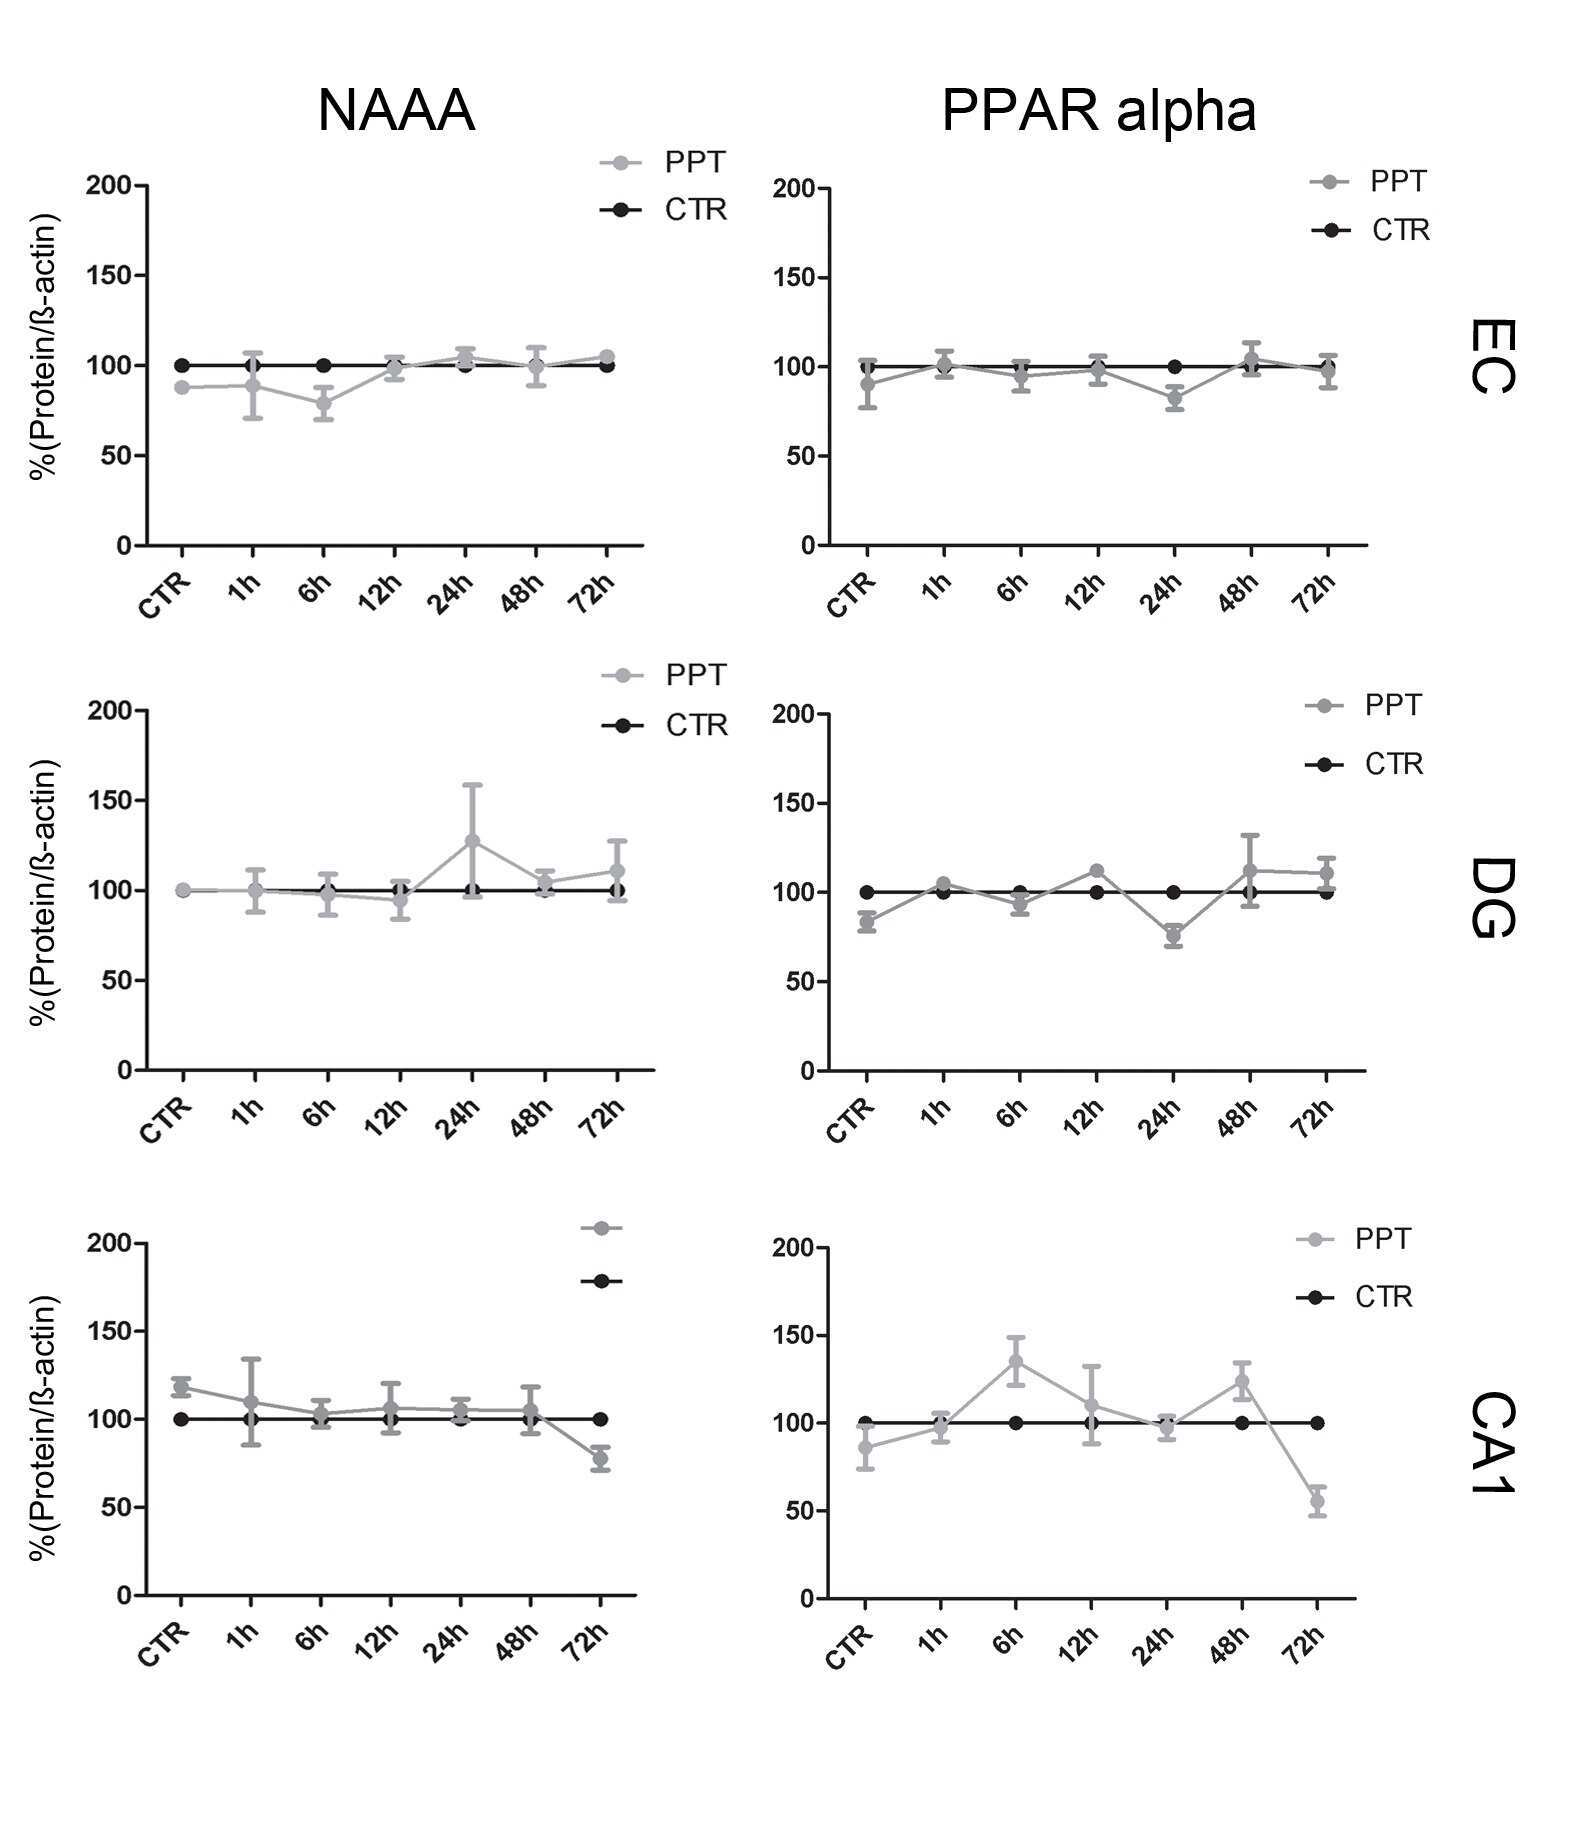
Site-specific and time-dependent activation of the endocannabinoid system after transection of long-range projections.
Regulation of the expression of the avian uncoupling protein 3 by isoproterenol and fatty acids in chick myoblasts: possible involvement of AMPK and PPARalpha?
Palmitoylethanolamide protects dentate gyrus granule cells via peroxisome proliferator-activated receptor-α.
Reduction of body weight, liver steatosis and expression of stearoyl-CoA desaturase 1 by the isoflavone daidzein in diet-induced obesity.
PPARalpha and PPARgamma are co-expressed, functional and show positive interactions in the rat urinary bladder urothelium.
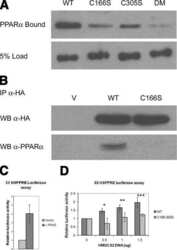
Palmitoylation of ketogenic enzyme HMGCS2 enhances its interaction with PPARalpha and transcription at the Hmgcs2 PPRE.
Rapid non-genomic regulation of Ca2+ signals and insulin secretion by PPAR alpha ligands in mouse pancreatic islets of Langerhans.
PPARalpha agonist fenofibrate suppresses tumor growth through direct and indirect angiogenesis inhibition.
Trans-species comparison of PPAR and RXR expression by rat and human urothelial tissues.
Urine acidification has no effect on peroxisome proliferator-activated receptor (PPAR) signaling or epidermal growth factor (EGF) expression in rat urinary bladder urothelium.
Fenofibrate represses interleukin-17 and interferon-gamma expression and improves colitis in interleukin-10-deficient mice.
Peroxisome proliferator-activated receptors (PPARs) and related transcription factors in differentiating astrocyte cultures.
PPAR gamma activators induce growth arrest and process extension in B12 oligodendrocyte-like cells and terminal differentiation of cultured oligodendrocytes.
Nuclear receptor peroxisome proliferator-activated receptor alpha (PPARalpha) is expressed in resting murine lymphocytes. The PPARalpha in T and B lymphocytes is both transactivation and transrepression competent.
Dhanyalayam D, Thangavel H, Lizardo K, Oswal N, Dolgov E, Perlin DS, Nagajyothi JF
Frontiers in cardiovascular medicine 2022;9:783974
Frontiers in cardiovascular medicine 2022;9:783974
Early-Life Exposure to Low-Dose Cadmium Accelerates Diethylnitrosamine and Diet-Induced Liver Cancer.
Men H, Young JL, Zhou W, Zhang H, Wang X, Xu J, Lin Q, Tan Y, Zheng Y, Cai L
Oxidative medicine and cellular longevity 2021;2021:1427787
Oxidative medicine and cellular longevity 2021;2021:1427787
ACOX2 is a prognostic marker and impedes the progression of hepatocellular carcinoma via PPARα pathway.
Zhang Q, Zhang Y, Sun S, Wang K, Qian J, Cui Z, Tao T, Zhou J
Cell death & disease 2021 Jan 4;12(1):15
Cell death & disease 2021 Jan 4;12(1):15
Molecular and phenotypic analysis of rodent models reveals conserved and species-specific modulators of human sarcopenia.
Börsch A, Ham DJ, Mittal N, Tintignac LA, Migliavacca E, Feige JN, Rüegg MA, Zavolan M
Communications biology 2021 Feb 12;4(1):194
Communications biology 2021 Feb 12;4(1):194
Simiao Decoction Alleviates Gouty Arthritis by Modulating Proinflammatory Cytokines and the Gut Ecosystem.
Lin X, Shao T, Huang L, Wen X, Wang M, Wen C, He Z
Frontiers in pharmacology 2020;11:955
Frontiers in pharmacology 2020;11:955
Satellite glial cells promote regenerative growth in sensory neurons.
Avraham O, Deng PY, Jones S, Kuruvilla R, Semenkovich CF, Klyachko VA, Cavalli V
Nature communications 2020 Sep 29;11(1):4891
Nature communications 2020 Sep 29;11(1):4891
Combined deletion of Glut1 and Glut3 impairs lung adenocarcinoma growth.
Contat C, Ancey PB, Zangger N, Sabatino S, Pascual J, Escrig S, Jensen L, Goepfert C, Lanz B, Lepore M, Gruetter R, Rossier A, Berezowska S, Neppl C, Zlobec I, Clerc-Rosset S, Knott GW, Rathmell JC, Abel ED, Meibom A, Meylan E
eLife 2020 Jun 23;9
eLife 2020 Jun 23;9
Diet Alters Serum Metabolomic Profiling in the Mouse Model of Chronic Chagas Cardiomyopathy.
Lizardo K, Ayyappan JP, Ganapathi U, Dutra WO, Qiu Y, Weiss LM, Nagajyothi JF
Disease markers 2019;2019:4956016
Disease markers 2019;2019:4956016
Ginsenoside Rb1 Induces Beta 3 Adrenergic Receptor-Dependent Lipolysis and Thermogenesis in 3T3-L1 Adipocytes and db/db Mice.
Lim S, Park J, Um JY
Frontiers in pharmacology 2019;10:1154
Frontiers in pharmacology 2019;10:1154
Fibrates as drugs with senolytic and autophagic activity for osteoarthritis therapy.
Nogueira-Recalde U, Lorenzo-Gómez I, Blanco FJ, Loza MI, Grassi D, Shirinsky V, Shirinsky I, Lotz M, Robbins PD, Domínguez E, Caramés B
EBioMedicine 2019 Jul;45:588-605
EBioMedicine 2019 Jul;45:588-605
Effect of liver fatty acid binding protein (L-FABP) gene ablation on lipid metabolism in high glucose diet (HGD) pair-fed mice.
McIntosh AL, Atshaves BP, Martin GG, Landrock D, Milligan S, Landrock KK, Huang H, Storey SM, Mackie J, Schroeder F, Kier AB
Biochimica et biophysica acta. Molecular and cell biology of lipids 2019 Jul;1864(7):985-1004
Biochimica et biophysica acta. Molecular and cell biology of lipids 2019 Jul;1864(7):985-1004
Lysosomal inhibition attenuates peroxisomal gene transcription via suppression of PPARA and PPARGC1A levels.
Tan HWS, Anjum B, Shen HM, Ghosh S, Yen PM, Sinha RA
Autophagy 2019 Aug;15(8):1455-1459
Autophagy 2019 Aug;15(8):1455-1459
Ablating both Fabp1 and Scp2/Scpx (TKO) induces hepatic phospholipid and cholesterol accumulation in high fat-fed mice.
Milligan S, Martin GG, Landrock D, McIntosh AL, Mackie JT, Schroeder F, Kier AB
Biochimica et biophysica acta. Molecular and cell biology of lipids 2018 Mar;1863(3):323-338
Biochimica et biophysica acta. Molecular and cell biology of lipids 2018 Mar;1863(3):323-338
Human Liver Fatty Acid Binding Protein-1 T94A Variant, Nonalcohol Fatty Liver Disease, and Hepatic Endocannabinoid System.
Martin GG, Landrock D, Dangott LJ, McIntosh AL, Kier AB, Schroeder F
Lipids 2018 Jan;53(1):27-40
Lipids 2018 Jan;53(1):27-40
Fenofibrate prevents skeletal muscle loss in mice with lung cancer.
Goncalves MD, Hwang SK, Pauli C, Murphy CJ, Cheng Z, Hopkins BD, Wu D, Loughran RM, Emerling BM, Zhang G, Fearon DT, Cantley LC
Proceedings of the National Academy of Sciences of the United States of America 2018 Jan 23;115(4):E743-E752
Proceedings of the National Academy of Sciences of the United States of America 2018 Jan 23;115(4):E743-E752
Effect of Fabp1/Scp-2/Scp-x Ablation on Whole Body and Hepatic Phenotype of Phytol-Fed Male Mice.
Landrock D, Milligan S, Martin GG, McIntosh AL, Landrock KK, Schroeder F, Kier AB
Lipids 2017 May;52(5):385-397
Lipids 2017 May;52(5):385-397
Impact of dietary phytol on lipid metabolism in SCP2/SCPX/L-FABP null mice.
Milligan S, Martin GG, Landrock D, McIntosh AL, Mackie JT, Schroeder F, Kier AB
Biochimica et biophysica acta. Molecular and cell biology of lipids 2017 Mar;1862(3):291-304
Biochimica et biophysica acta. Molecular and cell biology of lipids 2017 Mar;1862(3):291-304
Peroxisome Proliferator-Activated Receptor α Facilitates Osteogenic Differentiation in MC3T3-E1 Cells via the Sirtuin 1-Dependent Signaling Pathway.
Gong K, Qu B, Wang C, Zhou J, Liao D, Zheng W, Pan X
Molecules and cells 2017 Jun 30;40(6):393-400
Molecules and cells 2017 Jun 30;40(6):393-400
Prenatal fat exposure and hypothalamic PPAR β/δ: Possible relationship to increased neurogenesis of orexigenic peptide neurons.
Chang GQ, Karatayev O, Lukatskaya O, Leibowitz SF
Peptides 2016 May;79:16-26
Peptides 2016 May;79:16-26
Expression of Peroxisome Proliferator-Activated Receptor alpha (PPARα) in somatotropinomas: Relationship with Aryl hydrocarbon receptor Interacting Protein (AIP) and in vitro effects of fenofibrate in GH3 cells.
Rotondi S, Modarelli A, Oliva MA, Rostomyan L, Sanita P, Ventura L, Daly AF, Esposito V, Angelucci A, Arcella A, Giangaspero F, Beckers A, Jaffrain-Rea ML
Molecular and cellular endocrinology 2016 May 5;426:61-72
Molecular and cellular endocrinology 2016 May 5;426:61-72
PPAR-δ is repressed in Huntington's disease, is required for normal neuronal function and can be targeted therapeutically.
Dickey AS, Pineda VV, Tsunemi T, Liu PP, Miranda HC, Gilmore-Hall SK, Lomas N, Sampat KR, Buttgereit A, Torres MJ, Flores AL, Arreola M, Arbez N, Akimov SS, Gaasterland T, Lazarowski ER, Ross CA, Yeo GW, Sopher BL, Magnuson GK, Pinkerton AB, Masliah E, La Spada AR
Nature medicine 2016 Jan;22(1):37-45
Nature medicine 2016 Jan;22(1):37-45
Impact of SCP-2/SCP-x gene ablation and dietary cholesterol on hepatic lipid accumulation.
Klipsic D, Landrock D, Martin GG, McIntosh AL, Landrock KK, Mackie JT, Schroeder F, Kier AB
American journal of physiology. Gastrointestinal and liver physiology 2015 Sep 1;309(5):G387-99
American journal of physiology. Gastrointestinal and liver physiology 2015 Sep 1;309(5):G387-99
Relative contributions of L-FABP, SCP-2/SCP-x, or both to hepatic biliary phenotype of female mice.
Martin GG, Landrock D, Landrock KK, Howles PN, Atshaves BP, Kier AB, Schroeder F
Archives of biochemistry and biophysics 2015 Dec 15;588:25-32
Archives of biochemistry and biophysics 2015 Dec 15;588:25-32
Loss of L-FABP, SCP-2/SCP-x, or both induces hepatic lipid accumulation in female mice.
Martin GG, Atshaves BP, Landrock KK, Landrock D, Schroeder F, Kier AB
Archives of biochemistry and biophysics 2015 Aug 15;580:41-9
Archives of biochemistry and biophysics 2015 Aug 15;580:41-9
Enzogenol improves diabetes-related metabolic change in C57BL/KsJ-db/db mice, a model of type 2 diabetes mellitus.
Bang CY, Choung SY
The Journal of pharmacy and pharmacology 2014 Jun;66(6):875-85
The Journal of pharmacy and pharmacology 2014 Jun;66(6):875-85
Ablating L-FABP in SCP-2/SCP-x null mice impairs bile acid metabolism and biliary HDL-cholesterol secretion.
Martin GG, Atshaves BP, Landrock KK, Landrock D, Storey SM, Howles PN, Kier AB, Schroeder F
American journal of physiology. Gastrointestinal and liver physiology 2014 Dec 1;307(11):G1130-43
American journal of physiology. Gastrointestinal and liver physiology 2014 Dec 1;307(11):G1130-43
Inhibitors of Fatty Acid Synthesis Induce PPAR α -Regulated Fatty Acid β -Oxidative Genes: Synergistic Roles of L-FABP and Glucose.
Huang H, McIntosh AL, Martin GG, Petrescu AD, Landrock KK, Landrock D, Kier AB, Schroeder F
PPAR research 2013;2013:865604
PPAR research 2013;2013:865604
Susceptibility of L-FABP-/- mice to oxidative stress in early-stage alcoholic liver.
Smathers RL, Galligan JJ, Shearn CT, Fritz KS, Mercer K, Ronis M, Orlicky DJ, Davidson NO, Petersen DR
Journal of lipid research 2013 May;54(5):1335-45
Journal of lipid research 2013 May;54(5):1335-45
Liver fatty acid binding protein gene-ablation exacerbates weight gain in high-fat fed female mice.
McIntosh AL, Atshaves BP, Landrock D, Landrock KK, Martin GG, Storey SM, Kier AB, Schroeder F
Lipids 2013 May;48(5):435-48
Lipids 2013 May;48(5):435-48
Site-specific and time-dependent activation of the endocannabinoid system after transection of long-range projections.
Kallendrusch S, Hobusch C, Ehrlich A, Ziebell S, Ueda N, Geisslinger G, Koch M, Dehghani F
PloS one 2012;7(3):e33537
PloS one 2012;7(3):e33537
Regulation of the expression of the avian uncoupling protein 3 by isoproterenol and fatty acids in chick myoblasts: possible involvement of AMPK and PPARalpha?
Joubert R, Métayer-Coustard S, Crochet S, Cailleau-Audouin E, Dupont J, Duclos MJ, Tesseraud S, Collin A
American journal of physiology. Regulatory, integrative and comparative physiology 2011 Jul;301(1):R201-8
American journal of physiology. Regulatory, integrative and comparative physiology 2011 Jul;301(1):R201-8
Palmitoylethanolamide protects dentate gyrus granule cells via peroxisome proliferator-activated receptor-α.
Koch M, Kreutz S, Böttger C, Benz A, Maronde E, Ghadban C, Korf HW, Dehghani F
Neurotoxicity research 2011 Feb;19(2):330-40
Neurotoxicity research 2011 Feb;19(2):330-40
Reduction of body weight, liver steatosis and expression of stearoyl-CoA desaturase 1 by the isoflavone daidzein in diet-induced obesity.
Crespillo A, Alonso M, Vida M, Pavón FJ, Serrano A, Rivera P, Romero-Zerbo Y, Fernández-Llebrez P, Martínez A, Pérez-Valero V, Bermúdez-Silva FJ, Suárez J, de Fonseca FR
British journal of pharmacology 2011 Dec;164(7):1899-915
British journal of pharmacology 2011 Dec;164(7):1899-915
PPARalpha and PPARgamma are co-expressed, functional and show positive interactions in the rat urinary bladder urothelium.
Egerod FL, Brünner N, Svendsen JE, Oleksiewicz MB
Journal of applied toxicology : JAT 2010 Mar;30(2):151-62
Journal of applied toxicology : JAT 2010 Mar;30(2):151-62
Palmitoylation of ketogenic enzyme HMGCS2 enhances its interaction with PPARalpha and transcription at the Hmgcs2 PPRE.
Kostiuk MA, Keller BO, Berthiaume LG
FASEB journal : official publication of the Federation of American Societies for Experimental Biology 2010 Jun;24(6):1914-24
FASEB journal : official publication of the Federation of American Societies for Experimental Biology 2010 Jun;24(6):1914-24
Rapid non-genomic regulation of Ca2+ signals and insulin secretion by PPAR alpha ligands in mouse pancreatic islets of Langerhans.
Ropero AB, Juan-Picó P, Rafacho A, Fuentes E, Bermúdez-Silva FJ, Roche E, Quesada I, de Fonseca FR, Nadal A
The Journal of endocrinology 2009 Feb;200(2):127-38
The Journal of endocrinology 2009 Feb;200(2):127-38
PPARalpha agonist fenofibrate suppresses tumor growth through direct and indirect angiogenesis inhibition.
Panigrahy D, Kaipainen A, Huang S, Butterfield CE, Barnés CM, Fannon M, Laforme AM, Chaponis DM, Folkman J, Kieran MW
Proceedings of the National Academy of Sciences of the United States of America 2008 Jan 22;105(3):985-90
Proceedings of the National Academy of Sciences of the United States of America 2008 Jan 22;105(3):985-90
Trans-species comparison of PPAR and RXR expression by rat and human urothelial tissues.
Chopra B, Hinley J, Oleksiewicz MB, Southgate J
Toxicologic pathology 2008 Apr;36(3):485-95
Toxicologic pathology 2008 Apr;36(3):485-95
Urine acidification has no effect on peroxisome proliferator-activated receptor (PPAR) signaling or epidermal growth factor (EGF) expression in rat urinary bladder urothelium.
Achanzar WE, Moyer CF, Marthaler LT, Gullo R, Chen SJ, French MH, Watson LM, Rhodes JW, Kozlosky JC, White MR, Foster WR, Burgun JJ, Car BD, Cosma GN, Dominick MA
Toxicology and applied pharmacology 2007 Sep 15;223(3):246-56
Toxicology and applied pharmacology 2007 Sep 15;223(3):246-56
Fenofibrate represses interleukin-17 and interferon-gamma expression and improves colitis in interleukin-10-deficient mice.
Lee JW, Bajwa PJ, Carson MJ, Jeske DR, Cong Y, Elson CO, Lytle C, Straus DS
Gastroenterology 2007 Jul;133(1):108-23
Gastroenterology 2007 Jul;133(1):108-23
Peroxisome proliferator-activated receptors (PPARs) and related transcription factors in differentiating astrocyte cultures.
Cristiano L, Cimini A, Moreno S, Ragnelli AM, Paola Cerù M
Neuroscience 2005;131(3):577-87
Neuroscience 2005;131(3):577-87
PPAR gamma activators induce growth arrest and process extension in B12 oligodendrocyte-like cells and terminal differentiation of cultured oligodendrocytes.
Roth AD, Leisewitz AV, Jung JE, Cassina P, Barbeito L, Inestrosa NC, Bronfman M
Journal of neuroscience research 2003 May 15;72(4):425-35
Journal of neuroscience research 2003 May 15;72(4):425-35
Nuclear receptor peroxisome proliferator-activated receptor alpha (PPARalpha) is expressed in resting murine lymphocytes. The PPARalpha in T and B lymphocytes is both transactivation and transrepression competent.
Jones DC, Ding X, Daynes RA
The Journal of biological chemistry 2002 Mar 1;277(9):6838-45
The Journal of biological chemistry 2002 Mar 1;277(9):6838-45
No comments: Submit comment
Supportive validation
- Submitted by
- Invitrogen Antibodies (provider)
- Main image
- Experimental details
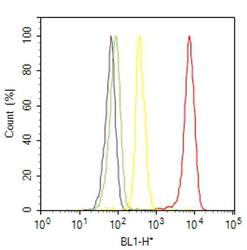
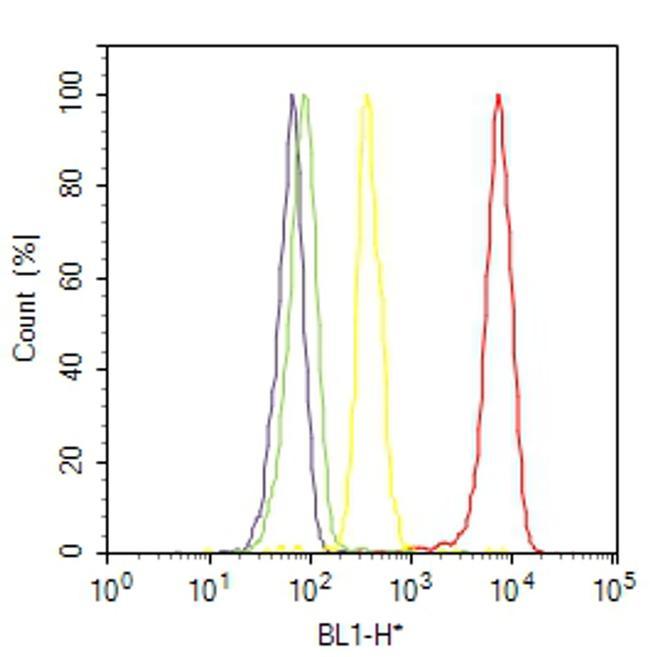
- Flow cytometry analysis of PPAR alpha was done on HeLa cells treated with anisomycin (25ug/mL, 30 minutes). Cells were fixed with 70% ethanol for 10 minutes, permeabilized with 0.25% Triton™ X-100 for 20 minutes, and blocked with 5% BSA for 30 minutes at room temperature. Cells were labeled with PPAR alpha Rabbit Polyclonal Antibody (PA1822A, red histogram) or with rabbit isotype control (yellow histogram) at 3-5 ug/million cells in 2.5% BSA. After incubation at room temperature for 2 hours, the cells were labeled with Alexa Fluor® 488 Goat Anti-Rabbit Secondary Antibody (A11008) at a dilution of 1:400 for 30 minutes at room temperature. The representative 10,000 cells were acquired and analyzed for each sample using an Attune® Acoustic Focusing Cytometer. The purple histogram represents unstained control cells and the green histogram represents no-primary-antibody control.
Supportive validation
- Submitted by
- Invitrogen Antibodies (provider)
- Main image
- Experimental details
- NULL
- Submitted by
- Invitrogen Antibodies (provider)
- Main image
- Experimental details
- NULL
- Submitted by
- Invitrogen Antibodies (provider)
- Main image

- Experimental details
- NULL
- Submitted by
- Invitrogen Antibodies (provider)
- Main image

- Experimental details
- NULL
- Submitted by
- Invitrogen Antibodies (provider)
- Main image
- Experimental details
- NULL
- Submitted by
- Invitrogen Antibodies (provider)
- Main image
- Experimental details
- NULL

- Submitted by
- Invitrogen Antibodies (provider)
- Main image

- Experimental details
- NULL
- Submitted by
- Invitrogen Antibodies (provider)
- Main image

- Experimental details
- NULL
- Submitted by
- Invitrogen Antibodies (provider)
- Main image
- Experimental details
- NULL

- Submitted by
- Invitrogen Antibodies (provider)
- Main image
- Experimental details
- NULL

- Submitted by
- Invitrogen Antibodies (provider)
- Main image
- Experimental details
- NULL
- Submitted by
- Invitrogen Antibodies (provider)
- Main image

- Experimental details
- NULL
- Submitted by
- Invitrogen Antibodies (provider)
- Main image
- Experimental details
- NULL
- Submitted by
- Invitrogen Antibodies (provider)
- Main image

- Experimental details
- NULL
- Submitted by
- Invitrogen Antibodies (provider)
- Main image
- Experimental details
- NULL

- Submitted by
- Invitrogen Antibodies (provider)
- Main image
- Experimental details
- NULL

- Submitted by
- Invitrogen Antibodies (provider)
- Main image
- Experimental details
- NULL
- Submitted by
- Invitrogen Antibodies (provider)
- Main image
- Experimental details
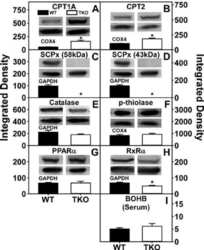
- Figure 11 Expression of key nuclear receptors involved in fatty acid and glucose metabolism as a function of time. Primary hepatocytes were isolated from mouse livers and maintained in culture for up to four days as described in Methods. Representative western blots relative to a housekeeping protein (COX-1) are shown in the inserts. Quantitative analysis of multiple western blots relative to housekeeping protein was shown as black bars for PPAR alpha (Panel a), LXR alpha (Panel b), SREBP1 (Panel c), and ChREBP (Panel d) as described in Methods. Time 0 = concentration in liver while time of 1-4 days indicates time in culture. Mean +- SEM, n = 3-6.

- Submitted by
- Invitrogen Antibodies (provider)
- Main image
- Experimental details
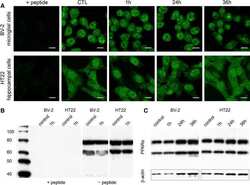
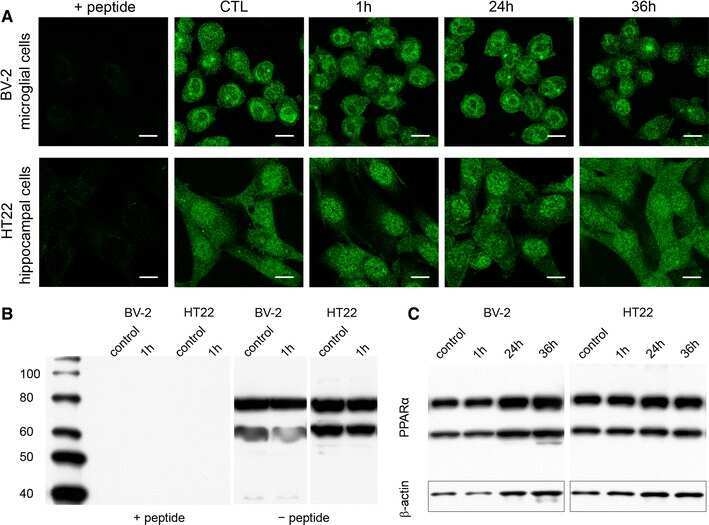
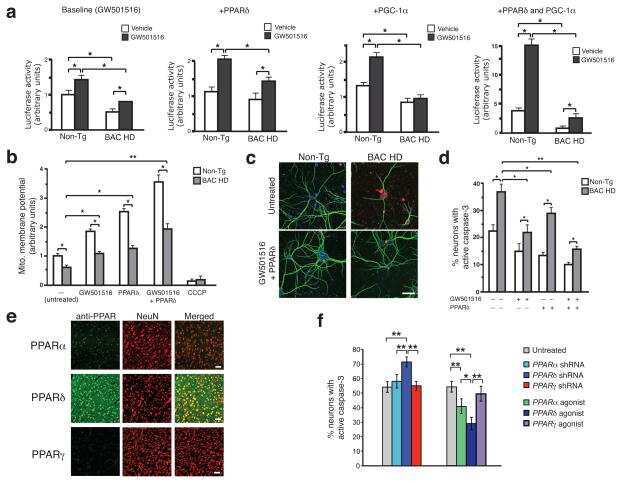
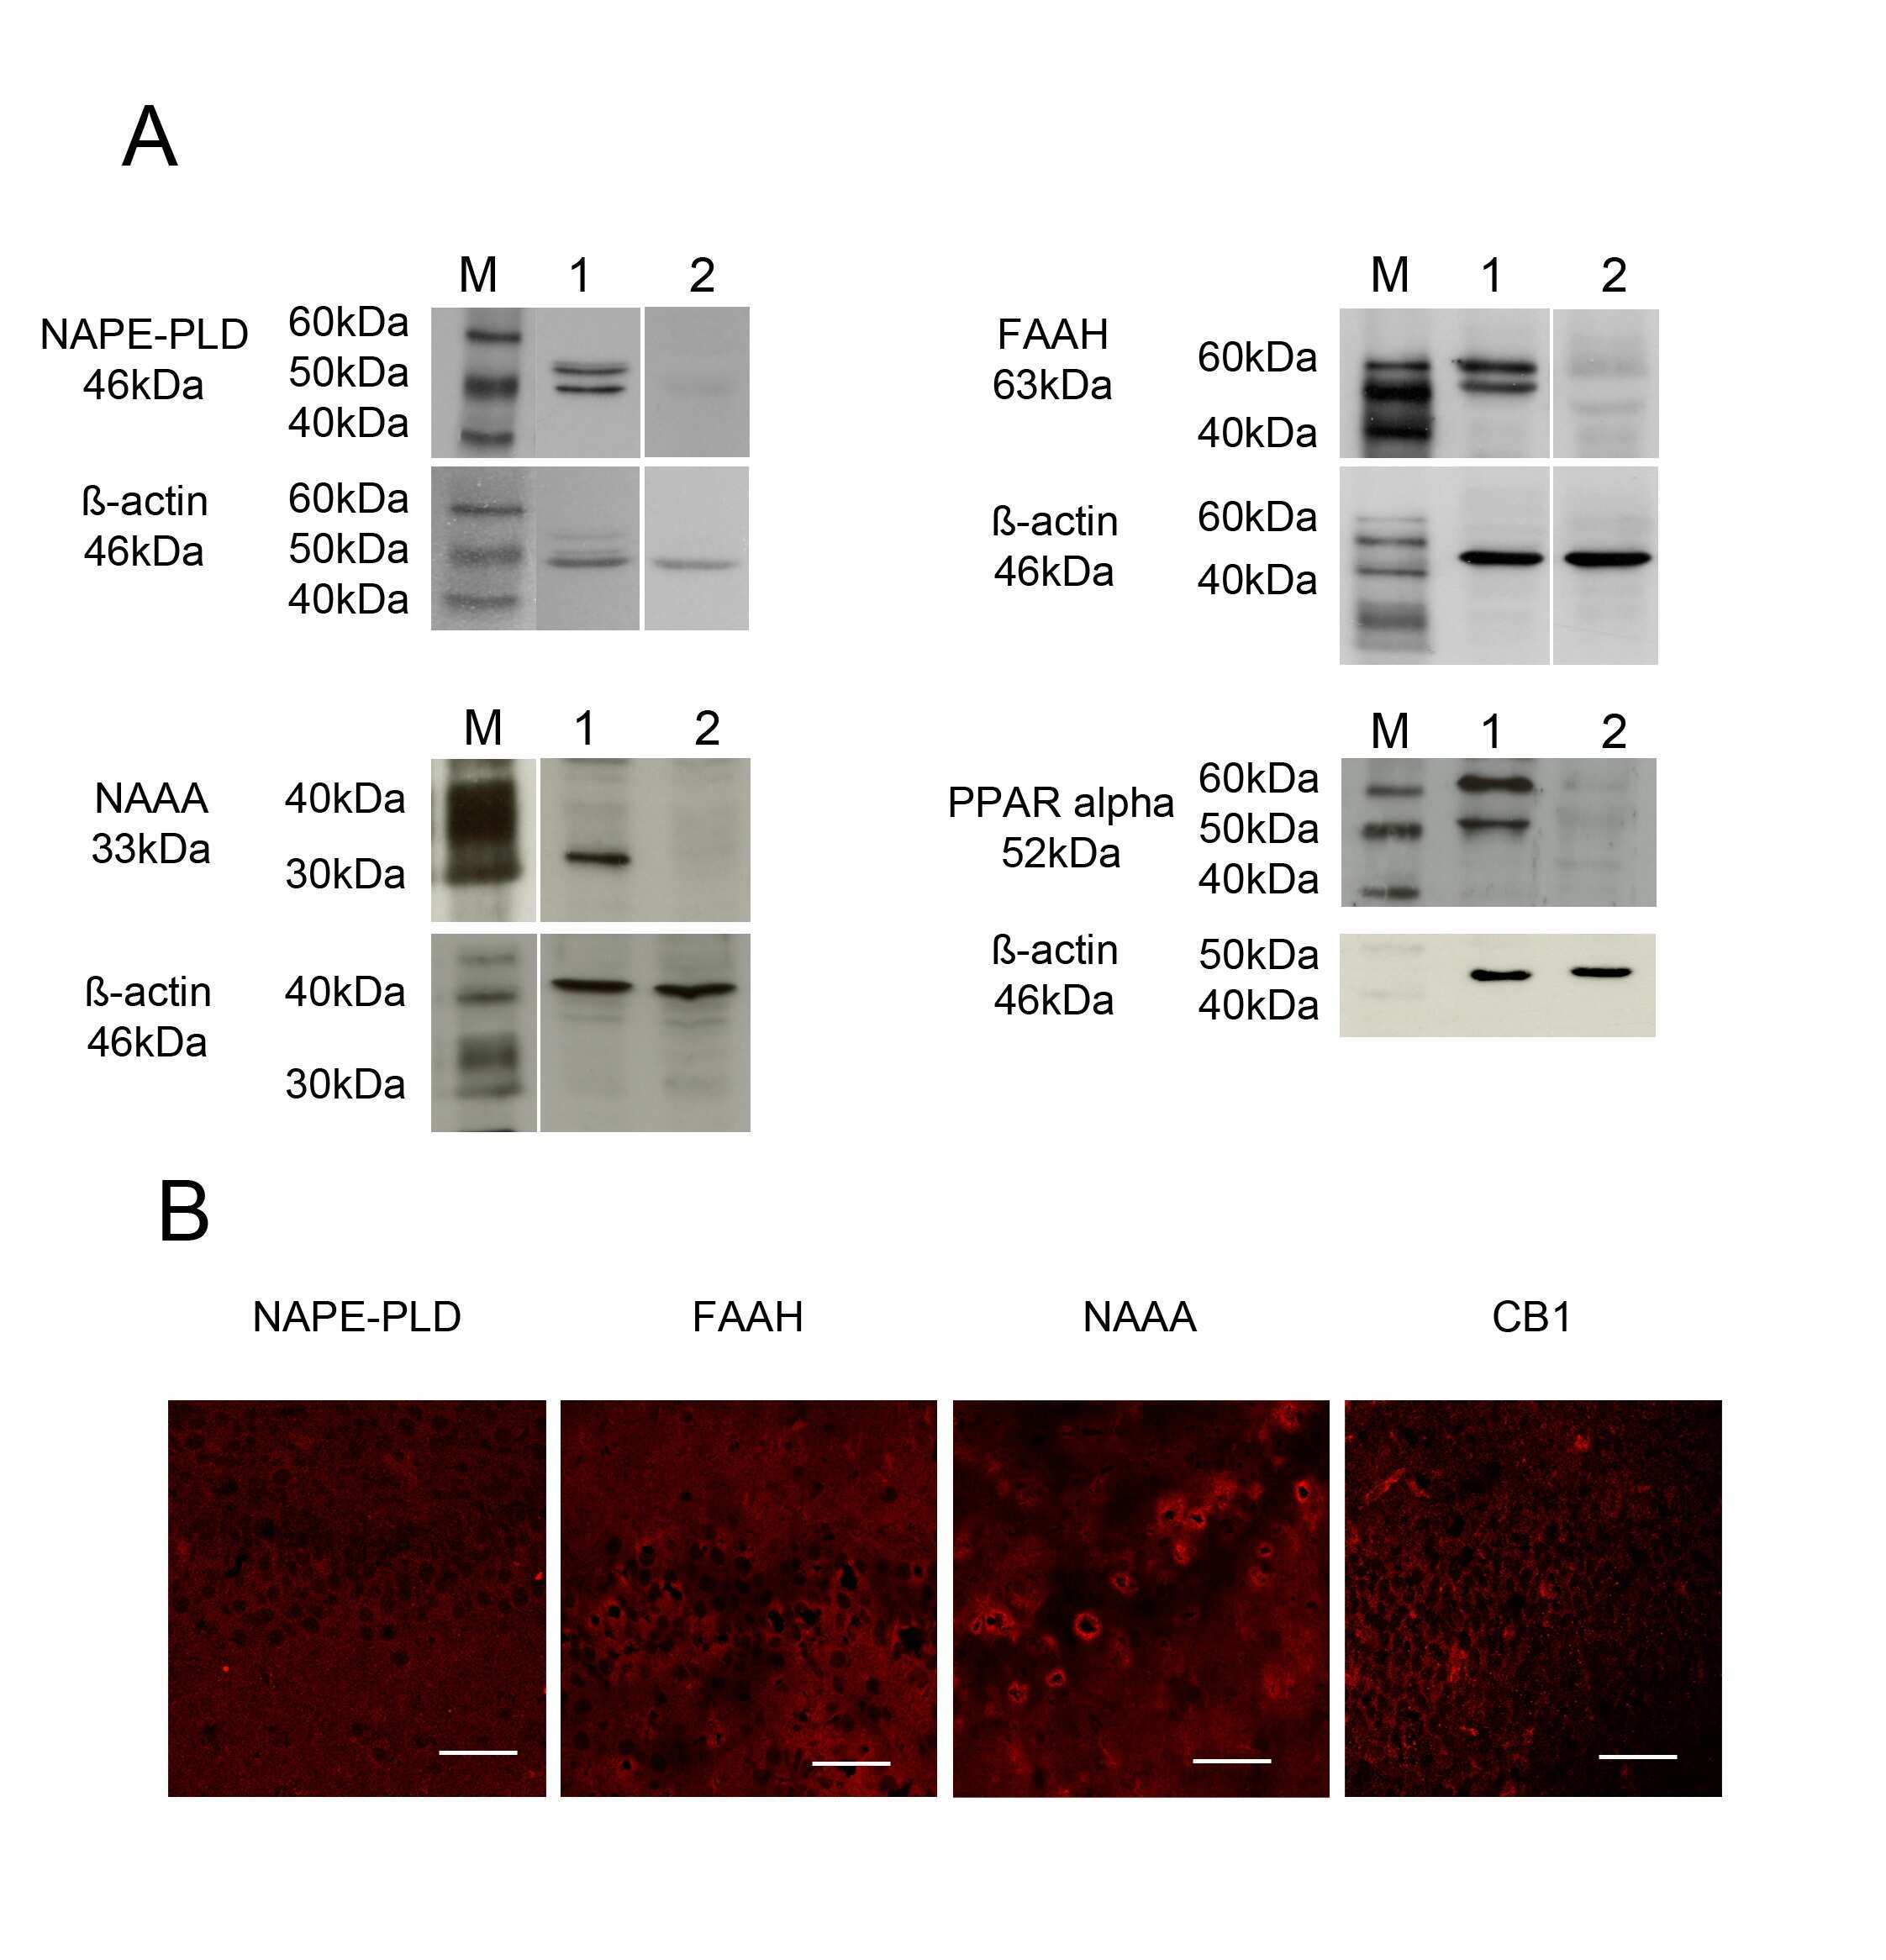
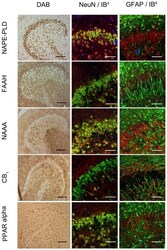
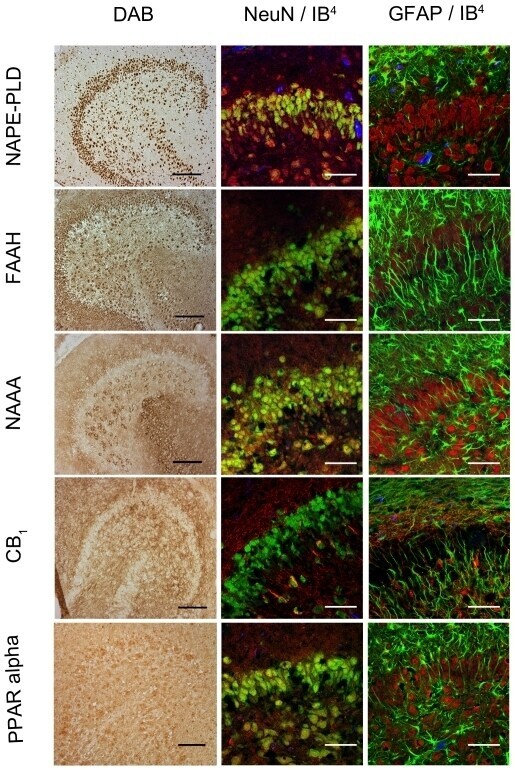
- Figure 4 Immunocytochemical analyses of NAPE-PLD, FAAH, NAAA, CB 1 and PPAR alpha in dentate gyrus 24hpl. Left column: DG in overview after DAB staining. Middle column; Triple staining of eCB system related proteins with NeuN and IB 4 . Right column; Triple staining of OHSC with eCB system related proteins in combination with NeuN and GFAP. The granular cell layer of the DG and interneurons in the hilus region showed a strong immunoreaction for NAPE-PLD. No overlap was observed with GFAP or IB 4 . The granular cell layer of the DG and especially interneurons in the hilus region were strongly immunoreactive for FAAH. No overlap was observed with GFAP or IB 4 . Please note the similarity of staining pattern of NAPE-PLD and FAAH immunoreactions. NAAA was found in perikarya and nuclei of neurons. In addition to granular cell layer of the DG and hilar neurons CA3 region was strongly labeled. Astrocytes and microglia seem free of NAAA. The entire molecular layer of the dentate gyrus showed a positive CB 1 immunoreaction. CB 1 was present in Microglia and to a lesser extent in astrocytes. PPAR alpha was observed in perikarya and nuclei of neurons. Microglia and Astrocytes showed a positive immunoreaction for PPAR alpha (n = 3, bars: left column = 100 um, middle and right columns = 50 um).
- Submitted by
- Invitrogen Antibodies (provider)
- Main image
- Experimental details
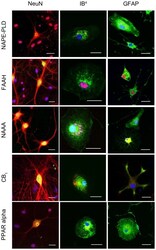
- Figure 5 Immunocytochemical analyses of NAPE-PLD, FAAH, NAAA, CB 1 and PPAR alpha in primary neuronal (left column), microglia (middle column) and astrocyte (left column) cell cultures. In neurons, NAPE-PLD was distributed in the perikarya but not in neuronal processes. In microglia NAPE-PLD immunoreactions was detectable in small vesicles closely located to the nucleus. NAPE-PLD was not found in protoplasmic astrocytes whereas fibrillary astrocytes showed an immunosignal comparable to microglia. The immunosignal for FAAH in primary neurons was localized in the cell bodies as well as in the primary branches of the neurites. In microglia and astrocytes, FAAH was localized within the nucleus, respectively. In fibrillary astrocytes a FAAH immunoreaction was additionally observed in vesicles. NAAA was clearly found in neurons but was barely found in microglia and astrocytes. In microglia NAAA showed a vesicular staining pattern close to the nucleus. Protoplasmic astrocytes were immunoreactive for NAAA whereas fibrillary astrocytes did not show any NAAA immunosignal. A robust CB 1 immunoreaction was found in neurons. To a lower extent, CB 1 immunosignals were detectable in microglia and astrocytes. Primary neurons showed a strong PPAR alpha immunoreaction in their Perikarya and nuclei. Microglia and astrocytes were positive for PPAR alpha immunoreaction in a vesicular pattern. (n = 3, bar = 20 um).
- Submitted by
- Invitrogen Antibodies (provider)
- Main image
- Experimental details
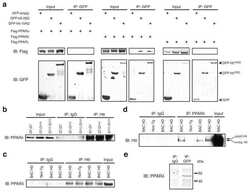
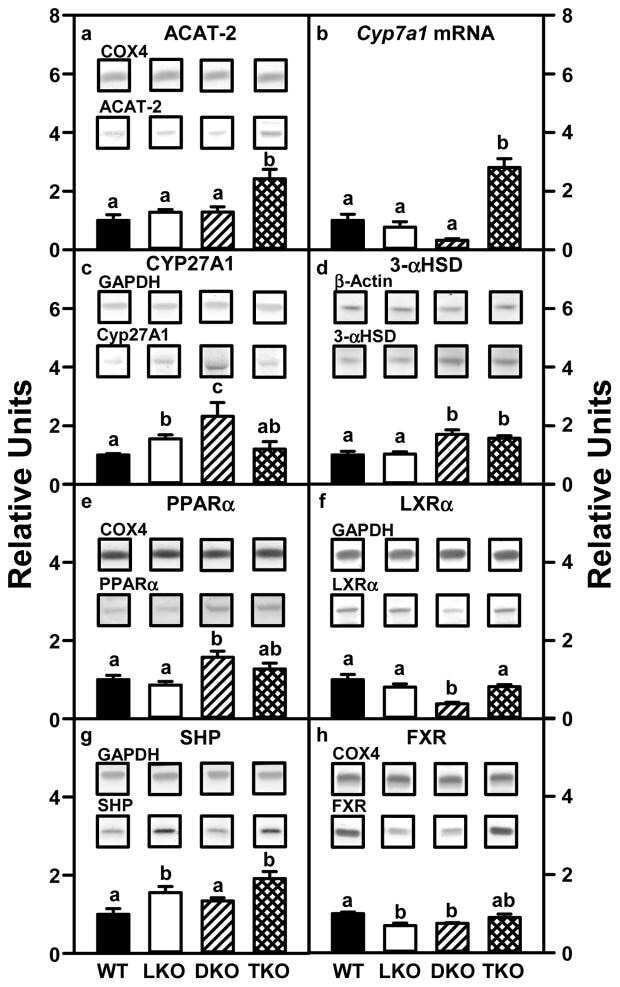
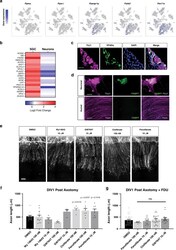
- Fig. 7 Activation of PPARalpha in SGC promotes axon regeneration in neuron-SGC cocultures. a t-SNE overlay for expression of the genes Pparalpha , Ppargamma , and Pparalpha target genes Ppargc1a , Fads2 , and Pex11a . b Heat map of PPARalpha target genes expression after nerve injury in SGC and neurons. c Representative images of DRG sections immunostained for PPARalpha (green) and TUJ1 (magenta). n = 3 biologically independent animals. Scale bar: 100 um. d Neuronal and axonal area in embryonic DRG spot co-cultures at DIV7, immunostained for FABP7 (green) and TUJ1 (magenta). n = 3 biologically independent experiments. Scale Bar: 100 um (neuronal) and 50 um (axonal). e Embryonic DRG spot co-cultures axotomized at DIV7 after a 24 h pre-treatment with the indicated PPARalpha agonists at the indicated concentration. Cultures were fixed after 24 h and stained with SCG10. Scale Bar: 50 um. f Distance of regenerating axons was measured from the injury site from images shown in ( e ). g Embryonic DRG spot culture was supplement with FDU (5-deoxyfluoruridine) to eliminate dividing cells in the culture. Axotomy was performed at DIV7 after a 24 h pre-treatment with the indicated PPARalpha agonists. Distance of regenerating axons was measured from injury site after 24 h. ns-non significant. n = 4 biologically independent animals examined over 2 independent experiments for ( f and g ). P values determined by One way ANOVA followed by Dunnett's multiple comparisons test are presented in (

- Submitted by
- Invitrogen Antibodies (provider)
- Main image
- Experimental details
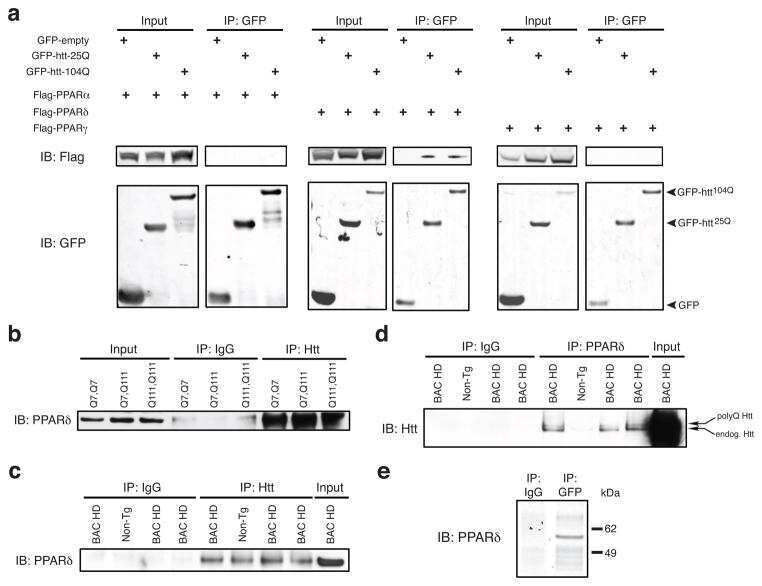
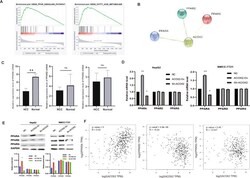
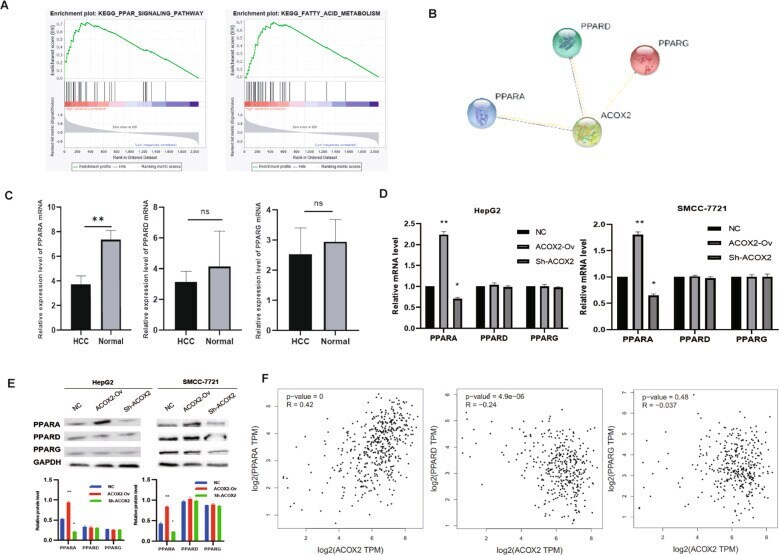
- Fig. 8 ACOX2 inhibits tumor through the PPARalpha signaling pathway. A The GSEA showed that PPAR ( P = 0.004) and FATTY_ACID_METABOLISM ( P = 0.006) were significantly changed. B The PPI network of ACOX2, PPARA, PPARD, and PPARG was constructed by the String database. C The expression of PPARA, PPARD, and PPARG genes in liver cancer tissues and adjacent noncancerou tissues by using RT-qPCR. D The mRNA expression of PPARA, PPARD, and PPARG was detected by RT-qPCR in HepG2 and SMCC-7721 (NC, the normal HCC cell lines; ACOX2-Ov, overexpression of ACOX2; Sh- ACOX2, knockdown ACOX2). E The protein levels of PPARA, PPARD, and PPARG were detected by Western blot in HepG2 and SMCC-7721 (NC, the normal HCC cell lines; ACOX2-Ov, overexpression of ACOX2; Sh- ACOX2, knockdown ACOX2, * P < 0.05; ** P < 0.01; n.s. not significant). F The Pearson correlation analysis between ACOX2 and PPARA, PPARD, and PPARG by the GEPIA database.
- Submitted by
- Invitrogen Antibodies (provider)
- Main image
- Experimental details
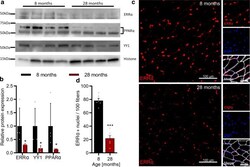
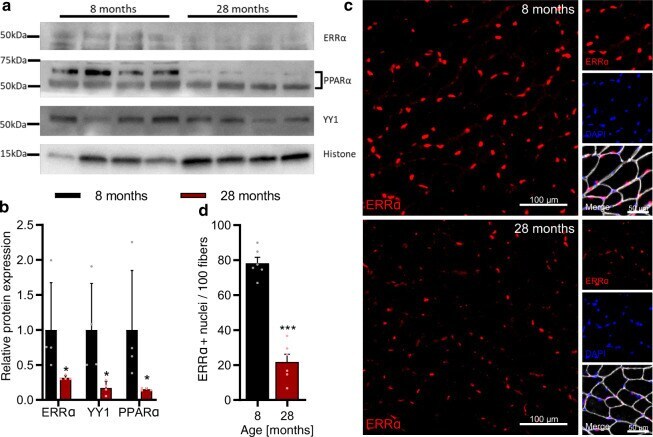
- Fig. 7 Validation of predictions for the ISMARA-inferred activity of transcription factors (TFs) during muscle aging. a Representative western blot analysis of the abundance of TFs ERRalpha, YY1, and PPARalpha in the gastrocnemius muscle (tissue lysate) of 8 and 28-months-old mice, respectively. b Quantification of western blots showing the relative abundance of TFs ERRalpha, YY1, and PPARalpha normalized to the nuclear protein histone H3, respectively. *Denotes a significant difference based on two-sided Mann-Whitney U test between 8 and 28 months-old mice with p -value < 0.05. c Representative images of tibialis anterior cross sections of 8 and 28-months-old mice with magnification stained for ERRalpha (red), Laminin alpha2 (white), and DAPI (blue). d Quantification of the percentage of ERRalpha-positive nuclei in tibialis anterior fibers of 8 and 28-months-old mice, respectively. ***Denotes a significant difference based on two-sided Student's t -test between 8 and 28-months-old mice with p -value < 0.001. All values were visualized as mean +- standard error of the mean (SE).
- Submitted by
- Invitrogen Antibodies (provider)
- Main image

- Experimental details
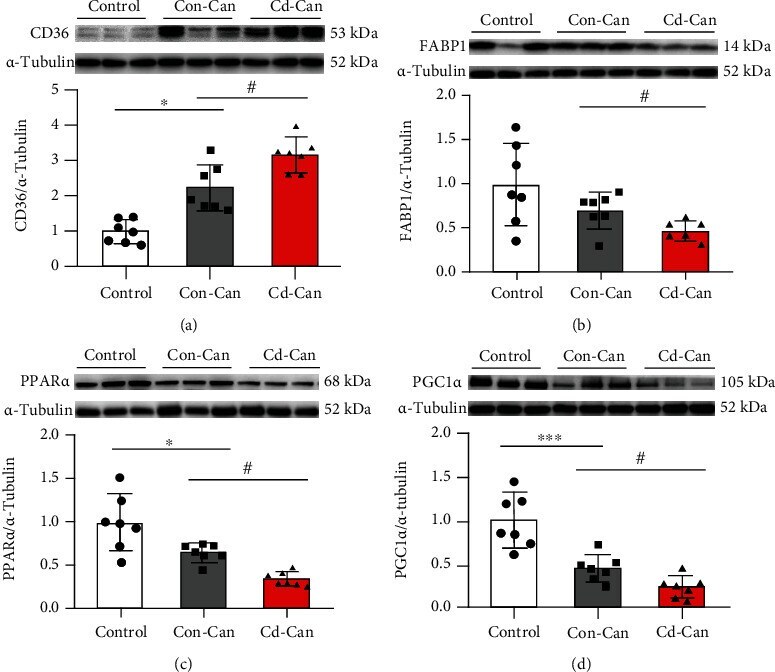
- Figure 7 Fatty acid metabolism-related protein expression in the peritumor liver tissue. Protein expression of CD36 (a), FABP1 (b), PPAR alpha (c), and PGC1 alpha (d) in the peritumor liver tissue of male mice was detected, and alpha -tubulin was used as a loading control for western blot assay. Quantitative data were normalized to the control and expressed as mean +- SEM ( n = 7). * p < 0.05 and *** p < 0.01, Con-Can vs. control; # p < 0.05, Cd-Can vs. Con-Can. CD36: cluster of differentiation 36; FABP1: fatty acid-binding protein 1; PPAR alpha : peroxisome proliferator-activated receptor alpha; PGC1 alpha : peroxisome co-activator-1 alpha; SEM: standard error of the mean.
- Submitted by
- Invitrogen Antibodies (provider)
- Main image
- Experimental details
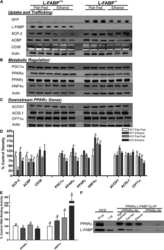
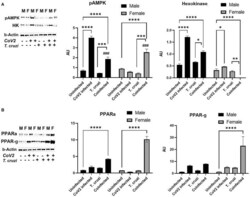
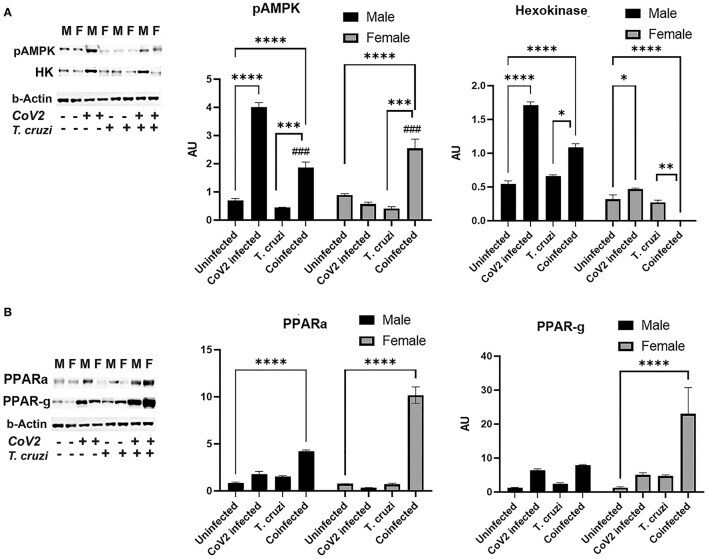
- Immunoblot analysis of markers of glucose and lipid metabolism in the hearts of CoV2 infected, T. cruzi infected, and coinfected huACE2 mice. Immunoblot images of (A) markers of glucose metabolism (pAMPK and hexokinase II) and (B) markers of lipid metabolism (PPARalpha and PPARgamma). beta-Actin was used as loading control. Fold changes in the protein levels normalized to beta-Actin are shown as bar graphs (A dot plot displaying individual data points is presented in Supplementary Figure 4 ). The error bars represent standard error of the mean. * p < 0.05, ** p < 0.01, *** p < 0.001 and **** p < 0.0001 compared to uninfected sex matched mice ( n = 4/sex/group) ( ### p
- Submitted by
- Invitrogen Antibodies (provider)
- Main image

- Experimental details
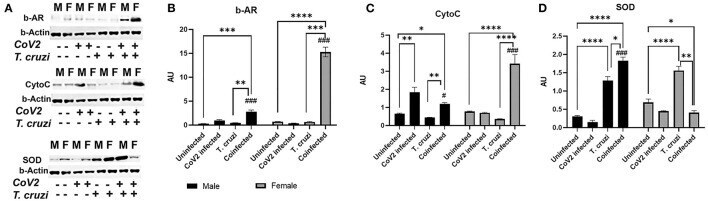
- Immunoblot analysis of beta-Adrenergic Receptor and markers of mitochondrial beta-oxidation in the hearts of CoV2 infected, T. cruzi infected, and coinfected huACE2 mice. Western blot images (A) of beta-Adrenergic Receptor (beta-AR), cytochrome C (Cyto C), and superoxide dismutase (SOD). beta-Actin was used as loading control. Fold changes in the protein levels of beta-AR (B) , Cyto C (C) and SOD (D) were normalized to beta-Actin expression and are shown as bar graphs (A dot plot displaying individual data points is presented in Supplementary Figure 4 ). The error bars represent standard error of the mean. * p < 0.05, ** p < 0.01, *** p < 0.001 and **** p < 0.0001 compared to uninfected sex matched mice ( n = 4/sex/group) ( # p
- Submitted by
- Invitrogen Antibodies (provider)
- Main image
- Experimental details
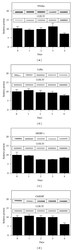
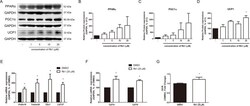
- Figure 5 Effect of Rb1 on browning in mature 3T3-L1 adipocytes. (A) Western blot assays were performed to measure the changes of PPARalpha, PGC1alpha, and UCP1. Relative expression levels of (B) PPARalpha, (C) PGC1alpha, and (D) UCP1 were quantified. Expressions of PPARalpha, PGC1alpha, and UCP1 were normalized against GAPDH. (E) mRNA levels of beige-specific genes ( Prdm16, Tmem26, Tbx1 and Cd137 ) and (F) mitochondrial beta oxidation-related genes ( Cpt1a and Cpt1b ) were analyzed by RT-PCR. Relative mRNA level of each gene was normalized against Gapdh . (G) Effect of Rb1 (20 muM) on OCR in mature adipocytes. DMSO was used as vehicle. Data are expressed as mean +- S.E.M. of three or more experiments. * p < 0.05 vs. vehicle-treated 3T3-L1 adipocytes.
- Submitted by
- Invitrogen Antibodies (provider)
- Main image
- Experimental details
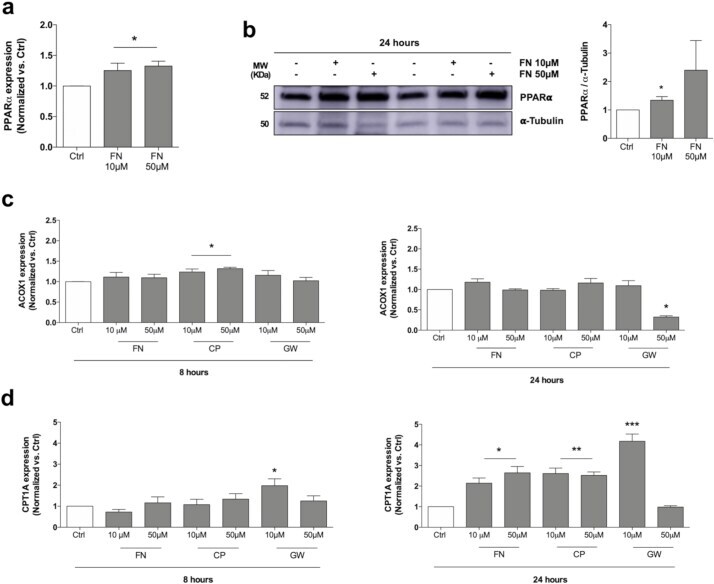
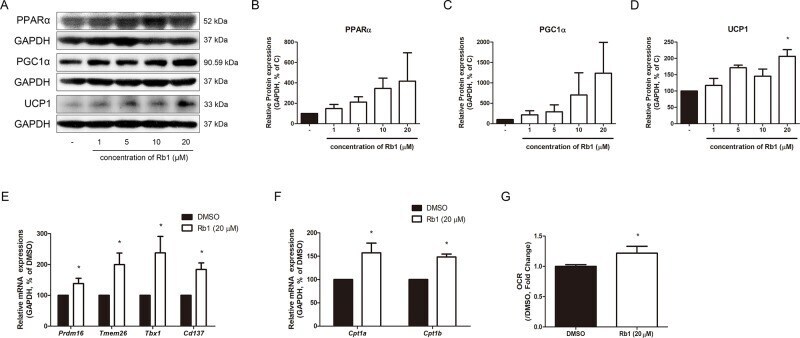
- Fig. 8 FN increases PPARalpha expression and regulates beta-oxidation in human chondrocytes. a. Relative expression of PPARalpha in T/C28a2 human chondrocytes untreated or treated with FN (10, 50 muM) for 24 h. Values are mean +- SEM of 3 independent observations, *p < .05 vs. Ctrl , two-tailed unpaired Student's t-test. b. Western blot and densitometric analysis of PPARalpha expression in human OA primary chondrocytes treated with FN (10, 50 muM) for 24 h. Values are mean +- SEM of 3 human donors, *p < .05 vs. Ctrl , two-tailed unpaired Student's t-test. alpha-tubulin was employed as a loading control. c. Relative expression of ACOX1 in T/C28a2 human chondrocytes untreated or treated with PPARalpha agonists FN, CP and GW (10, 50 muM) for 8 and 24 h. Values are mean +- SEM of 3 independent observations (8 h: *p < .05 vs. Ctrl , two-tailed unpaired Student's t-test; 24 h: *p < .001 vs. Ctrl , two-tailed unpaired Student's t-test). d. Relative expression of CPT1A in T/C28a2 human chondrocytes untreated or treated with PPARalpha agonists FN, CP and GW (10, 50 muM) for 8 and 24 h. Values are mean +- SEM of 3 independent observations (8 h: *p < .05 vs. Ctrl , two-tailed unpaired Student's t-test; 24 h: *p < .01, **p < 0,01, ***p < .001 vs. Ctrl , two-tailed unpaired Student's t-test). Fig. 8