Explore
 Validate
 Learn
Learn Western blot
Antibody data
- Antibody Data
- Antigen structure
- References [6]
- Comments [0]
- Validations
- Western blot [3]
- Immunocytochemistry [3]
- Flow cytometry [1]
Submit
Validation data
Reference
Comment
Report error
- Product number
- PA1-820 - Provider product page

- Provider
- Invitrogen Antibodies
- Product name
- Phospho-PPAR alpha (Ser12) Polyclonal Antibody
- Antibody type
- Polyclonal
- Antigen
- Synthetic peptide
- Description
- PA1-820 detects phospho-peroxisome proliferator activated receptor (PPAR) alpha S12 from mouse tissues. PA1-820 has been successfully used in Western blot procedures. By Western blot, this antibody detects a ~52 kDa protein which corresponds to phospho-PPAR alpha S12 from mouse adipose tissue extract. The PA1-820 immunogen is a synthetic phosphopeptide corresponding to residues I(8) C P L (pS) P L E A D D L(19) of mouse PPAR alpha. This peptide (Cat. # PEP-181) is available for use in neutralization and control experiments.
- Reactivity
- Human, Mouse
- Host
- Rabbit
- Isotype
- IgG
- Vial size
- 100 µg
- Concentration
- 1 mg/mL
- Storage
- -20° C, Avoid Freeze/Thaw Cycles
Submitted references CEPT1-Mediated Phospholipogenesis Regulates Endothelial Cell Function and Ischemia-Induced Angiogenesis Through PPARα.
Downregulation of ROS1 enhances the therapeutic efficacy of arsenic trioxide in acute myeloid leukemia cell lines.
AS601245, an Anti-Inflammatory JNK Inhibitor, and Clofibrate Have a Synergistic Effect in Inducing Cell Responses and in Affecting the Gene Expression Profile in CaCo-2 Colon Cancer Cells.
Dysregulation of the peroxisome proliferator-activated receptor target genes by XPD mutations.
MCF-7 and T47D human breast cancer cells contain a functional peroxisomal response.
MCF-7 and T47D human breast cancer cells contain a functional peroxisomal response.
Zayed MA, Jin X, Yang C, Belaygorod L, Engel C, Desai K, Harroun N, Saffaf O, Patterson BW, Hsu FF, Semenkovich CF
Diabetes 2021 Feb;70(2):549-561
Diabetes 2021 Feb;70(2):549-561
Downregulation of ROS1 enhances the therapeutic efficacy of arsenic trioxide in acute myeloid leukemia cell lines.
Li J
Oncology letters 2018 Jun;15(6):9392-9396
Oncology letters 2018 Jun;15(6):9392-9396
AS601245, an Anti-Inflammatory JNK Inhibitor, and Clofibrate Have a Synergistic Effect in Inducing Cell Responses and in Affecting the Gene Expression Profile in CaCo-2 Colon Cancer Cells.
Cerbone A, Toaldo C, Pizzimenti S, Pettazzoni P, Dianzani C, Minelli R, Ciamporcero E, Roma G, Dianzani MU, Canaparo R, Ferretti C, Barrera G
PPAR research 2012;2012:269751
PPAR research 2012;2012:269751
Dysregulation of the peroxisome proliferator-activated receptor target genes by XPD mutations.
Compe E, Drané P, Laurent C, Diderich K, Braun C, Hoeijmakers JH, Egly JM
Molecular and cellular biology 2005 Jul;25(14):6065-76
Molecular and cellular biology 2005 Jul;25(14):6065-76
MCF-7 and T47D human breast cancer cells contain a functional peroxisomal response.
Kilgore MW, Tate PL, Rai S, Sengoku E, Price TM
Molecular and cellular endocrinology 1997 May 16;129(2):229-35
Molecular and cellular endocrinology 1997 May 16;129(2):229-35
MCF-7 and T47D human breast cancer cells contain a functional peroxisomal response.
Kilgore MW, Tate PL, Rai S, Sengoku E, Price TM
Molecular and cellular endocrinology 1997 May 16;129(2):229-35
Molecular and cellular endocrinology 1997 May 16;129(2):229-35
No comments: Submit comment
Supportive validation
- Submitted by
- Invitrogen Antibodies (provider)
- Main image
- Experimental details
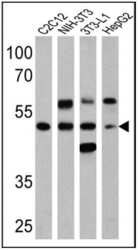
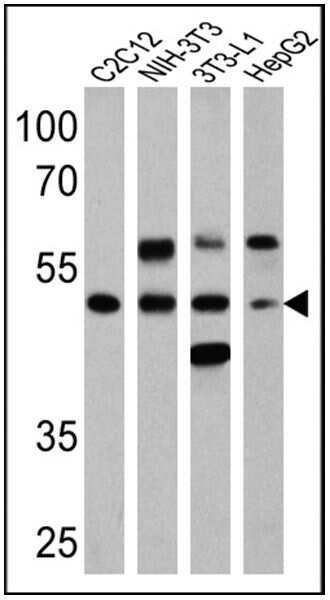
- Western blot analysis of Phospho-PPAR alpha pSer12 was performed by loading 25 µg of C2C12 (lane 1), NIH-3T3 (lane 2), 3T3-L1 (lane 3) and HepG2 (lane 4) cell lysates onto an SDS polyacrylamide gel. Proteins were transferred to a PVDF membrane and blocked at 4ºC overnight. The membrane was probed with a Phospho-PPAR alpha pSer12 polyclonal antibody (Product # PA1-820) at a dilution of 1:200 overnight at 4°C, washed in TBST, and probed with an HRP-conjugated secondary antibody for 1 hr at room temperature in the dark. Chemiluminescent detection was performed using Pierce ECL Plus Western Blotting Substrate (Product # 32132). Results show a band at ~52 kDa.
- Submitted by
- Invitrogen Antibodies (provider)
- Main image

- Experimental details
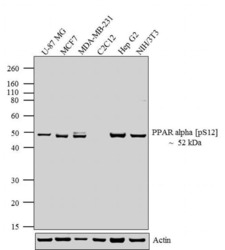
- Western blot analysis was performed on whole cell extracts (20 µg lysate) of U-87 MG (Lane 1), MCF7 (Lane 2), MDA-MB-231 (Lane 3), C2C12 (lane 4), Hep G2 (lane 5) and NIH/3T3 (lane 6). The blots were probed with Anti-PPAR alpha (pS12) Rabbit Polyclonal Antibody (Product # PA1-820, 1:250-1:1000 dilution) and detected by chemiluminescence using Goat anti-Rabbit IgG (H+L) Superclonal™ Secondary Antibody, HRP conjugate (Product # A27036, 0.4 µg/mL, 1:2500 dilution). A 52 kDa band corresponding to PPAR alpha (pS12) was observed across cell lines tested except for C2C12. Known quantity of protein samples were electrophoresed using Novex® NuPAGE® 10 % Bis-Tris gel (Product # NP0301BOX), XCell SureLock™ Electrophoresis System (Product # EI0002) and Novex® Sharp Pre-Stained Protein Standard (Product # LC5800). Resolved proteins were then transferred onto a nitrocellulose membrane with iBlot® 2 Dry Blotting System (Product # IB21001). The membrane was probed with the relevant primary and secondary Antibody following blocking with 5 % skimmed milk. Chemiluminescent detection was performed using Pierce™ ECL Western Blotting Substrate (Product # 32106).

- Submitted by
- Invitrogen Antibodies (provider)
- Main image
- Experimental details
- Western blot analysis was performed on whole cell extracts (20 µg lysate) of U-87 MG (Lane 1), MCF7 (Lane 2), MDA-MB-231 (Lane 3), C2C12 (lane 4), Hep G2 (lane 5) and NIH/3T3 (lane 6). The blots were probed with Anti-PPAR alpha (pS12) Rabbit Polyclonal Antibody (Product # PA1-820, 1:250-1:1000 dilution) and detected by chemiluminescence using Goat anti-Rabbit IgG (H+L) Superclonal™ Secondary Antibody, HRP conjugate (Product # A27036, 0.4 µg/mL, 1:2500 dilution). A 52 kDa band corresponding to PPAR alpha (pS12) was observed across cell lines tested except for C2C12. Known quantity of protein samples were electrophoresed using Novex® NuPAGE® 10 % Bis-Tris gel (Product # NP0301BOX), XCell SureLock™ Electrophoresis System (Product # EI0002) and Novex® Sharp Pre-Stained Protein Standard (Product # LC5800). Resolved proteins were then transferred onto a nitrocellulose membrane with iBlot® 2 Dry Blotting System (Product # IB21001). The membrane was probed with the relevant primary and secondary Antibody following blocking with 5 % skimmed milk. Chemiluminescent detection was performed using Pierce™ ECL Western Blotting Substrate (Product # 32106).

Supportive validation
- Submitted by
- Invitrogen Antibodies (provider)
- Main image
- Experimental details
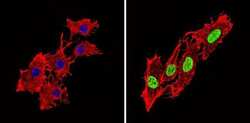
- Immunofluorescent analysis of Phospho-PPAR alpha pSer12 (green) showing staining in the nucleus of 3T3-L1 cells (right) compared to a negative control without primary antibody (left). Formalin-fixed cells were permeabilized with 0.1% Triton X-100 in TBS for 5-10 minutes and blocked with 3% BSA-PBS for 30 minutes at room temperature. Cells were probed with a Phospho-PPAR alpha pSer12 polyclonal antibody (Product # PA1-820) in 3% BSA-PBS at a dilution of 1:200 and incubated overnight at 4 ºC in a humidified chamber. Cells were washed with PBST and incubated with a DyLight-conjugated secondary antibody in PBS at room temperature in the dark. F-actin (red) was stained with a fluorescent red phalloidin and nuclei (blue) were stained with Hoechst or DAPI. Images were taken at a magnification of 60x.

- Submitted by
- Invitrogen Antibodies (provider)
- Main image
- Experimental details
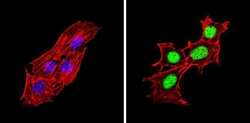
- Immunofluorescent analysis of Phospho-PPAR alpha pSer12 (green) showing staining in the nucleus of C2C12 cells (right) compared to a negative control without primary antibody (left). Formalin-fixed cells were permeabilized with 0.1% Triton X-100 in TBS for 5-10 minutes and blocked with 3% BSA-PBS for 30 minutes at room temperature. Cells were probed with a Phospho-PPAR alpha pSer12 polyclonal antibody (Product # PA1-820) in 3% BSA-PBS at a dilution of 1:200 and incubated overnight at 4 ºC in a humidified chamber. Cells were washed with PBST and incubated with a DyLight-conjugated secondary antibody in PBS at room temperature in the dark. F-actin (red) was stained with a fluorescent red phalloidin and nuclei (blue) were stained with Hoechst or DAPI. Images were taken at a magnification of 60x.

- Submitted by
- Invitrogen Antibodies (provider)
- Main image
- Experimental details
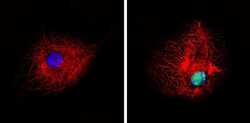
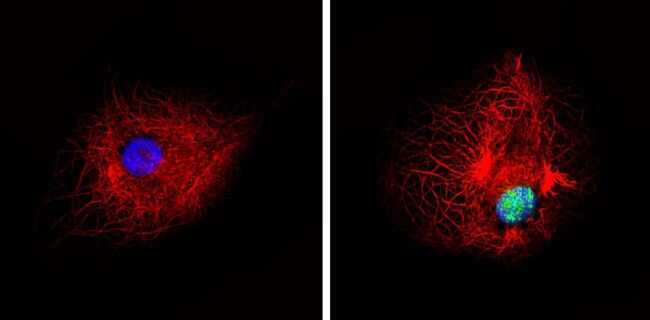
- Immunofluorescent analysis of Phospho-PPAR alpha pSer12 (green) showing staining in the nucleus of U-87 MG cells (right) compared to a negative control without primary antibody (left). Formalin-fixed cells were permeabilized with 0.1% Triton X-100 in TBS for 5-10 minutes and blocked with 3% BSA-PBS for 30 minutes at room temperature. Cells were probed with a Phospho-PPAR alpha pSer12 polyclonal antibody (Product # PA1-820) in 3% BSA-PBS at a dilution of 1:200 and incubated overnight at 4 ºC in a humidified chamber. Cells were washed with PBST and incubated with a DyLight-conjugated secondary antibody in PBS at room temperature in the dark. F-actin (red) was stained with a fluorescent red phalloidin and nuclei (blue) were stained with Hoechst or DAPI. Images were taken at a magnification of 60x.
Supportive validation
- Submitted by
- Invitrogen Antibodies (provider)
- Main image
- Experimental details
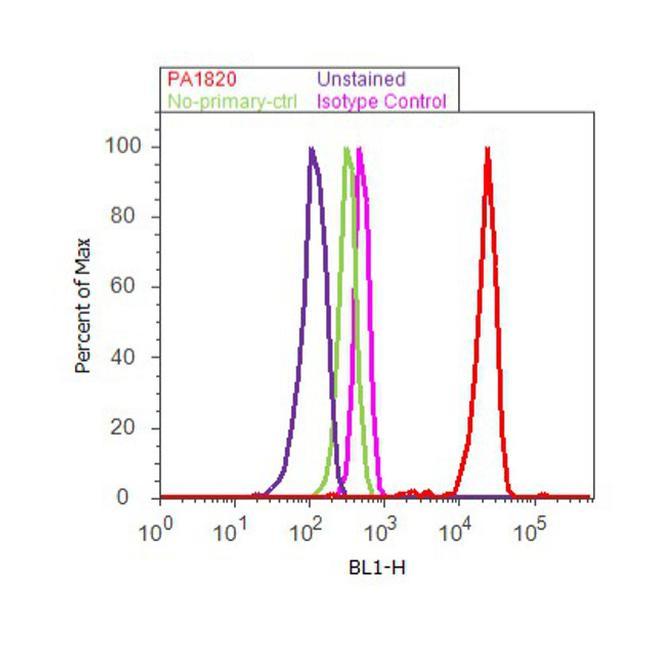
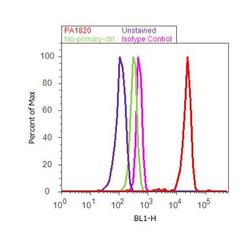
- Flow cytometry analysis of PPAR alpha [pSer12] was done on MCF7 cells. Cells were fixed with 70% ethanol for 10 minutes, permeabilized with 0.25% Triton™ X-100 for 20 minutes, and blocked with 5% BSA for 30 minutes at room temperature. Cells were labeled with PPAR alpha [pSer12] Rabbit Polyclonal Antibody (PA1820, red histogram) or with rabbit isotype control (pink histogram) at 3-5 ug/million cells in 2.5% BSA. After incubation at room temperature for 2 hours, the cells were labeled with Alexa Fluor® 488 Goat Anti-Rabbit Secondary Antibody (A11008) at a dilution of 1:400 for 30 minutes at room temperature. The representative 10,000 cells were acquired and analyzed for each sample using an Attune® Acoustic Focusing Cytometer. The purple histogram represents unstained control cells and the green histogram represents no-primary-antibody control.