Explore
 Validate
 Learn
Learn Western blot
Antibody data
- Antibody Data
- Antigen structure
- References [3]
- Comments [0]
- Validations
- Western blot [3]
- Immunocytochemistry [3]
- Other assay [5]
Submit
Validation data
Reference
Comment
Report error
- Product number
- PA5-22003 - Provider product page

- Provider
- Invitrogen Antibodies
- Product name
- PSPH Polyclonal Antibody
- Antibody type
- Polyclonal
- Antigen
- Recombinant full-length protein
- Description
- Recommended positive controls: 293T, A431, H1299, HeLa, HepG2, Molt-4, Raji. Predicted reactivity: Mouse (93%), Rat (94%), Pig (96%), Chicken (80%), Sheep (93%), Bovine (94%). Store product as a concentrated solution. Centrifuge briefly prior to opening the vial.
- Reactivity
- Human
- Host
- Rabbit
- Isotype
- IgG
- Vial size
- 100 µL
- Concentration
- 1 mg/mL
- Storage
- Store at 4°C short term. For long term storage, store at -20°C, avoiding freeze/thaw cycles.
Submitted references PHGDH is required for germinal center formation and is a therapeutic target in MYC-driven lymphoma.
Genetically Encoded Protein Phosphorylation in Mammalian Cells.
Phosphoglycerate dehydrogenase is dispensable for breast tumor maintenance and growth.
D'Avola A, Legrave N, Tajan M, Chakravarty P, Shearer RL, King HW, Kluckova K, Cheung EC, Clear AJ, Gunawan AS, Zhang L, James LK, MacRae JI, Gribben JG, Calado DP, Vousden KH, Riches JC
The Journal of clinical investigation 2022 May 2;132(9)
The Journal of clinical investigation 2022 May 2;132(9)
Genetically Encoded Protein Phosphorylation in Mammalian Cells.
Beránek V, Reinkemeier CD, Zhang MS, Liang AD, Kym G, Chin JW
Cell chemical biology 2018 Sep 20;25(9):1067-1074.e5
Cell chemical biology 2018 Sep 20;25(9):1067-1074.e5
Phosphoglycerate dehydrogenase is dispensable for breast tumor maintenance and growth.
Chen J, Chung F, Yang G, Pu M, Gao H, Jiang W, Yin H, Capka V, Kasibhatla S, Laffitte B, Jaeger S, Pagliarini R, Chen Y, Zhou W
Oncotarget 2013 Dec;4(12):2502-11
Oncotarget 2013 Dec;4(12):2502-11
No comments: Submit comment
Supportive validation
- Submitted by
- Invitrogen Antibodies (provider)
- Main image
- Experimental details
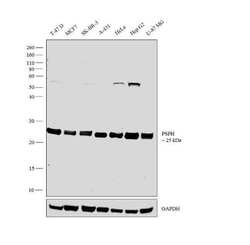
- Western blot analysis was performed on whole cell extracts (30 µg lysate) of T-47 D (Lane 1), MCF7 (Lane 2), SK-BR-3 (Lane 3), A-431 (Lane 4), HeLa (Lane 5), Hep G2 (Lane 6) and U-87 MG (Lane 7). The blot was probed with Anti-PSPH Polyclonal Antibody (Product # PA5-22003, 1:1000 dilution) and detected by chemiluminescence using Goat anti-Rabbit IgG (H+L) Superclonal™ Secondary Antibody, HRP conjugate (Product # A27036, 0.25 µg/ml, 1:4000 dilution). A 25 kDa band corresponding to PSPH was observed across the cell lines tested.

- Submitted by
- Invitrogen Antibodies (provider)
- Main image
- Experimental details
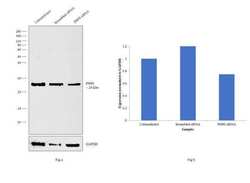
- Knockdown of PSPH was achieved by transfecting T-47 D cells with PSPH specific siRNAs (Silencer® select Product # s11429). Western blot analysis (Fig. a) was performed using whole cell extracts from the PSPH knockdown cells (lane 3), non-specific scrambled siRNA transfected cells (lane 2) and un-transfected cells (lane 1). The blots were probed with PSPH Polyclonal Antibody (Product # PA5-22003, 1:1000 dilution) and Goat anti-Rabbit IgG (H+L) Superclonal™ Secondary Antibody, HRP conjugate (Product # A27036, 0.25µg/ml, 1:4000 dilution). Densitometry analysis of this western blot is shown in histogram (Fig b). Decrease in signal upon siRNA mediated knock down confirms that antibody is specific to PSPH.

- Submitted by
- Invitrogen Antibodies (provider)
- Main image
- Experimental details
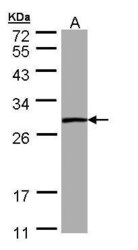
- Western Blot using PSPH Polyclonal Antibody (Product # PA5-22003). Sample (30 µg of whole cell lysate). A: A431. 12% SDS PAGE. PSPH Polyclonal Antibody (Product # PA5-22003) diluted at 1:1,000.

Supportive validation
- Submitted by
- Invitrogen Antibodies (provider)
- Main image

- Experimental details
- Immunofluorescent analysis of PSPH in paraformaldehyde-fixed HeLa cells using a PSPH polyclonal antibody (Product # PA5-22003) at a 1:200 dilution.

- Submitted by
- Invitrogen Antibodies (provider)
- Main image

- Experimental details
- Immunofluorescence analysis of paraformaldehyde-fixed HeLa, using PSPH antibody (Product # PA5-22003) at 1:200 dilution.

- Submitted by
- Invitrogen Antibodies (provider)
- Main image

- Experimental details
- Immunofluorescence analysis of PSPH was performed using 70% confluent log phase Hep G2 cells. The cells were fixed with 4% paraformaldehyde for 10 minutes, permeabilized with 0.1% Triton™ X-100 for 15 minutes, and blocked with 1% BSA for 1 hour at room temperature. The cells were labeled with PSPH Polyclonal Antibody (Product # PA5-22003) at 1:100 dilution in 0.1% BSA, incubated at 4 degree celsius overnight and then labeled with Goat anti-Rabbit IgG (H+L) Superclonal™ Secondary Antibody, Alexa Fluor® 488 conjugate (Product # A27034) at a dilution of 1:2000 for 45 minutes at room temperature (Panel a: green).Nuclei (Panel b: blue) were stained with SlowFade® Gold Antifade Mountant with DAPI (Product # S36938). F-actin (Panel c: red) was stained with Rhodamine Phalloidin (Product # R415, 1:300). Panel d represents the merged image showing predominant cytosolic localization. Panel e represents control cells with no primary antibody to assess background. The images were captured at 60X magnification.

Supportive validation
- Submitted by
- Invitrogen Antibodies (provider)
- Main image
- Experimental details
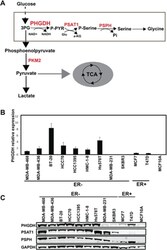
- Fig 1 PHGDH shows a differential expression pattern among human breast cancer cell lines A. The schematic of diversion of glucose metabolism into serine and glycine metabolism through PHGDH . B. The mRNA levels of PHGDH were measured among different human breast cancer cell lines. Total RNA was isolated and real-time PCR analysis was performed. Taqman probe of target gene and B2M transcripts were coamplified. The mRNA expressions of target genes were normalized to B2M levels. All experiments were performed in triplicate. C. Western blotting analysis of human breast cancer cells. Cancer cell samples were collected from different human breast cancer cell lines. The protein lysates were prepared and western blotting analysis of PHGDH , PSAT1, PSPH and GAPDH were performed.
- Submitted by
- Invitrogen Antibodies (provider)
- Main image

- Experimental details
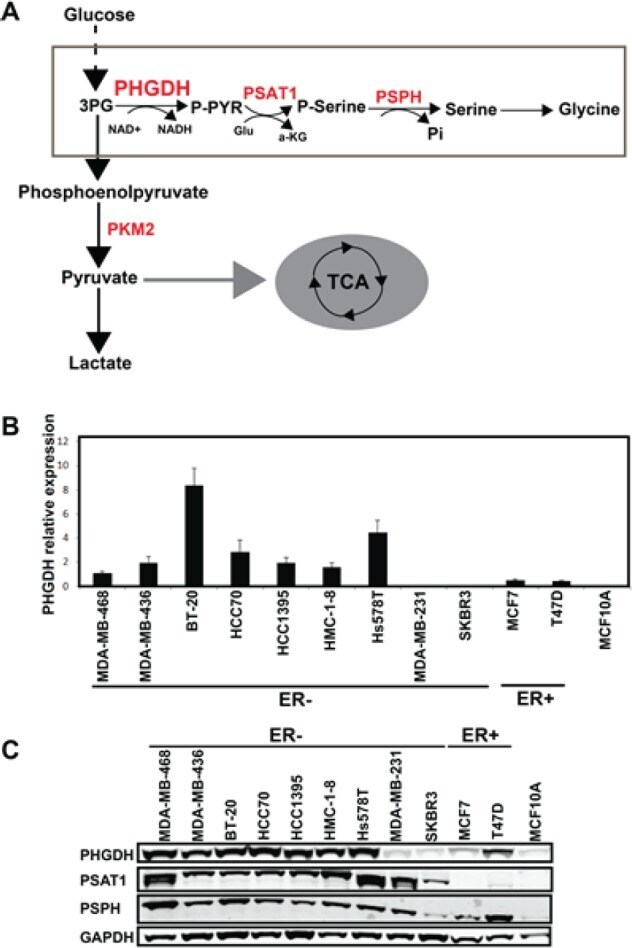
- Upregulation of the SSP is a metabolic hallmark of GC B cells. ( A ) Uniform Manifold Approximation and Projection (UMAP) of tonsillar B cell single-cell RNA clusters (including naive, activated, pre-GC, total GC, plasmablasts, memory [MBC], and cycling B cells) (left). Expression of SSP-network genes in B cell subsets (right). ( B ) Analysis of PHGDH, PSAT1 and PSPH protein levels in human naive B cells isolated from blood bank volunteers by immunoblotting ( n = 6). MDA-MB-231 and MDA-MB-468 cell lines were used as control for low and high SSP-enzyme expression, respectively. ( C ) Quantification of specific transcript levels relative to beta-actin mRNA levels. ( D ) Representative immunoblot of PHGDH, PSAT1, and PSPH in resting and activated human naive B cells. Human B cells were left unstimulated (-) or stimulated (+) with anti-IgM/G antibody, CD40 ligand (CD40L), and IL-4 for 3, 24, and 48 hours. ( E ) Quantification of protein levels shown in D normalized to HSC70. ( F ) Relative mRNA expression of SSP enzyme genes in resting and activated human B cells determined by qPCR. Isolated human B cells were left unstimulated (-) or stimulated with (+) with anti-IgM/G antibody, CD40L, and IL-4 for 3, 24, and 48 hours before mRNA extraction. Transcript levels were determined relative to beta-actin mRNA levels ( n = 4). ( G and H ) Representative IHC staining for PHGDH and PSAT1 in germinal center (GC) and mantle zone (MZ) areas in sequential sections of human reactive tonsils (x
- Submitted by
- Invitrogen Antibodies (provider)
- Main image
- Experimental details
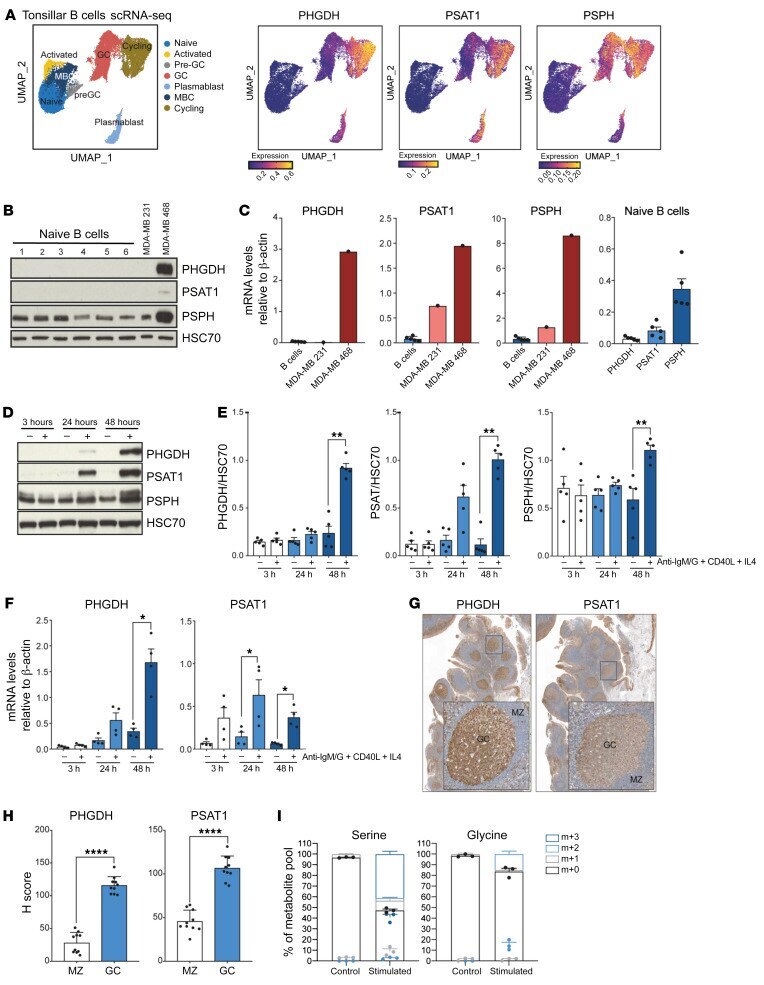
- Characterization of the SSP in WT mice after activation in vivo. ( A ) Analysis of PHGDH, PSAT1, and PSPH protein levels in resting B cells isolated from mouse spleen (SPL), peripheral blood (PB), and lymph nodes (LN). NIH3T3 murine cells were used as control for high expression of SSP-related enzymes. ( B ) Representative IHC staining for PNA as GC marker, PHGDH, and PSAT1 on consecutive spleen sections derived from mouse spleens 8 days after sheep RBC immunization (x5 magnification). ( C ) Expression of PHGDH and PSAT1 in GC B cells and non-GC B cells harvested from mouse spleen 8 days after immunization with sheep RBC. ( D ) Representative immunoblots of PHGDH, PSAT1, and PSPH proteins levels in murine resting and activated B cells. ( E ) Mouse B cells were isolated from spleen and left unstimulated (-) or stimulated (+) with anti-IgM/G antibody, CD40L, and IL-4 for 24 hours before protein extraction and quantification of protein levels normalized to HSC70. Individual samples (dots) and means (bars) values are plotted ( n = 4). ( F ) Relative mRNA expression of SSP enzyme genes in resting and activated mouse B cells as determined by qPCR. Isolated mouse B cells were left unstimulated or stimulated with anti-IgM/G antibody, CD40L, and IL-4 for 24 and 48 hours before mRNA extraction. Specific transcript levels were determined relative to beta-actin mRNA levels ( n = 4). ( G ) Mass isotopologue distribution of U-[ 13 C 6 ]-glucose-derived serine and glycine from murine restin

- Submitted by
- Invitrogen Antibodies (provider)
- Main image
- Experimental details
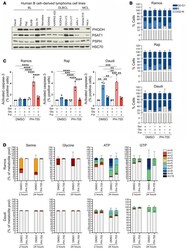
- Figure 6 PHGDH inhibition impairs proliferation and promotes apoptosis in Burkitt lymphoma cells. ( A ) Western blot analysis of PHGDH, PSAT1, and PSPH protein expression in B cell-derived lymphoma cell lines (mantle cell lymphoma [MCL]). Representative of 3 independent experiments. HSC70 was used as loading control. ( B ) Cell cycle profile of Ramos (top), Raji (center), and Daudi (bottom) cells. Cells were plated either in complete medium or equivalent medium lacking serine and glycine supplemented or not with 0.5 mM sodium formate and 0.4 mM glycine and treated with DMSO (as a solvent control) or 10 muM PH-755, followed by incubation with 10 muM BrdU and by staining with anti-BrdU and 7-ADD. Data are presented as mean +- SEM and are representative of 3 independent experiments, with value for DMSO-treated cells and cultured in complete medium set to 1.0. ( C ) Ramos (left), Raji (center), and Daudi (right) cells were cultured in the same conditions specified in B for 48 hours. Cells were then permeabilized, fixed, and stained for active Caspase-3. Positive cells for active Caspase-3 were analyzed by flow cytometry. Graph shows the mean derived from 3 independent experiments, with value for DMSO-treated cells and cultured in complete medium set to 1.0. Data are shown as the mean +- SEM. ** P < 0.01, *** P < 0.001, and **** P < 0.0001, by 1-way ANOVA with Tukey's post hoc test. ( D ) Mass isotopologue distribution of U-[ 13 C 6 ]-glucose-derived serine and glycine for Ramos (
- Submitted by
- Invitrogen Antibodies (provider)
- Main image
- Experimental details
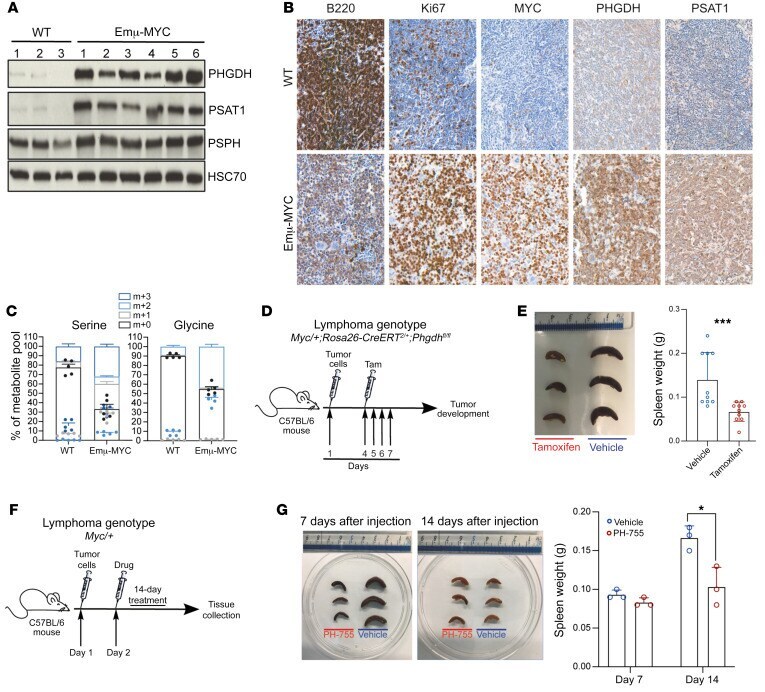
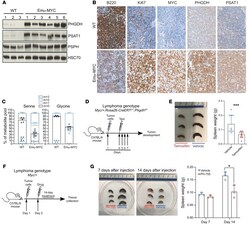
- Genetic loss and pharmacological inhibition of PHGDH reduces lymphoma progression in vivo. ( A ) Immunoblot of PHGDH, PSAT1, and PSPH expression in splenic B cells from WT ( n = 3) and Emu-Myc mice ( n = 6). HSC70 was used as loading control. ( B ) Representative IHC staining (x20 magnification) for B220, Ki67, MYC, PHGDH, and PSAT1 abundance in sections of spleens from either WT ( n = 3) or Emu-Myc ( n = 3) mice. ( C ) Isotope tracing analysis in splenic B cells isolated from either C57BL/6J WT mice or Emu-MYC mice and cultured for 2 hours with 13 C 6 -labeled glucose. Serine and glycine levels were measured by LC-MS. The percent distribution of each isotopologue of their respective metabolite pool is represented as mean +- SEM of triplicate cultures and is representative of 3 independent experiments. ( D ) Schematic showing lymphoma transplantation model, in which Myc/+;Rosa26-CreER T2/+ ;Phgdh fl/fl lymphoma cells are injected via the tail vein into 9-week-old male C57BL/6J mice. Three days after lymphoma engraftment, mice were randomized to receive either vehicle or tamoxifen treatment by oral gavage for 4 days. Samples were collected 20 days after injection. ( E ) Representative pictures of spleens from mice ( n = 3 per group) sacrificed 20 days after transplantation (left), and quantification of the spleen weight (right). ( F ) Schematic showing lymphoma transplantation model, in which Myc/+ lymphoma cells are injected via the tail vein into 9-week-old male C57BL/6J mic