Explore
 Validate
 Learn
Learn Flow cytometry
Antibody data
- Antibody Data
- Antigen structure
- References [3]
- Comments [0]
- Validations
- Flow cytometry [1]
- Other assay [3]
Submit
Validation data
Reference
Comment
Report error
- Product number
- 46-1178-42 - Provider product page

- Provider
- Invitrogen Antibodies
- Product name
- CD117 (c-Kit) Monoclonal Antibody (104D2), PerCP-eFluor™ 710, eBioscience™
- Antibody type
- Monoclonal
- Antigen
- Other
- Description
- Description: The 104D2 monoclonal antibody reacts with human CD117, also known as c-Kit, Steel factor receptor and stem cell factor receptor. A member of the tyrosine kinase receptor family, this 145 kDa molecule is expressed by hematopoietic progenitor cell subsets and mast cells. The interaction of c-Kit and Steel factor promotes proliferation and differentiation of hematopoietic progenitor cells and mast cell differentiation. CD117 is also expressed by melanocytes and plays a role in signaling and activation of these cells. Applications Reported: This 104D2 antibody has been reported for use in flow cytometric analysis. Applications Tested: This 104D2 antibody has been pre-titrated and tested by flow cytometric analysis of normal human peripheral blood cells. This can be used at 5 µL (0.25 µg) per test. A test is defined as the amount (µg) of antibody that will stain a cell sample in a final volume of 100 µL. Cell number should be determined empirically but can range from 10^5 to 10^8 cells/test. PerCP-eFluor® 710 emits at 710 nm and is excited with the blue laser (488 nm); it can be used in place of PerCP-Cyanine5.5. We recommend using a 710/50 bandpass filter, however, the 695/40 bandpass filter is an acceptable alternative. Please make sure that your instrument is capable of detecting this fluorochrome. Fixation: Samples can be stored in IC Fixation Buffer (Product # 00-822-49) (100 µL cell sample + 100 µL IC Fixation Buffer) or 1-step Fix/Lyse Solution (Product # 00-5333-54) for up to 3 days in the dark at 4°C with minimal impact on brightness and FRET efficiency/compensation. Some generalizations regarding fluorophore performance after fixation can be made, but clone specific performance should be determined empirically. Excitation: 488 nm; Emission: 710 nm; Laser: Blue Laser. Filtration: 0.2 µm post-manufacturing filtered.
- Reactivity
- Human
- Host
- Mouse
- Isotype
- IgG
- Antibody clone number
- 104D2
- Vial size
- 100 Tests
- Concentration
- 5 µL/Test
- Storage
- 4° C, store in dark, DO NOT FREEZE!
Submitted references Chemically-Defined, Xeno-Free, Scalable Production of hPSC-Derived Definitive Endoderm Aggregates with Multi-Lineage Differentiation Potential.
Bacillus anthracis lethal toxin negatively modulates ILC3 function through perturbation of IL-23-mediated MAPK signaling.
PPAR-α and glucocorticoid receptor synergize to promote erythroid progenitor self-renewal.
Sahabian A, Sgodda M, Naujok O, Dettmer R, Dahlmann J, Manstein F, Cantz T, Zweigerdt R, Martin U, Olmer R
Cells 2019 Dec 4;8(12)
Cells 2019 Dec 4;8(12)
Bacillus anthracis lethal toxin negatively modulates ILC3 function through perturbation of IL-23-mediated MAPK signaling.
Seshadri S, Allan DSJ, Carlyle JR, Zenewicz LA
PLoS pathogens 2017 Oct;13(10):e1006690
PLoS pathogens 2017 Oct;13(10):e1006690
PPAR-α and glucocorticoid receptor synergize to promote erythroid progenitor self-renewal.
Lee HY, Gao X, Barrasa MI, Li H, Elmes RR, Peters LL, Lodish HF
Nature 2015 Jun 25;522(7557):474-7
Nature 2015 Jun 25;522(7557):474-7
No comments: Submit comment
Supportive validation
- Submitted by
- Invitrogen Antibodies (provider)
- Main image
- Experimental details
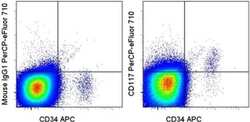
- Staining of normal human peripheral blood cells with Anti-Human CD34 APC (Product # 17-0349-42) and Mouse IgG1 K Isotype Control PerCP-eFluor® 710 (Product # 46-4714-82) (left) or Anti-Human CD117 (c-Kit) PerCP-eFluor® 710 (right). Cells in the lymphocyte gate were used for analysis.

Supportive validation
- Submitted by
- Invitrogen Antibodies (provider)
- Main image
- Experimental details
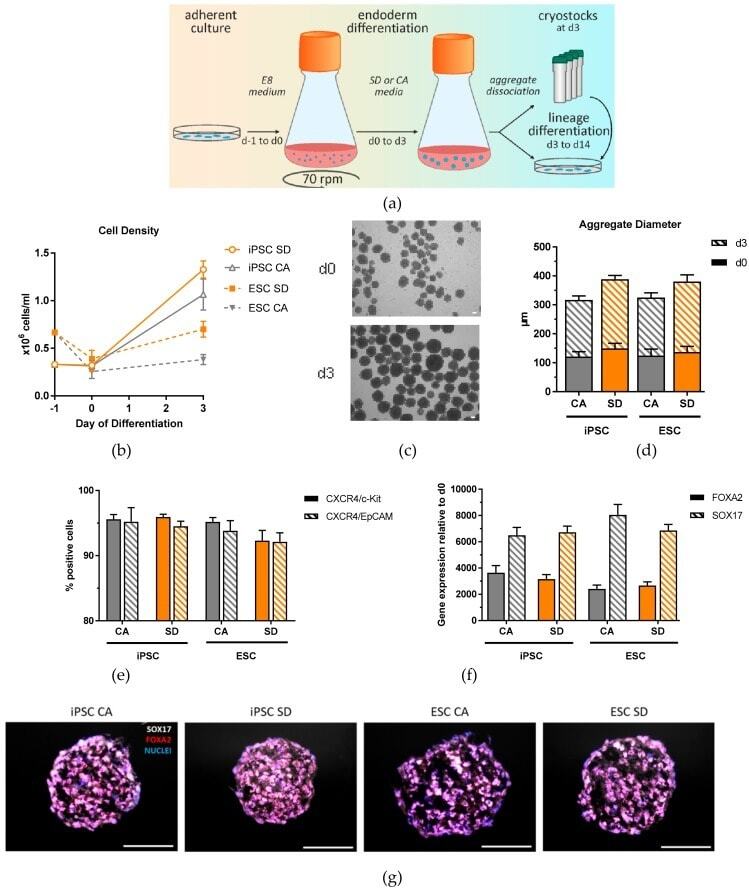
- Figure 1 Generation and characterization of DE aggregates in Erlenmeyer flasks. ( a ) Schematic overview of definitive endoderm differentiation in suspension. ( b ) Cell density analyzed at day 0 and day 3 of differentiation (n = 4-6). ( c ) Representative brightfield image of iPSC aggregates at day 0 and day 3 of differentiation (n = 4-6). ( d ) Aggregate diameters measured at day 0 and day 3 of differentiation. ( e ) Definitive endoderm efficiency quantification based on flow cytometry analysis of CXCR4/c-Kit and CXCR4/EpCAM double positive cells at day 3 of differentiation (n = 12-15). ( f ) qRT-PCR analysis of FOXA2 and SOX17 expression at day 3 of differentiation (n = 6-9). ( g ) Immunostaining of SOX17 (white) and FOXA2 (red), and nuclear stain DAPI (blue) of DE aggregates at day 3 of differentiation (n = 3). Scale bar, 100 mum. Each value of gene expression was first normalized to the reference genes and then to day 0 undifferentiated cells. Values are represented as the mean +- SEM. All n values correspond to independent experiments.
- Submitted by
- Invitrogen Antibodies (provider)
- Main image
- Experimental details
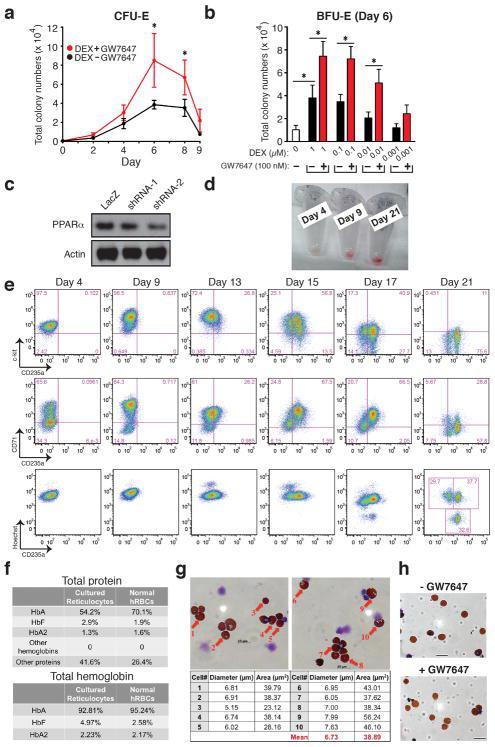
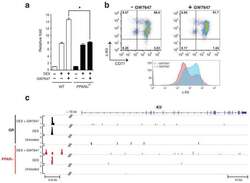
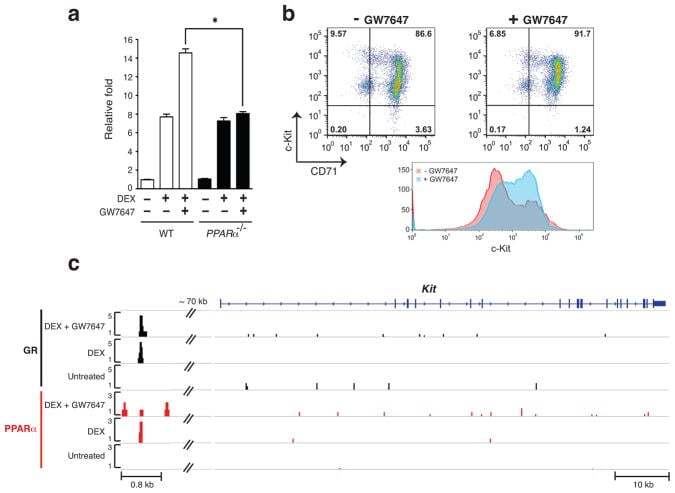
- Extended Figure 7 a, Real-time RT-PCR analysis of Kit gene expression in wild-type and PPARalpha -/- mouse BFU-E cells untreated or treated with DEX with or without addition of GW7647 (* p < 0.05; Student t test. Error bars represent mean +- S.D. from three independent experiments.); b , Human CD34+ cells were treated with or without GW7647 as described in the legend to Figure 2 . (top) At day 9 of culture, cell surface KIT and CD71 expression were analyzed by flow cytometry. (bottom) A representative histogram of KIT expression in cells treated or untreated with GW7647; c , ChIP-Seq occupancy signal map of GR and PPARalpha across the Kit locus in BFU-E cells.
- Submitted by
- Invitrogen Antibodies (provider)
- Main image

- Experimental details
- Extended Figure 2 Human CD34 + Erythroid Differentiation System a , Total CFU-E colonies formed during day 0-9. CFU-E colony numbers were quantified by plating 1000 cells from various time points during day 0-9 of the human CD34 + erythroid culture on methylcellulose. CFU-E colonies were quantified after 12-14 days. Total CFU-E colony numbers in culture under conditions without GW7647 (black line) or with GW7647 (red line) were calculated using the total cell numbers at corresponding time points in Figure 2a. b , Human CD34+ cells were treated at day 1 with 100 nM GW7647 with or without DEX at the concentration indicated in the figure. At day 6, total cell numbers were counted and cells were collected for BFU-E colony assays. c , Protein expression of PPARalpha demonstrating shRNA knock-down efficiency via lentiviral transduction. LacZ shRNA is used as a control. shRNA-1 and -2 are both specific for PPARalpha . shRNA-2 has higher knock-down efficiency. d , Cell pellets of 1 million cells demonstrating hemoglobin accumulation during the differentiation process. e , Flow cytometry analyses of erythroid markers during the 21-day human CD34 + erythroid culture. (top row) c-kit vs. CD235a; (middle row) CD71 vs. CD235a. Note the sequential induction of c-kit, CD71 and CD235a, as well as the sequential down-regulation of c-kit and CD71, (bottom row) Enucleated reticulocytes are CD235a + Hoechst - , nuclei are CD235a - Hoechst + , and nucleated erythroblasts are CD235a + Hoechst + .