Explore
 Validate
 Learn
Learn Western blot
 Other assay
Antibody data
- Antibody Data
- Antigen structure
- References [1]
- Comments [0]
- Validations
- Other assay [1]
Submit
Validation data
Reference
Comment
Report error
- Product number
- PA5-70914 - Provider product page

- Provider
- Invitrogen Antibodies
- Product name
- P2Y10 Polyclonal Antibody
- Antibody type
- Polyclonal
- Antigen
- Synthetic peptide
- Description
- This target displays homology in the following species: Human: 100%; Mouse: 86%; Rat: 100%
- Reactivity
- Human
- Host
- Rabbit
- Isotype
- IgG
- Vial size
- 100 μL
- Concentration
- 0.5 mg/mL
- Storage
- -20°C, Avoid Freeze/Thaw Cycles
Submitted references G-protein-coupled receptor P2Y10 facilitates chemokine-induced CD4 T cell migration through autocrine/paracrine mediators.
Gurusamy M, Tischner D, Shao J, Klatt S, Zukunft S, Bonnavion R, Günther S, Siebenbrodt K, Kestner RI, Kuhlmann T, Fleming I, Offermanns S, Wettschureck N
Nature communications 2021 Nov 23;12(1):6798
Nature communications 2021 Nov 23;12(1):6798
No comments: Submit comment
Supportive validation
- Submitted by
- Invitrogen Antibodies (provider)
- Main image
- Experimental details
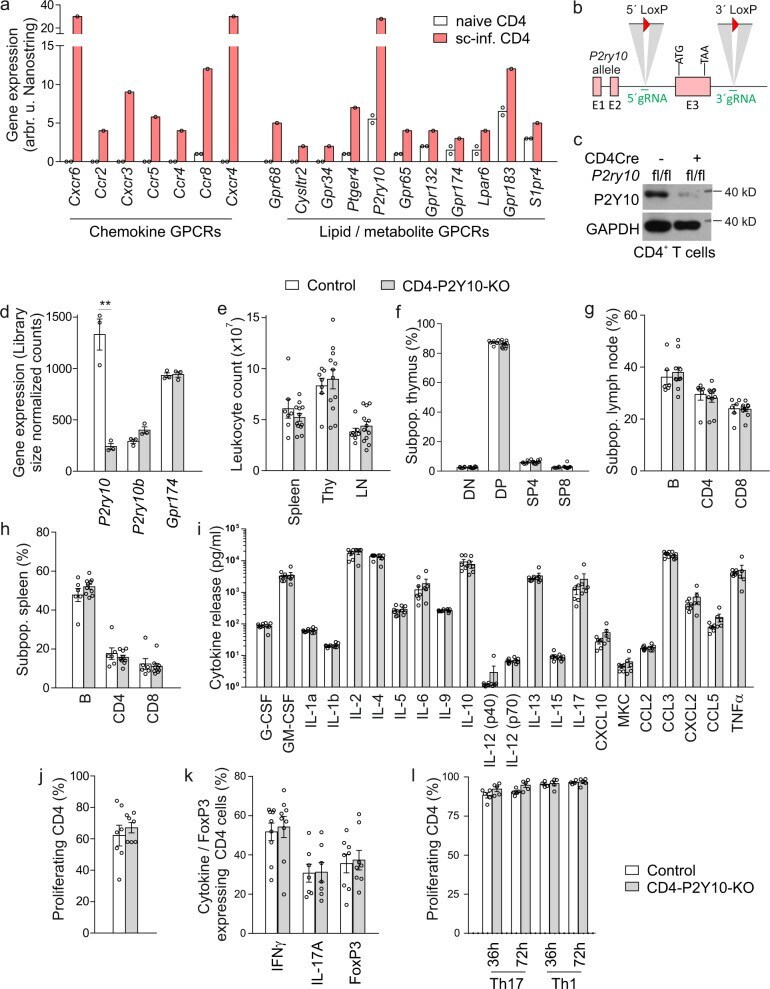
- Fig. 1 Generation and basal characterization of CD4-P2Y10-KOs. a Expression of selected GPCRs for chemokines or lipids and metabolites in naive and spinal cord-infiltrating CD4 T cells was determined by Nanostring mRNA quantification (naive CD4: splenic CD4 T cells from two healthy mice; sc-inf. CD4: spinal cord-infiltrating CD4 T cells pooled from four individual mice at EAE day 14). b Design of the floxed P2Y10 allele. c , d Reduction of P2Y10 expression in CD4 T cells from control and CD4-P2Y10-KO mice was judged by immunoblotting ( c , GAPDH as loading control) and RNA sequencing in isolated splenic CD4 T cells ( d , n = 3; ** p = 0.0021). Total leukocyte numbers ( e ) and proportion of lymphocyte populations in thymus ( f ), inguinal lymph nodes ( g ), or spleen ( h ) ( n = 6-12). Cytokine production ( i , n = 5-6) and proliferation ( j , n = 7) in CD3/CD28-activated CD4 T cells. Percentage of IFNgamma/ IL-17A/FoxP3-expressing cells ( k , n = 7-9) and proliferating cells ( l , n = 4-5) after Th1 and Th17 differentiation, respectively. Data are means +- SEM (in ( a ) only means); comparisons between genotypes were performed using two-tailed unpaired Student's t-test. n , number of mice per group.