Explore
 Validate
 Learn
Learn Western blot
 Other assay
Antibody data
- Antibody Data
- Antigen structure
- References [2]
- Comments [0]
- Validations
- Other assay [3]
Submit
Validation data
Reference
Comment
Report error
- Product number
- PA5-45906 - Provider product page

- Provider
- Invitrogen Antibodies
- Product name
- INPP5A Polyclonal Antibody
- Antibody type
- Polyclonal
- Antigen
- Synthetic peptide
- Description
- Peptide sequence: VVKLIFRESD NDRKVMLQLE KKLFDYFNQE VFRDNNGTAL LEFDKELSVF Sequence homology: Cow: 100%; Dog: 100%; Guinea Pig: 93%; Horse: 100%; Human: 100%; Mouse: 93%; Pig: 100%; Rat: 93%
- Reactivity
- Human
- Host
- Rabbit
- Isotype
- IgG
- Vial size
- 100 μL
- Concentration
- 0.5 mg/mL
- Storage
- -20°C, Avoid Freeze/Thaw Cycles
Submitted references Deficiency of TRIM32 Impairs Motor Function and Purkinje Cells in Mid-Aged Mice.
Cerebellum-enriched protein INPP5A contributes to selective neuropathology in mouse model of spinocerebellar ataxias type 17.
Zhu JW, Jia WQ, Zhou H, Li YF, Zou MM, Wang ZT, Wu BS, Xu RX
Frontiers in aging neuroscience 2021;13:697494
Frontiers in aging neuroscience 2021;13:697494
Cerebellum-enriched protein INPP5A contributes to selective neuropathology in mouse model of spinocerebellar ataxias type 17.
Liu Q, Huang S, Yin P, Yang S, Zhang J, Jing L, Cheng S, Tang B, Li XJ, Pan Y, Li S
Nature communications 2020 Feb 27;11(1):1101
Nature communications 2020 Feb 27;11(1):1101
No comments: Submit comment
Supportive validation
- Submitted by
- Invitrogen Antibodies (provider)
- Main image
- Experimental details
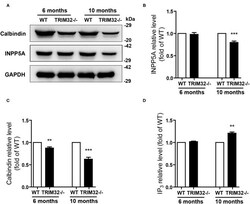
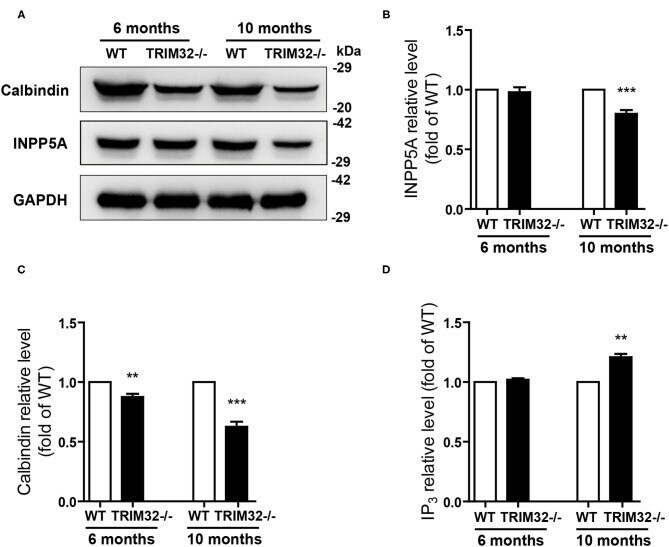
- Figure 7 Deficiency of TRIM32 changes levels of INPP5A and IP 3 . (A) Western blot analysis of levels of INPP5A and calbindin in TRIM32 - /- mice and their littermates. (B, C) Relative levels of INPP5A (B) and calbindin (C) were quantified. (D) ELISA assay analysis of level of IP 3 . Data are presented as mean +- SEM. n = 5 mice/genotype. ** p < 0.01, *** p < 0.001.
- Submitted by
- Invitrogen Antibodies (provider)
- Main image

- Experimental details
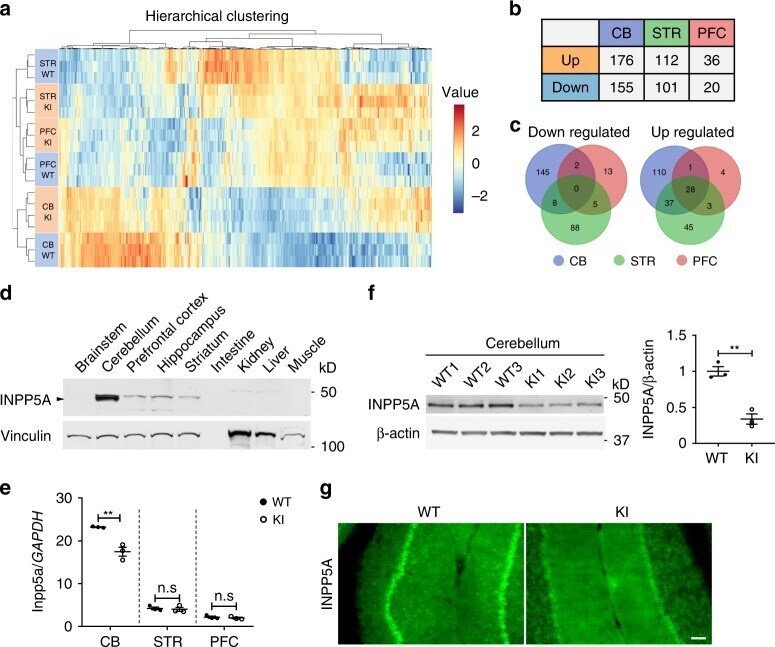
- Fig. 4 Cerebellum-enriched INPP5A is downregulated in SCA17 knock-in mice. a Heatmaps of dysregulated genes hierarchically clustered from the cerebellum (CB), striatum (STR), and prefrontal cortex (PFC) of 3-month-old SCA17 KI and age-matched WT mice ( n = 3-4 mice per group). Data were presented as log2 fold change with adjusted P value < 0.05. b Summary of the numbers of differentially expressed genes in the CB, STR, and PFC in KI mice. c Venn diagrams indicating the numbers of downregulated or upregulated genes in the CB, STR, and PFC. d Western blotting of INPP5A levels in different tissues from 3-month-old WT mice. Vinculin was used as a loading control. e Real-time PCR assay of Inpp5a mRNA levels in the CB, STR, and PFC from 3-month-old KI mice. The relative mRNA levels of Inpp5a were obtained by normalizing values to an internal control, GAPDH , and analyzed with Student's t test, t = 5.493, ** P = 0.0054, n = 3 mice per group. f , g Western blotting ( f ) and immunofluorescent staining ( g ) of INPP5A in the cerebellum from 3-month-old WT and KI mice. Scale bar = 100 mum. In f , densitometric ratios of NeuN to beta-actin were normalized to WT and analyzed with Student's t test, t = 6.903, ** P = 0.0023, n = 3 mice per group. Data are represented as mean +- SEM. Source data and full blots are provided as a Source Data file.
- Submitted by
- Invitrogen Antibodies (provider)
- Main image
- Experimental details
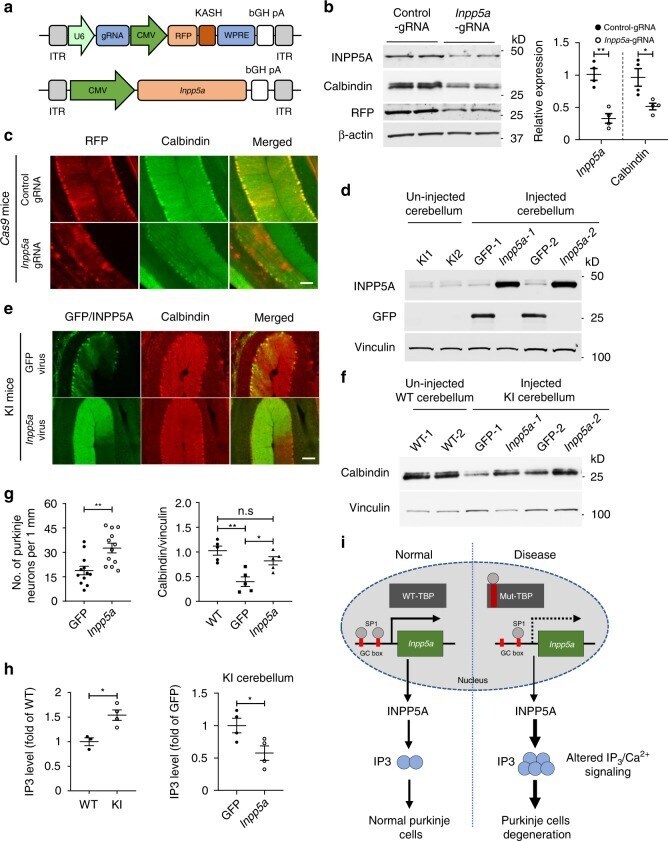
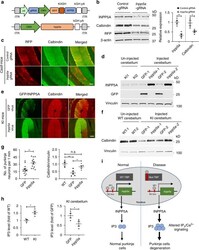
- Inpp5a Knockdown leads to Purkinje cell degeneration, whereas Inpp5a overexpression reduces Purkinje cell degeneration. a Schematic diagram of AAV-Inpp5a gRNA and AAV-Inpp5a vectors. b Western blotting analysis of INPP5A and calbindin in AAV-control gRNA or AAV-Inpp5a gRNA-injected 3-month-old EIIa-Cas9 transgenic mice cerebellum (left panel). The densitometric ratios of INPP5A to ß-actin and calbindin to ß-actin were normalized to control and analyzed with Student’s t test (right panel). Calbindin, t= 3.095, *P= 0.0213; Inpp5a, t= 5.79, **P= 0.0012, n= 4 mice per group. c Representative immunofluorescence images of AAV-gRNA-injected Cas9 mouse cerebellum without mutant TBP. d Western blotting showing the expression of AAV-Inpp5a or AAV-GFP in the injected KI mouse cerebellum. e Representative immunofluorescence images of AAV-Inpp5a or AAV-GFP-injected 5-month-old KI mouse cerebellum. f Western blotting showing increased calbindin in the cerebellum of SCA17 mice after injection of AAV-Inpp5a. AAV-GFP injection served as control. g Quantification of Purkinje cells (left panel) in e was analyzed with Student’s t test, t= 3.483, *P= 0.0011, n= 4 mice per group, three images were used to count from each mouse. The densitometric ratios of calbindin to vinculin in f were normalized to WT and analyzed with one-way ANOVA followed with Tukey’s multiple comparisons test. F= 12.32, *P< 0.05, **P< 0.005. n= 5 mice per group. h IP3 ELISA assay of cerebellar lysates from 2-mont