Explore
 Validate
 Learn
Learn Western blot
 Immunocytochemistry
Antibody data
- Antibody Data
- Antigen structure
- References [1]
- Comments [0]
- Validations
- Immunocytochemistry [2]
- Immunohistochemistry [2]
- Other assay [2]
Submit
Validation data
Reference
Comment
Report error
- Product number
- PA5-79048 - Provider product page

- Provider
- Invitrogen Antibodies
- Product name
- CIS Polyclonal Antibody
- Antibody type
- Polyclonal
- Antigen
- Synthetic peptide
- Description
- Reconstitute with 0.2 mL of distilled water to yield a concentration of 500 µg/mL. Positive Control - WB: human MCF-7 whole cell, human Hela whole cell, human COLO320 whole cell, human CACO-2 whole cell. IHC: Human Lung Cancer Tissue, Rat Kidney Tissue. ICC/IF: U2OS cells.
- Reactivity
- Human, Mouse, Rat
- Host
- Rabbit
- Isotype
- IgG
- Vial size
- 100 μg
- Concentration
- 500 μg/mL
- Storage
- -20°C
Submitted references Identification of a MicroRNA-E3 Ubiquitin Ligase Regulatory Network for Hepatocyte Death in Alcohol-Associated Hepatitis.
Fan X, Wu J, Poulsen KL, Kim A, Wu X, Huang E, Miyata T, Sanz-Garcia C, Nagy LE
Hepatology communications 2021 May;5(5):830-845
Hepatology communications 2021 May;5(5):830-845
No comments: Submit comment
Supportive validation
- Submitted by
- Invitrogen Antibodies (provider)
- Main image

- Experimental details
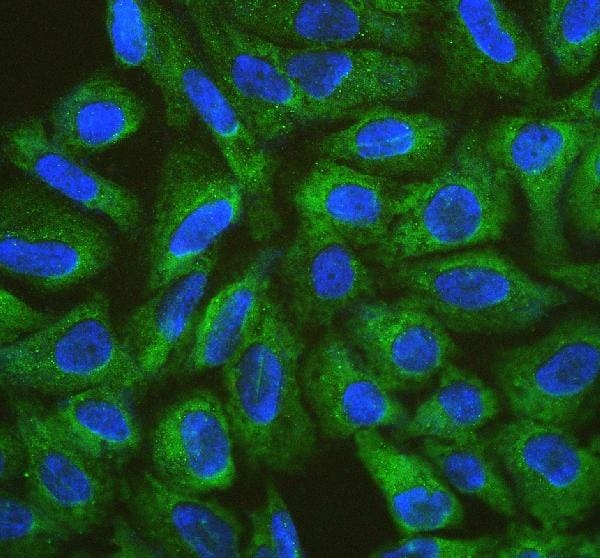
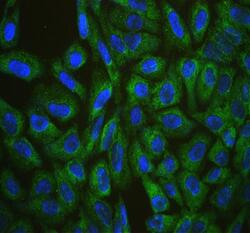
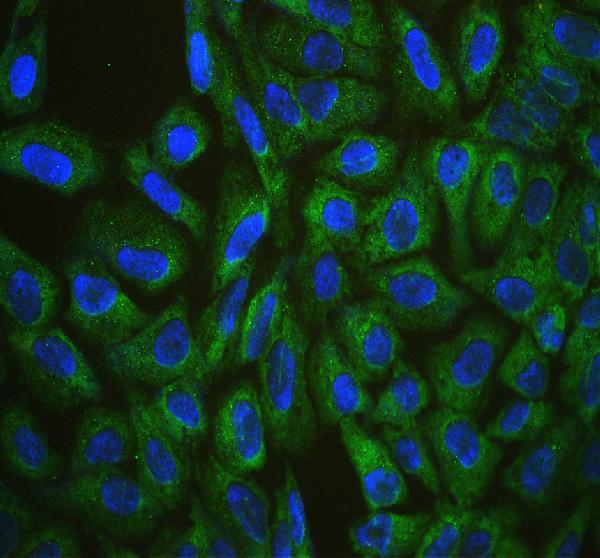
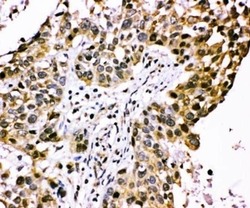
- Immunocytochemistry/Immunofluorescence analysis of CIS in U2OS cells using CIS Polyclonal Antibody (Product # PA5-79048). Enzyme antigen retrieval was performed using IHC enzyme antigen retrieval reagent for 15 mins. The cells were blocked with 10% goat serum and incubated with the primary antibody at 5 µg/mL. DyLight 488 conjugated goat anti-rabbit IgG was used as secondary antibody at 1:500 dilution and incubated for 30 minutes at 37°C. The section was counterstained with DAPI. Visualize using a fluorescence microscope and filter sets appropriate for the label used.
- Submitted by
- Invitrogen Antibodies (provider)
- Main image
- Experimental details
- Immunocytochemistry/Immunofluorescence analysis of CIS in U2OS cells using CIS Polyclonal Antibody (Product # PA5-79048). Enzyme antigen retrieval was performed using IHC enzyme antigen retrieval reagent for 15 mins. The cells were blocked with 10% goat serum and incubated with the primary antibody at 5 µg/mL. DyLight 488 conjugated goat anti-rabbit IgG was used as secondary antibody at 1:500 dilution and incubated for 30 minutes at 37°C. The section was counterstained with DAPI. Visualize using a fluorescence microscope and filter sets appropriate for the label used.
Supportive validation
- Submitted by
- Invitrogen Antibodies (provider)
- Main image
- Experimental details
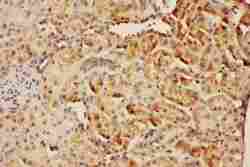
- Immunohistochemistry analysis of CIS on paraffin-embedded rat kidney tissue. Sample was incubated with CIS polyclonal antibody (Product# PA5-79048).
- Submitted by
- Invitrogen Antibodies (provider)
- Main image
- Experimental details
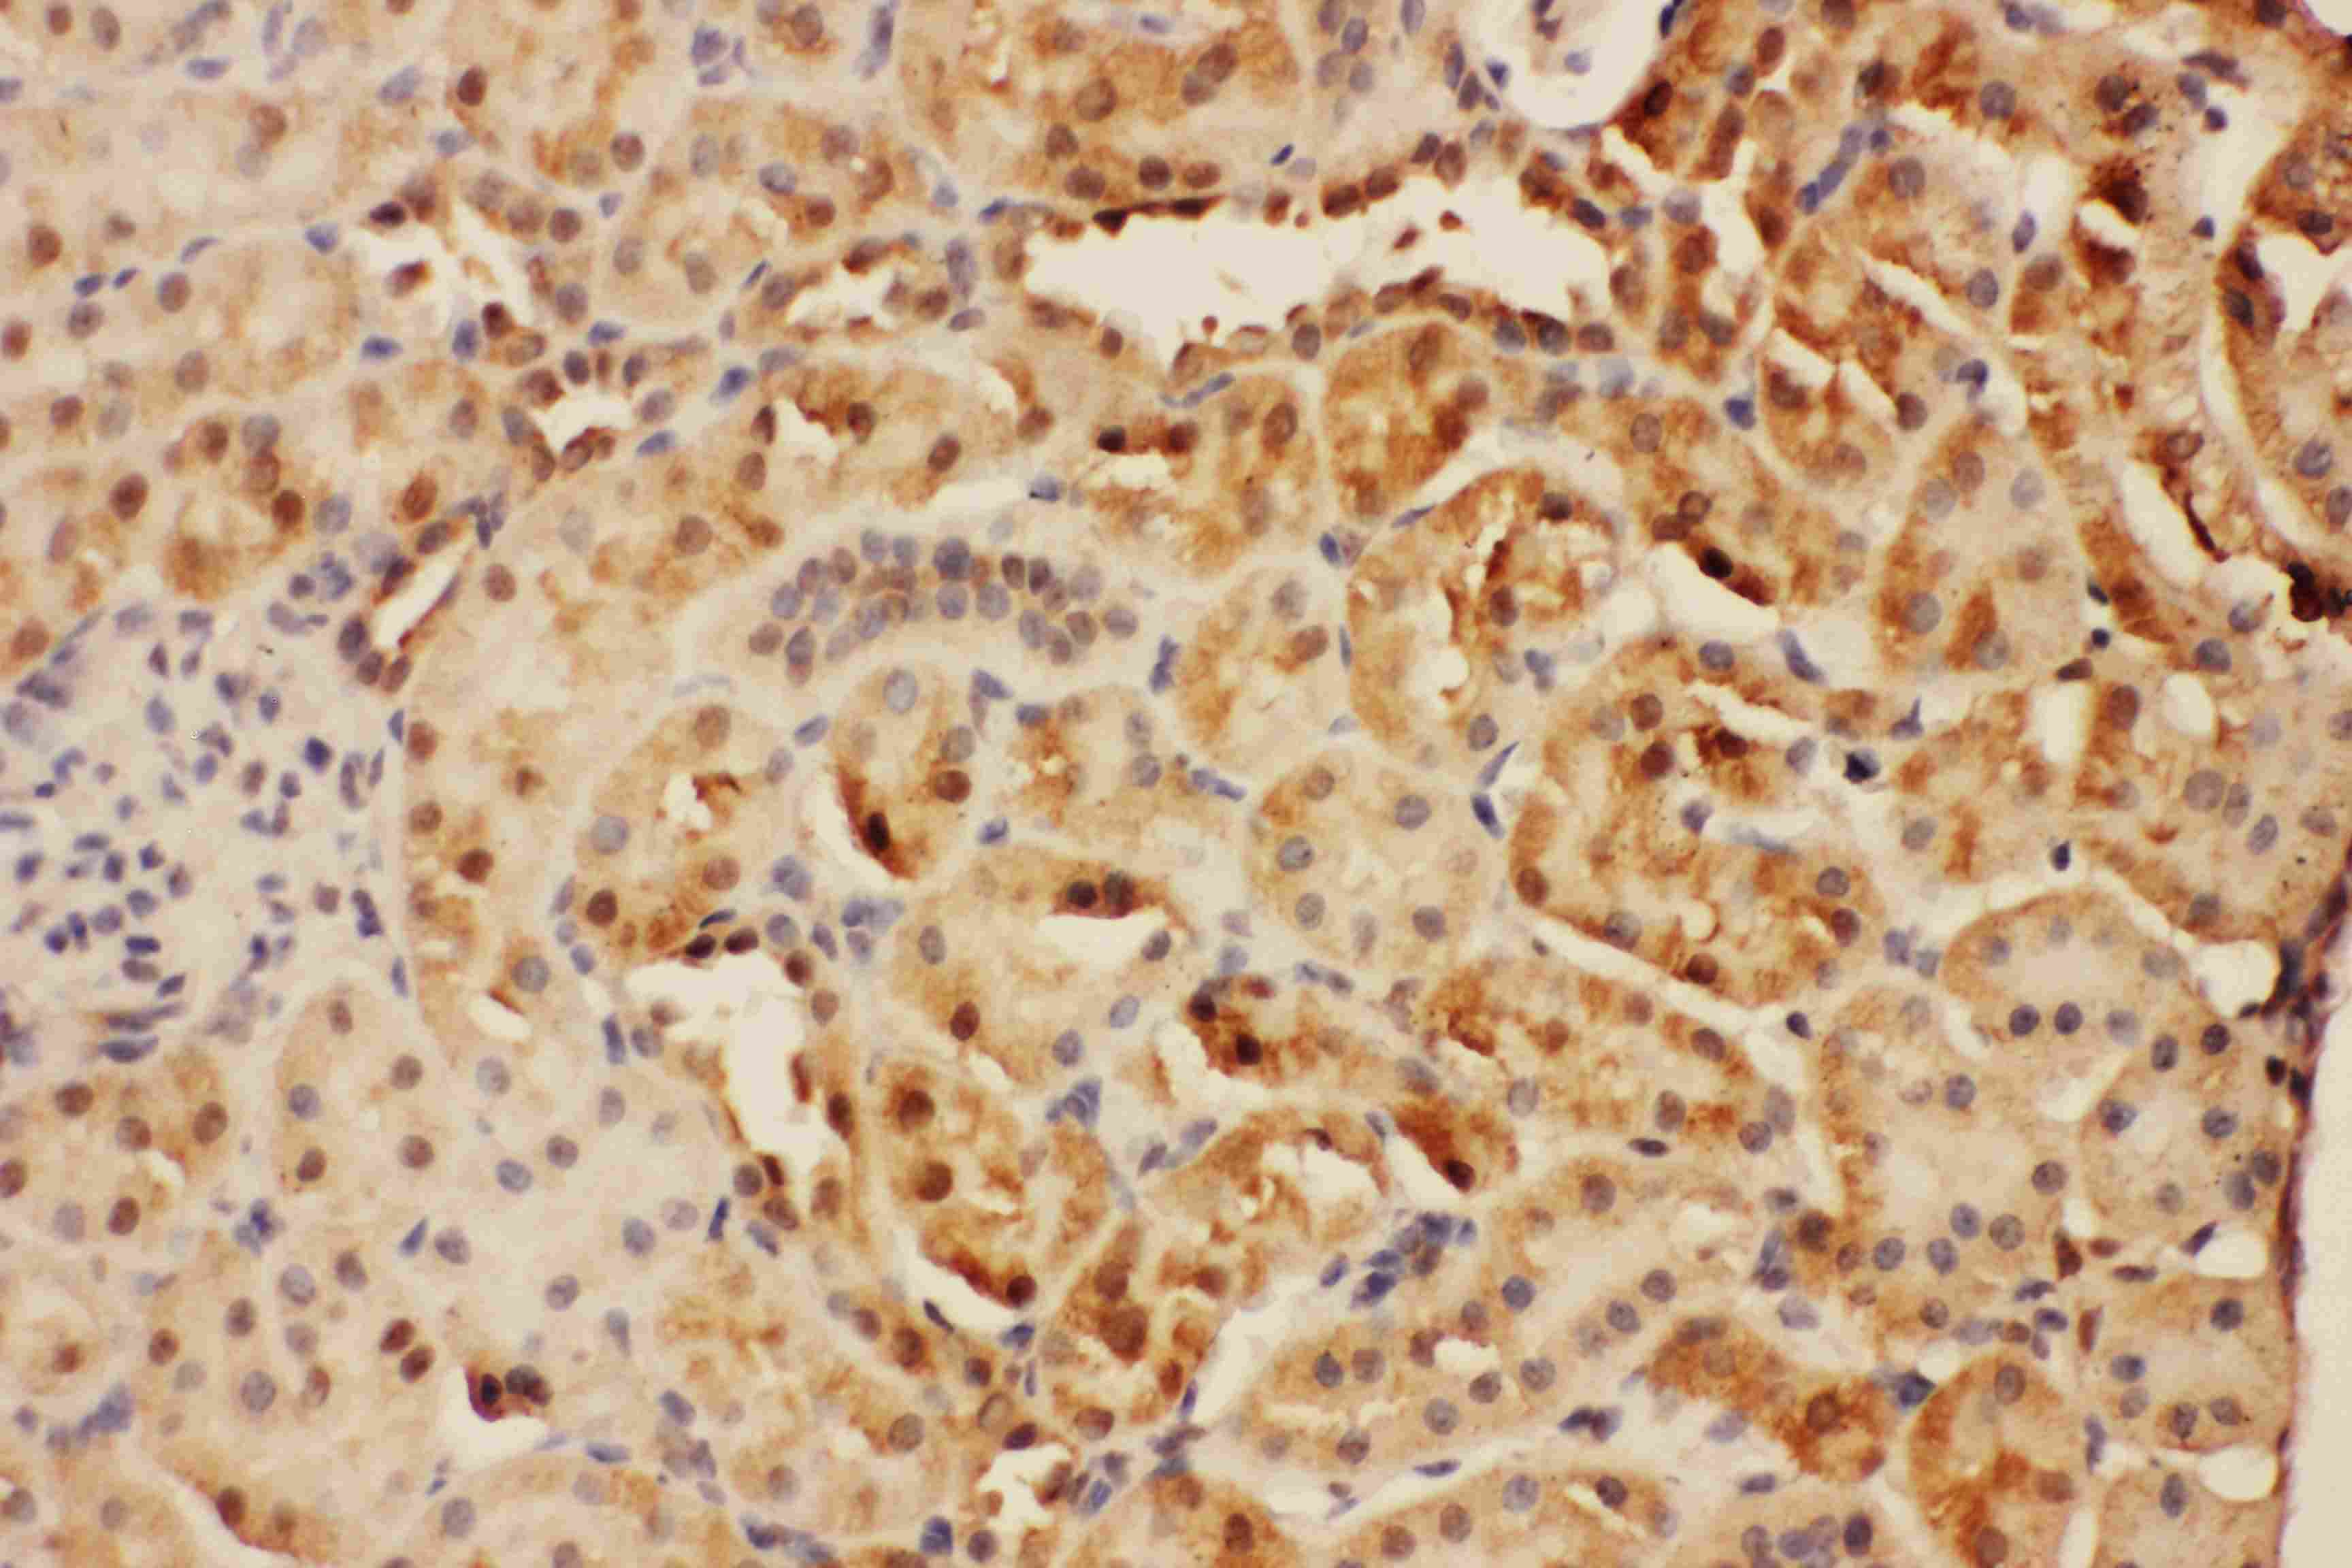
- Immunohistochemistry analysis of CIS on paraffin-embedded human lung cancer tissue. Sample was incubated with CIS polyclonal antibody (Product# PA5-79048).

Supportive validation
- Submitted by
- Invitrogen Antibodies (provider)
- Main image
- Experimental details
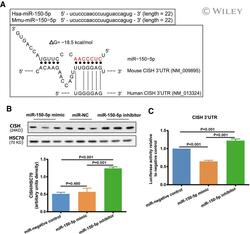
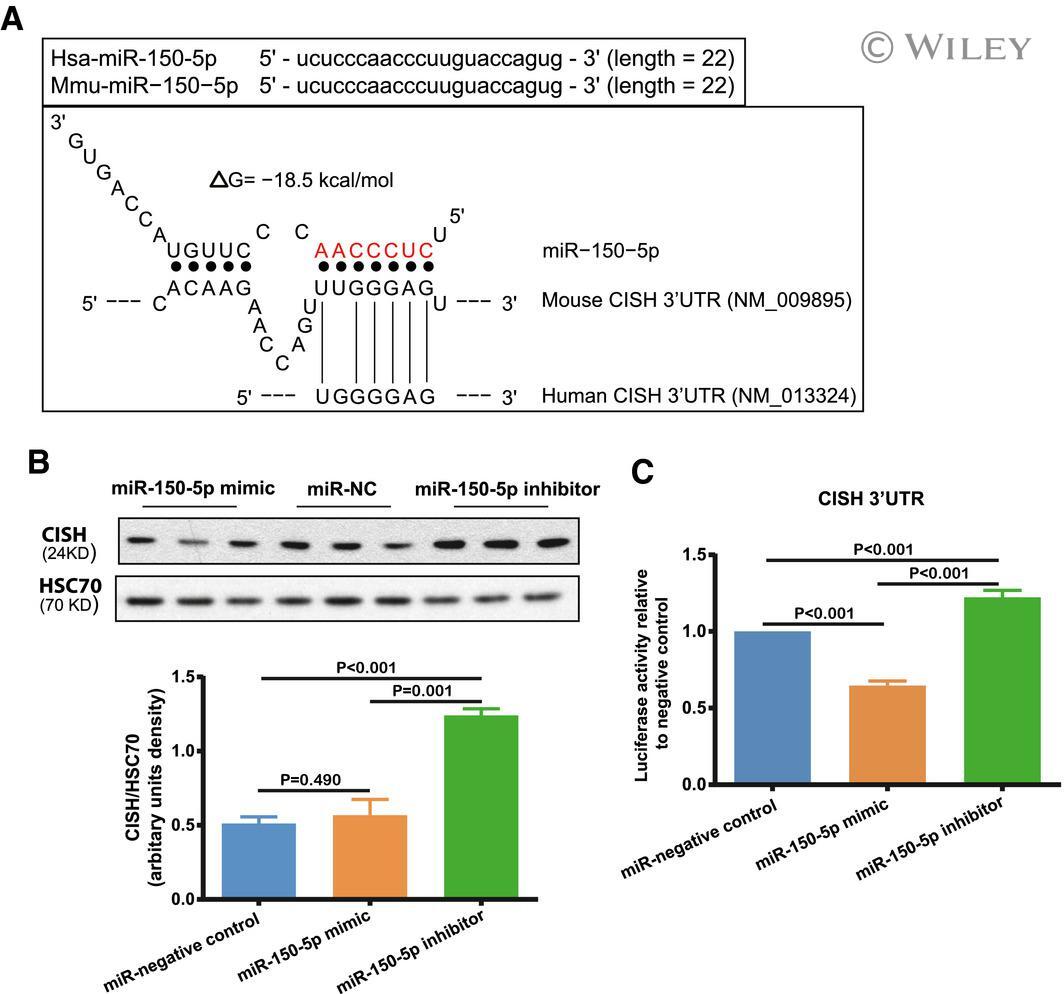
- 6 Fig. miR-150-5p directly targets CISH. (A) Predicted target site of miR-150-5p in 3'UTR region of CISH mRNA and sequence alignment between the mouse 3'UTR-CISH and human 3'UTR-CISH by BLAST. The dots represent target sites, and the vertical lines indicate similarity between human and murine sequences. (B) AML12 cells were transiently transfected with miR-150-5p mimic, inhibitor, or miRNA negative control (200 nM) for 48 hours, and protein levels of CISH were determined by western blot (n = 3). (C) The luciferase reporter plasmid containing CISH 3'UTR was co-transfected with miR-150-5p mimic, inhibitor, or miRNA negative control (200 nM) in AML12 cells. Luciferase activities were determined at 24 hours after transfection. The relative luciferase activity was normalized to the miRNA negative control group. Values represent means +- SEM, and P values are presented at the top of the bar graphs.
- Submitted by
- Invitrogen Antibodies (provider)
- Main image

- Experimental details
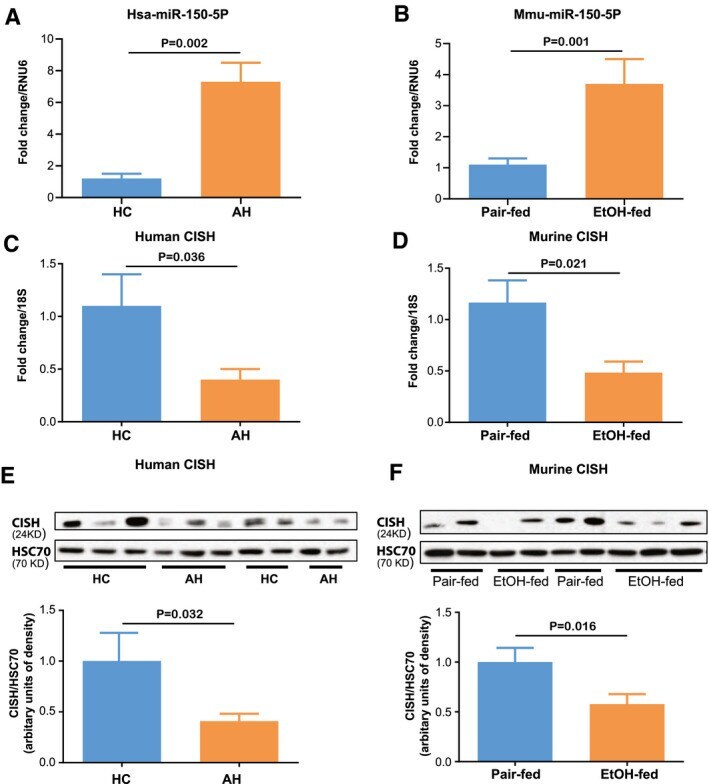
- Fig. 5 Increased miR-150-5p and decreased CISH were identified in patients with AH and the Gao-Binge mice model. Expression of miR-150-5p was determined in human livers (A) and mice livers (B) using quantitative real-time PCR and normalized to RNU6. Data are represented as fold change of EtOH versus pair group (n = 5-7 for each group). Expression of CISH was determined in human livers (C) and mice livers (D) using quantitative real-time PCR and normalized to 18 seconds. Data are represented as fold change of EtOH versus pair group (n = 5-7 for each group). (E) Expression of CISH protein was measured in the livers of patients with AH and heathy individuals by western blot (n = 5 for each group). Densitometry was carried out with HSC70 as a loading control. (F) Expression of CISH protein was measured in the livers of mice by western blot (n = 4-5 for each group). Densitometry was carried out with beta-actin as a loading control. Values represent means +- SEM, and P values are presented at the top of the bar graphs.