 Explore
 Validate
 Learn
Learn Western blot
 Immunocytochemistry
 Immunoprecipitation
Antibody data
- Antibody Data
- Antigen structure
- References [1]
- Comments [0]
- Validations
- Immunocytochemistry [2]
- Flow cytometry [1]
Submit
Validation data
Reference
Comment
Report error
- Product number
- 34-8900 - Provider product page

- Provider
- Invitrogen Antibodies
- Product name
- Cdc14B Polyclonal Antibody
- Antibody type
- Polyclonal
- Antigen
- Synthetic peptide
- Reactivity
- Human, Mouse
- Host
- Rabbit
- Isotype
- IgG
- Vial size
- 100 μg
- Concentration
- 0.25 mg/mL
- Storage
- -20°C
Submitted references The dual-specificity phosphatase CDC14B bundles and stabilizes microtubules.
Cho HP, Liu Y, Gomez M, Dunlap J, Tyers M, Wang Y
Molecular and cellular biology 2005 Jun;25(11):4541-51
Molecular and cellular biology 2005 Jun;25(11):4541-51
No comments: Submit comment
Supportive validation
- Submitted by
- Invitrogen Antibodies (provider)
- Main image

- Experimental details
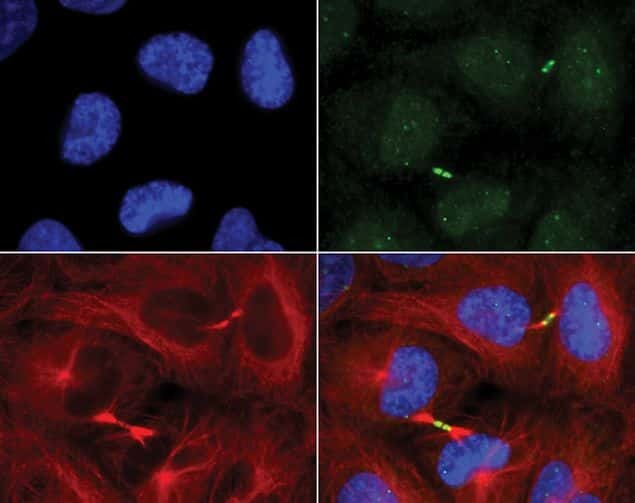
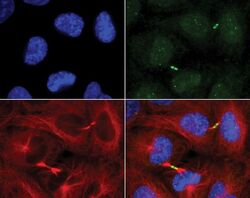
- Immunofluorescent staining of U2OS or HeLa cells with Rb anti-CDC14B (green) (Product # 34-8900). DNA is labeled with DAPI (blue), anti-CDC14B is labeled with FITC (green), and anti-Tubulin is labeled with rhodamine (red). CDC14B appears as bright nuclear dots and midbodies of cells undergoing cytokinesis. Image courtesy of Dr. Catherine Regnard and Dr. Ulrike Grueneberg, Max Planck Institute for Biochemistry, Germany.
- Submitted by
- Invitrogen Antibodies (provider)
- Main image
- Experimental details
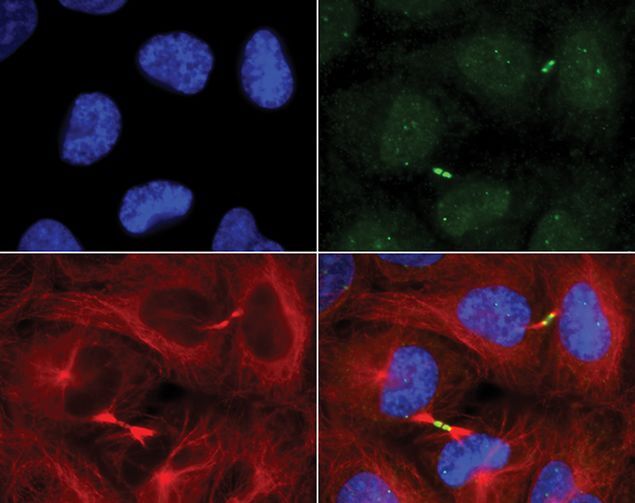
- Immunofluorescent staining of U2OS or HeLa cells with Rb anti-CDC14B (green) (Product # 34-8900). DNA is labeled with DAPI (blue), anti-CDC14B is labeled with FITC (green), and anti-Tubulin is labeled with rhodamine (red). CDC14B appears as bright nuclear dots and midbodies of cells undergoing cytokinesis. Image courtesy of Dr. Catherine Regnard and Dr. Ulrike Grueneberg, Max Planck Institute for Biochemistry, Germany.
Supportive validation
- Submitted by
- Invitrogen Antibodies (provider)
- Main image
- Experimental details
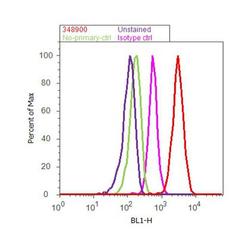
- Flow cytometry analysis of Cdc14B was done on Hep G2 cells. Cells were fixed with 70% ethanol for 10 minutes, permeabilized with 0.25% Triton™ X-100 for 20 minutes, and blocked with 5% BSA for 30 minutes at room temperature. Cells were labeled with Cdc14B Rabbit Polyclonal Antibody (Product # 34-8900, red histogram) or with rabbit isotype control (pink histogram) at 3-5 µg/million cells in 2.5% BSA. After incubation at room temperature for 2 hours, the cells were labeled with Alexa Fluor® 488 Goat Anti-Rabbit Secondary Antibody (Product # A11008) at a dilution of 1:400 for 30 minutes at room temperature. The representative 10, 000 cells were acquired and analyzed for each sample using an Attune® Acoustic Focusing Cytometer. The purple histogram represents unstained control cells and the green histogram represents no-primary-antibody control.
