Explore
 Validate
 Learn
Learn Western blot
 Immunocytochemistry
Antibody data
- Antibody Data
- Antigen structure
- References [1]
- Comments [0]
- Validations
- Immunocytochemistry [8]
- Immunoprecipitation [1]
- Immunohistochemistry [1]
- Other assay [2]
Submit
Validation data
Reference
Comment
Report error
- Product number
- PA5-29571 - Provider product page

- Provider
- Invitrogen Antibodies
- Product name
- TFAM Polyclonal Antibody
- Antibody type
- Polyclonal
- Antigen
- Recombinant full-length protein
- Description
- Recommended positive controls: 293T, A431, HeLa, HepG2, Neuro 2A. Predicted reactivity: Chimpanzee (99%). Store product as a concentrated solution. Centrifuge briefly prior to opening the vial.
- Reactivity
- Human, Mouse, Rat
- Host
- Rabbit
- Isotype
- IgG
- Vial size
- 100 μL
- Concentration
- 0.43 mg/mL
- Storage
- Store at 4°C short term. For long term storage, store at -20°C, avoiding freeze/thaw cycles.
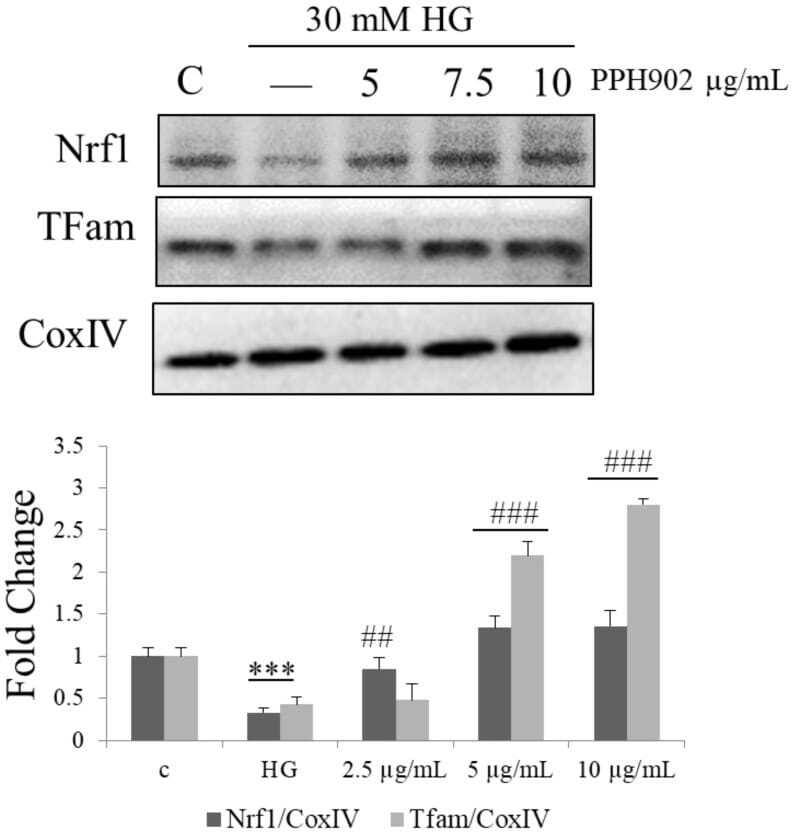
Submitted references Alcalase Potato Protein Hydrolysate-PPH902 Enhances Myogenic Differentiation and Enhances Skeletal Muscle Protein Synthesis under High Glucose Condition in C2C12 Cells.
Chen YJ, Chang CF, Angayarkanni J, Lin WT
Molecules (Basel, Switzerland) 2021 Oct 30;26(21)
Molecules (Basel, Switzerland) 2021 Oct 30;26(21)
No comments: Submit comment
Supportive validation
- Submitted by
- Invitrogen Antibodies (provider)
- Main image
- Experimental details
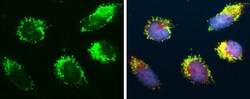
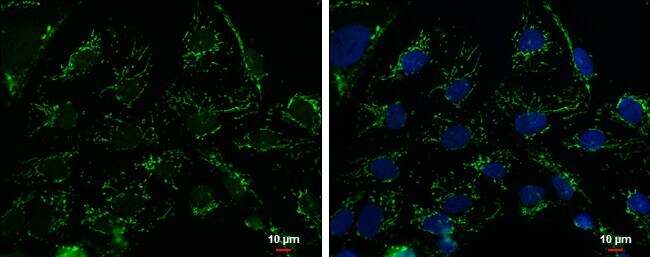
- Immunocytochemistry-Immunofluorescence analysis of TFAM was performed in HeLa cells fixed in 4% paraformaldehyde at RT for 15 min. Green: TFAM Polyclonal Antibody (Product # PA5-29571) diluted at 1:500. Red: Mitotracker, a mitochondria marker. Blue: Hoechst 33342 staining.

- Submitted by
- Invitrogen Antibodies (provider)
- Main image

- Experimental details
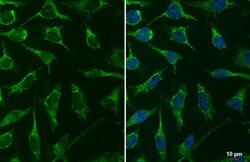
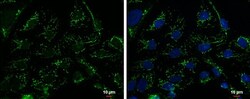
- Immunocytochemistry-Immunofluorescence analysis of TFAM was performed in NT2D1 cells fixed in 2% paraformaldehyde/culture medium at RT for 30 min. Green: TFAM Polyclonal Antibody (Product # PA5-29571) diluted at 1:500. Blue: Hoechst 33342 staining. Scale bar = 10 µm.

- Submitted by
- Invitrogen Antibodies (provider)
- Main image
- Experimental details
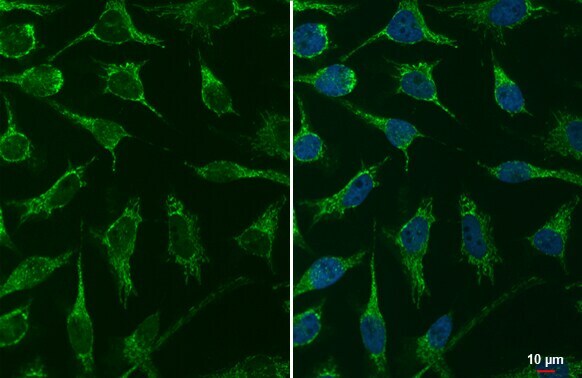
- TFAM antibody detects TFAM protein at mitochondria by immunofluorescent analysis. Sample: HeLa cells were fixed in 4% paraformaldehyde at RT for 15 min. Green: TFAM stained by TFAM antibody (Product # PA5-29571) diluted at 1:1,000.

- Submitted by
- Invitrogen Antibodies (provider)
- Main image
- Experimental details
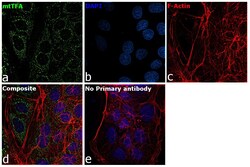
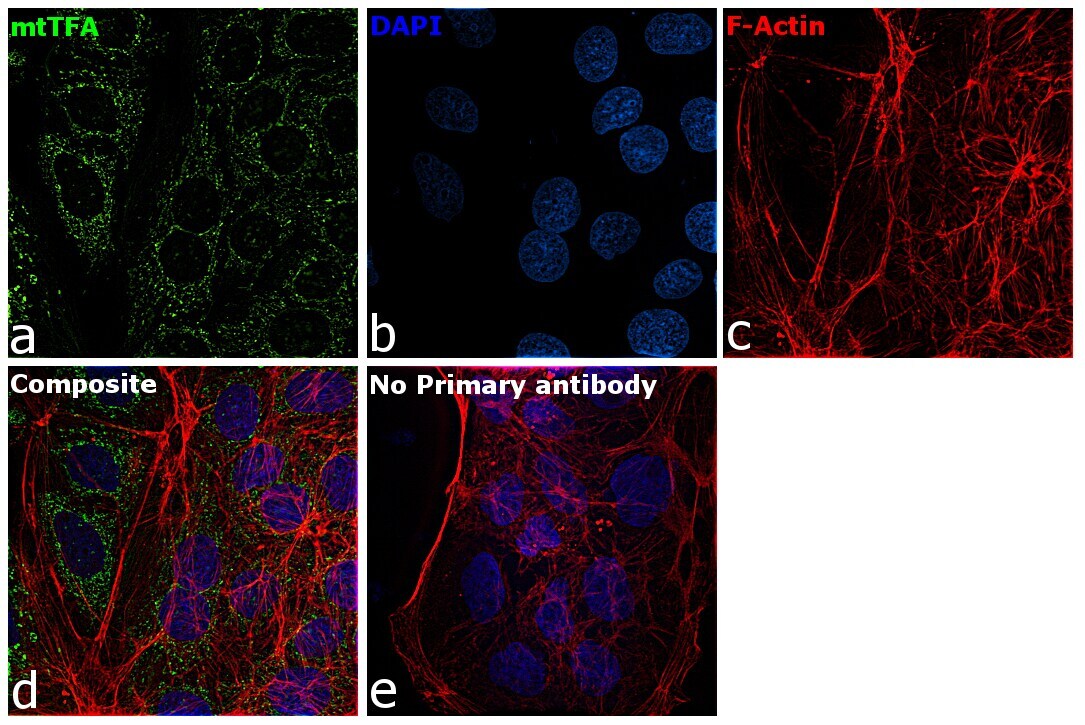
- Immunofluorescence analysis of mtTFA was performed using Caco-2 cells. The cells were fixed with 4% paraformaldehyde for 10 minutes, permeabilized with 0.1% Triton™ X-100 for 15 minutes, and blocked with 2% BSA for 1 hour at room temperature. The cells were labeled with mtTFA Rabbit Polyclonal Antibody (Product # PA5-29571) at 1:100 dilution in 0.1% BSA and incubated overnight at 4 degree and then labeled with Goat anti-Rabbit IgG (H+L) Highly Cross-Adsorbed Secondary Antibody, Alexa Fluor Plus 488 (Product # A32731) at a dilution of 1:2000 for 45 minutes at room temperature (Panel a: green). Nuclei (Panel b: blue) were stained with ProLong™ Diamond Antifade Mountant with DAPI (Product # P36962). F-actin (Panel c: red) was stained with Rhodamine Phalloidin (Product # R415, 1:300). Panel d represents the composite image showing mitochondrial pattern of mtTFA. Panel e represents control cells with no primary antibody to assess background. The images were captured at 60X magnification.

- Submitted by
- Invitrogen Antibodies (provider)
- Main image

- Experimental details
- Immunocytochemistry-Immunofluorescence analysis of TFAM was performed in HeLa cells fixed in 4% paraformaldehyde at RT for 15 min. Green: TFAM Polyclonal Antibody (Product # PA5-29571) diluted at 1:500. Red: Mitotracker, a mitochondria marker. Blue: Hoechst 33342 staining.

- Submitted by
- Invitrogen Antibodies (provider)
- Main image
- Experimental details
- Immunocytochemistry-Immunofluorescence analysis of TFAM was performed in NT2D1 cells fixed in 2% paraformaldehyde/culture medium at RT for 30 min. Green: TFAM Polyclonal Antibody (Product # PA5-29571) diluted at 1:500. Blue: Hoechst 33342 staining. Scale bar = 10 µm.
- Submitted by
- Invitrogen Antibodies (provider)
- Main image

- Experimental details
- Immunofluorescence analysis of mtTFA was performed using Caco-2 cells. The cells were fixed with 4% paraformaldehyde for 10 minutes, permeabilized with 0.1% Triton™ X-100 for 15 minutes, and blocked with 2% BSA for 1 hour at room temperature. The cells were labeled with mtTFA Rabbit Polyclonal Antibody (Product # PA5-29571) at 1:100 dilution in 0.1% BSA and incubated overnight at 4 degree and then labeled with Goat anti-Rabbit IgG (H+L) Highly Cross-Adsorbed Secondary Antibody, Alexa Fluor Plus 488 (Product # A32731) at a dilution of 1:2000 for 45 minutes at room temperature (Panel a: green). Nuclei (Panel b: blue) were stained with ProLong™ Diamond Antifade Mountant with DAPI (Product # P36962). F-actin (Panel c: red) was stained with Rhodamine Phalloidin (Product # R415, 1:300). Panel d represents the composite image showing mitochondrial pattern of mtTFA. Panel e represents control cells with no primary antibody to assess background. The images were captured at 60X magnification.
- Submitted by
- Invitrogen Antibodies (provider)
- Main image

- Experimental details
- TFAM antibody detects TFAM protein at mitochondria by immunofluorescent analysis. Sample: HeLa cells were fixed in 4% paraformaldehyde at RT for 15 min. Green: TFAM stained by TFAM antibody (Product # PA5-29571) diluted at 1:1,000.
Supportive validation
- Submitted by
- Invitrogen Antibodies (provider)
- Main image
- Experimental details
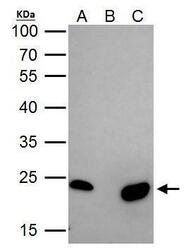
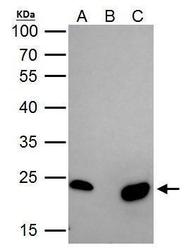
- TFAM Polyclonal Antibody immunoprecipitates mtTFA protein in IP experiments. IP Sample: 293T whole cell lysate/extract A. 40 µg 293T whole cell lysate/extract B. Control with 2 µg of preimmune rabbit IgG C. Immunoprecipitation of mtTFA protein by 2 µg of TFAM Polyclonal Antibody (Product # PA5-29571) 12% SDS-PAGE The immunoprecipitated mtTFA protein was detected by TFAM Polyclonal Antibody (Product # PA5-29571) diluted at 1:1,000.
Supportive validation
- Submitted by
- Invitrogen Antibodies (provider)
- Main image
- Experimental details
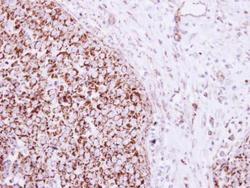
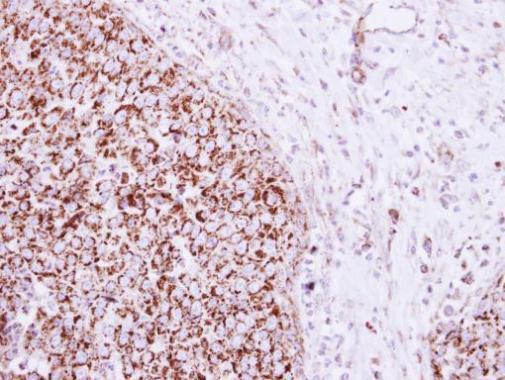
- Immunohistochemical analysis of paraffin-embedded human breast cancer, using mtTFA (Product # PA5-29571) antibody at 1:250 dilution. Antigen Retrieval: EDTA based buffer, pH 8.0, 15 min.
Supportive validation
- Submitted by
- Invitrogen Antibodies (provider)
- Main image
- Experimental details
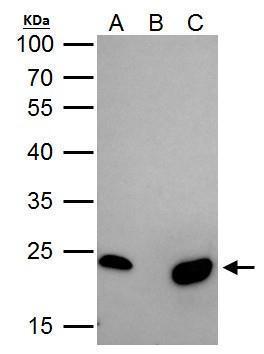
- TFAM Polyclonal Antibody immunoprecipitates mtTFA protein in IP experiments. IP Sample: 293T whole cell lysate/extract A. 40 µg 293T whole cell lysate/extract B. Control with 2 µg of preimmune rabbit IgG C. Immunoprecipitation of mtTFA protein by 2 µg of TFAM Polyclonal Antibody (Product # PA5-29571) 12% SDS-PAGE The immunoprecipitated mtTFA protein was detected by TFAM Polyclonal Antibody (Product # PA5-29571) diluted at 1:1,000.

- Submitted by
- Invitrogen Antibodies (provider)
- Main image

- Experimental details
- Figure 9 Effect of PPH902 on the activation of mitochondrial biogenesis: Representative Western blotting shows changes in the levels of NRF1 and TFAM in C2C12 cells. *** p < 0.001 indicates a significant difference with respect to control groups and ## p < 0.01 and ### p < 0.001 indicates a significance difference with respect to the high glucose challenge groups.