Explore
 Validate
 Learn
Learn Flow cytometry
Antibody data
- Antibody Data
- Antigen structure
- References [3]
- Comments [0]
- Validations
- Flow cytometry [1]
- Other assay [4]
Submit
Validation data
Reference
Comment
Report error
- Product number
- 12-7209-42 - Provider product page

- Provider
- Invitrogen Antibodies
- Product name
- GM-CSF Monoclonal Antibody (DAVKAT), PE, eBioscience™
- Antibody type
- Monoclonal
- Antigen
- Other
- Description
- Description: This DAVKAT monoclonal antibody reacts with human Granulocyte-Macrophage Colony-Stimulating Factor (GM-CSF). Human GM-CSF is a 127 amino acid, differentially glycosylated factor produced mainly by activated T cells and macrophages. Endothelial cells and fibroblasts can also produce GM-CSF after exposure to TNF alpha, IL-1, IL-2 and IFN gamma. GM-CSF is found associated with the extracellular matrix and in membrane-bound formats as well. It stimulates proliferation, activation and differentiation of macrophages, granulocytes and their progenitors. Applications Reported: This DAVKAT antibody has been reported for use in intracellular staining followed by flow cytometric analysis. Applications Tested: This DAVKAT antibody has been pre-titrated and tested by intracellular staining followed by flow cytometric analysis of normal human peripheral blood cells using the Intracellular Fixation & Permeabilization Buffer Set (Product # 88-8824-00) and protocol. Please refer to Best Protocols: Protocol A: Two step protocol for (cytoplasmic) intracellular proteins located under the Resources Tab online. This can be used at 5 µL (0.06 µg) per test. A test is defined as the amount (µg) of antibody that will stain a cell sample in a final volume of 100 µL. Cell number should be determined empirically but can range from 10^5 to 10^8 cells/test. Excitation: 488-561 nm; Emission: 578 nm; Laser: Blue Laser, Green Laser, Yellow-Green Laser. Filtration: 0.2 µm post-manufacturing filtered.
- Reactivity
- Human
- Host
- Rat
- Conjugate
- Yellow dye
- Isotype
- IgG
- Antibody clone number
- DAVKAT
- Vial size
- 100 Tests
- Concentration
- 5 µL/Test
- Storage
- 4° C, store in dark, DO NOT FREEZE!
Submitted references YY1 regulation by miR-124-3p promotes Th17 cell pathogenicity through interaction with T-bet in rheumatoid arthritis.
Granulocyte-macrophage colony-stimulating factor (GM-CSF) and T-cell responses: what we do and don't know.
The molecular biology and functions of the granulocyte-macrophage colony-stimulating factors.
Lin J, Tang J, Lin J, He Y, Yu Z, Jiang R, Yang B, Ou Q
JCI insight 2021 Nov 22;6(22)
JCI insight 2021 Nov 22;6(22)
Granulocyte-macrophage colony-stimulating factor (GM-CSF) and T-cell responses: what we do and don't know.
Shi Y, Liu CH, Roberts AI, Das J, Xu G, Ren G, Zhang Y, Zhang L, Yuan ZR, Tan HS, Das G, Devadas S
Cell research 2006 Feb;16(2):126-33
Cell research 2006 Feb;16(2):126-33
The molecular biology and functions of the granulocyte-macrophage colony-stimulating factors.
Metcalf D
Blood 1986 Feb;67(2):257-67
Blood 1986 Feb;67(2):257-67
No comments: Submit comment
Supportive validation
- Submitted by
- Invitrogen Antibodies (provider)
- Main image
- Experimental details
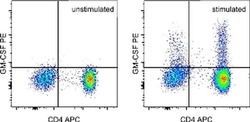
- Normal human peripheral blood mononuclear cells were cultured 5 hours with Protein Transport Inhibitor Cocktail (Product # 00-4980-03) (unstimulated) (left) or with Cell Stimulation Cocktail (Product # 00-4975-03) (right). The cells were stained intracellularly with Anti-Human CD4 APC (Product # 17-0047-42) and Anti-Human GM-CSF PE using the Intracellular Fixation and Permeabilization Buffer Set (Product # 88-8824-00) and protocol. Cells in the lymphocyte gate were used for analysis.
- Conjugate
- Yellow dye

Supportive validation
- Submitted by
- Invitrogen Antibodies (provider)
- Main image
- Experimental details
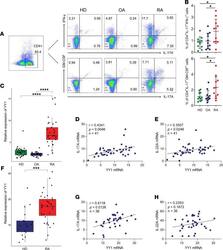
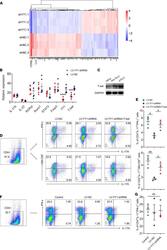
- Figure 1 Increased pTh17 cells have potential relationship with YY1 expression in RA. ( A and B ) Representative images of flow cytometry results for the proportion of CD4 + IL-17A + IFN-gamma + cells and CD4 + IL-17A + GM-CSF + cells in PBMCs of patients with RA and OA as well as HDs. Data presented as mean +- SD ( n = 11). * P < 0.05 (ANOVA). ( C ) The relative gene expression levels of YY1 in PBMCs of patients with RA ( n = 33) and OA ( n = 24) as well as HDs ( n = 32). Data presented as box-and-whisker plot (The line within the box and the bounds of the box represent median and interquartile range, respectively. The whiskers denote the 25th percentile minus 1.5 interquartile range and 75th percentile plus 1.5 interquartile range. The points, which are outside the whisker, represent outliers). *** P < 0.001, **** P < 0.0001 (ANOVA). ( D and E ) Analysis of the correlation of IL-17A or IL-22 mRNA and YY1 mRNA in PBMCs of RA patients ( n = 41, Pearson correlation). ( F ) The relative gene expression levels of YY1 in purified CD4 + T cells of patients with RA ( n = 36) and HD ( n = 18). Data presented as box-and-whisker plot (The meaning of the symbols is the same as C ). *** P < 0.001 (Student's t test). ( G and H ) Analysis of the correlation of IL-17A or IL-22 mRNA and YY1 mRNA in purified CD4 + T cells of RA patients ( n = 36, Pearson correlation).
- Conjugate
- Yellow dye
- Submitted by
- Invitrogen Antibodies (provider)
- Main image
- Experimental details
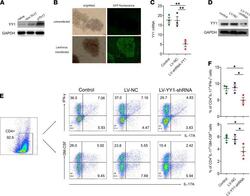
- Figure 2 YY1 is involved in pTh17 cell differentiation. ( A ) Representative Western blots of YY1 in an ex vivo Th17 subset differentiation system including unpolarized, non-pTh17-polarized, and pTh17-polarized groups (at least 3 independent experiments). ( B ) Representative fluorescence images for transfection efficiency of the sh-YY1 lentivirus (scale bars = 100 mum, at least 3 independent experiments). ( C ) The relative expression levels of YY1 for knockdown effect of the sh-YY1 lentivirus ( n = 3 independent experiments). ( D ) Representative Western blots of YY1 for knockdown effect of the sh-YY1 lentivirus (at least 3 independent experiments). ( E and F ) Representative images of flow cytometry results for the proportion of CD4 + IL-17A + IFN-gamma + cells and CD4 + IL-17A + GM-CSF + cells in the pTh17-polarized group treated with the sh-YY1 lentivirus. All data presented as mean +- SEM ( n = 3 of independent experiments). ** P < 0.01, * P < 0.05 (ANOVA).
- Conjugate
- Yellow dye

- Submitted by
- Invitrogen Antibodies (provider)
- Main image
- Experimental details
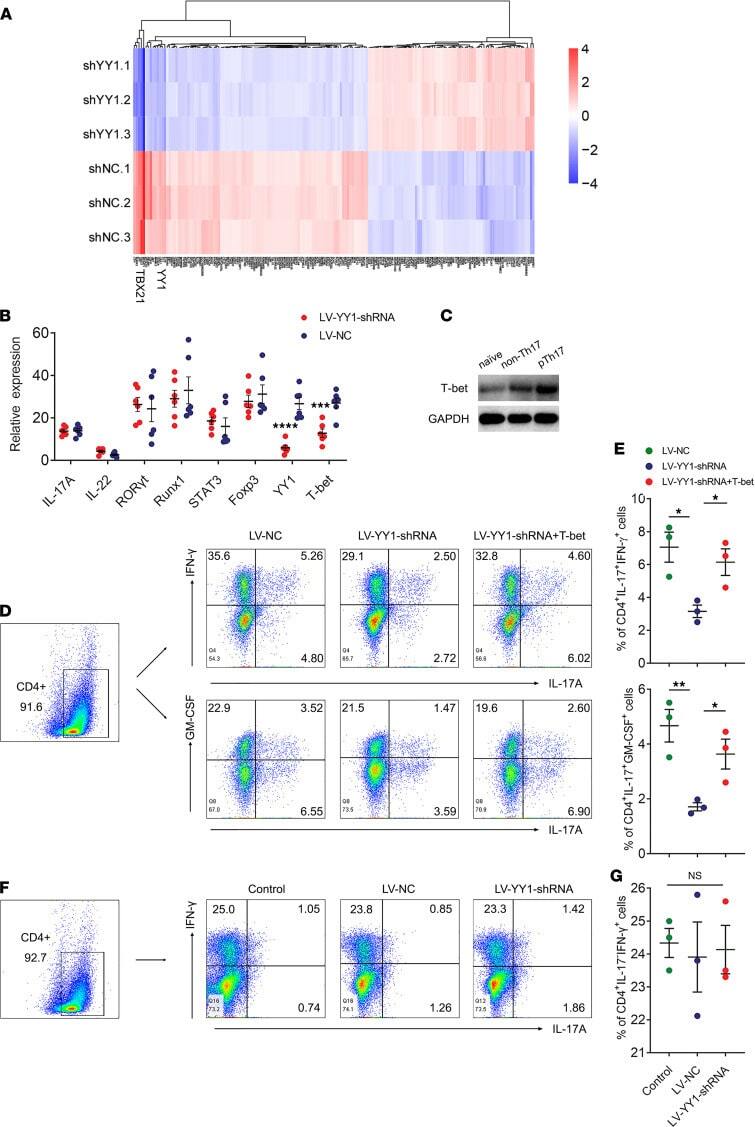
- Figure 4 YY1 specifically regulates pTh17 cell differentiation through affecting T-bet. ( A ) Heatmap of clustering analysis of differentially expressed genes of cells treated with the sh-YY1 lentiviruses in pTh17-polarized conditions. ( B ) The relative gene expressions of pTh17-related transcription factors and cytokines in cells from YY1-knockdown pTh17-polarized group. Data presented as mean +- SEM ( n = 6). *** P < 0.001, **** P < 0.0001 (Student's t test). ( C ) Representative Western blots of T-bet in an ex vivo Th17 subset differentiation system including unpolarized, non-pTh17-polarized, and pTh17-polarized (at least 3 independent experiments). ( D and E ) Representative images of flow cytometry results for the proportion of CD4 + IL-17A + IFN-gamma + cells and CD4 + IL-17A + GM-CSF + cells in pTh17-polarized group treated with the sh-YY1 lentivirus or cotransfected with sh-YY1 lentivirus and T-bet-overexpressing lentivirus. Data presented as mean +- SEM ( n = 3 independent experiments). ** P < 0.01, * P < 0.05 (ANOVA). ( F and G ) Representative images of flow cytometry results for the proportion of CD4 + IL-17A + IFN-gamma + cells in Th1-polarized group treated with the sh-YY1 lentivirus. Data presented as mean +- SEM ( n = 3 independent experiments). * P < 0.05 (ANOVA).
- Conjugate
- Yellow dye
- Submitted by
- Invitrogen Antibodies (provider)
- Main image

- Experimental details
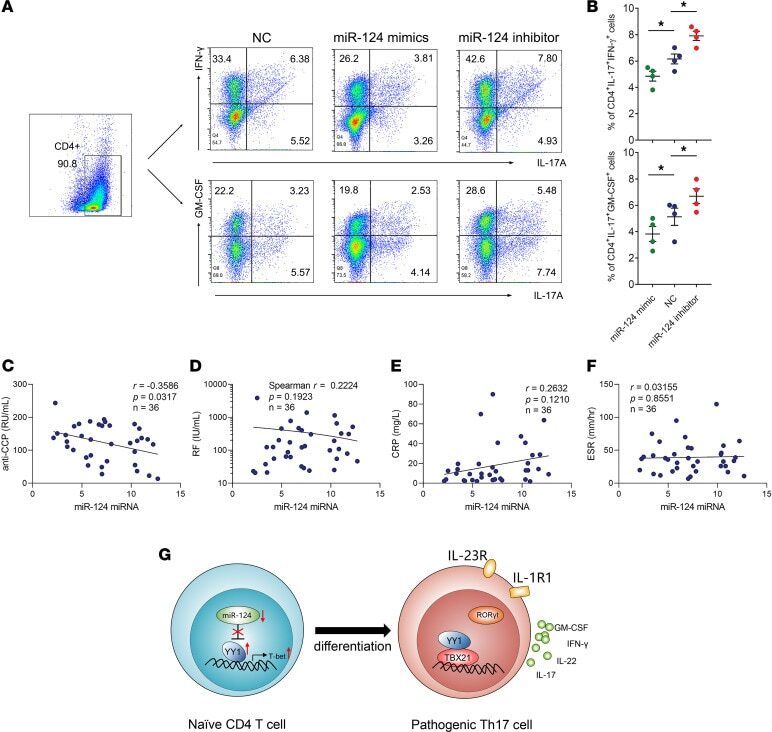
- Figure 7 miR-124-3p is involved in the pathogenicity of Th17 cells. ( A and B ) Representative images of flow cytometry results for the proportion of CD4 + IL-17A + IFN-gamma + cells and CD4 + IL-17A + GM-CSF + cells in pTh17-polarized group transfected with miR-124-3p mimics, inhibitors, or control plasmid. Data presented as mean +- SEM ( n = 3 independent experiments). * P < 0.05 (ANOVA). ( C - F ) Analysis of the correlation of miR-124-3p and anti-CCP, RF, CRP, and ESR in purified CD4 + T cells of patients with RA ( n = 36. C , E , and F using Pearson correlation, D using Spearman correlation). ( G ) Sketch of miR-124-3p and YY1 in differentiation of pTh17 cells in RA.
- Conjugate
- Yellow dye