Explore
 Validate
 Learn
Learn Western blot
 Other assay
Antibody data
- Antibody Data
- Antigen structure
- References [75]
- Comments [0]
- Validations
- Other assay [65]
Submit
Validation data
Reference
Comment
Report error
- Product number
- 14-9965-80 - Provider product page

- Provider
- Invitrogen Antibodies
- Product name
- FOXJ1 Monoclonal Antibody (2A5), eBioscience™
- Antibody type
- Monoclonal
- Antigen
- Other
- Description
- Description: This 2A5 monoclonal antibody reacts with Foxj1, a 50-kDa member of the Forkhead-box (FOX) family of winged-helix transcription factors. Expression of Foxj1 is high in ciliated epithelial cells and low in naive T and B cells, where cellular activation results in downregulation of the factor. Foxj1 modulates germinal center formation and Th1 activation by repressing NFkappaB through IkappaBbeta induction. As such, this transcription factor has been suggested to antagonize autoimmune reactions such as systemic lupus erythematosus and rheumatoid arthritis. In addition, Foxj1 has been linked to the formation of motile cilia in epithelial cells. Applications Reported: This 2A5 antibody has been reported for use in western blotting, immunohistochemical staining of formalin-fixed paraffin embedded tissue sections, and immunocytochemistry. Applications Tested: This 2A5 antibody has been tested by western blot of mouse tracheal epithelial cells and testes, as well as by immunohistochemistry of mouse lung tissue. This antibody can be used between 1-10 µg/mL. It is recommended that the antibody be carefully titrated for optimal performance in the assay of interest. Purity: Greater than 90%, as determined by SDS-PAGE. Aggregation: Less than 10%, as determined by HPLC. Filtration: 0.2 µm post-manufacturing filtered.
- Reactivity
- Human, Mouse
- Host
- Mouse
- Isotype
- IgG
- Antibody clone number
- 2A5
- Vial size
- 25 µg
- Concentration
- 0.5 mg/mL
- Storage
- 4° C
Submitted references An essential function for autocrine hedgehog signaling in epithelial proliferation and differentiation in the trachea.
Prominin 1 and Notch regulate ciliary length and dynamics in multiciliated cells of the airway epithelium.
Engineering rotating apical-out airway organoid for assessing respiratory cilia motility.
Junctional Adhesion Molecule 3 Expression in the Mouse Airway Epithelium Is Linked to Multiciliated Cells.
Distribution of Aldh1L1-CreER(T2) Recombination in Astrocytes Versus Neural Stem Cells in the Neurogenic Niches of the Adult Mouse Brain.
ID4 Is Required for Normal Ependymal Cell Development.
Differentiation of mouse fetal lung alveolar progenitors in serum-free organotypic cultures.
Molecular diversity of diencephalic astrocytes reveals adult astrogenesis regulated by Smad4.
Transcriptional analysis of cystic fibrosis airways at single-cell resolution reveals altered epithelial cell states and composition.
SARS-CoV-2 infection of primary human lung epithelium for COVID-19 modeling and drug discovery.
Human-Induced Neural and Mesenchymal Stem Cell Therapy Combined with a Curcumin Nanoconjugate as a Spinal Cord Injury Treatment.
Pulmonary fibrosis distal airway epithelia are dynamically and structurally dysfunctional.
Yap/Taz inhibit goblet cell fate to maintain lung epithelial homeostasis.
Androglobin gene expression patterns and FOXJ1-dependent regulation indicate its functional association with ciliogenesis.
BMP signaling suppresses Gemc1 expression and ependymal differentiation of mouse telencephalic progenitors.
Long noncoding RNA TINCR is a novel regulator of human bronchial epithelial cell differentiation state.
Isolation, expansion, differentiation, and histological processing of human nasal epithelial cells.
Temporospatial Expression of Fgfr1 and 2 During Lung Development, Homeostasis, and Regeneration.
Generation of Complete Multi-Cell Type Lung Organoids From Human Embryonic and Patient-Specific Induced Pluripotent Stem Cells for Infectious Disease Modeling and Therapeutics Validation.
Fallopian Tube Basal Stem Cells Reproducing the Epithelial Sheets In Vitro-Stem Cell of Fallopian Epithelium.
Creation of Laryngeal Grafts from Primary Human Cells and Decellularized Laryngeal Scaffolds.
Pathogenic DDX3X Mutations Impair RNA Metabolism and Neurogenesis during Fetal Cortical Development.
P73 C-terminus is dispensable for multiciliogenesis.
Airway epithelial cell differentiation relies on deficient Hedgehog signalling in COPD.
Single-Cell Reconstruction of Human Basal Cell Diversity in Normal and Idiopathic Pulmonary Fibrosis Lungs.
Smooth Muscle Differentiation Is Essential for Airway Size, Tracheal Cartilage Segmentation, but Dispensable for Epithelial Branching.
Chloride channels regulate differentiation and barrier functions of the mammalian airway.
STK11 is required for the normal program of ciliated cell differentiation in airways.
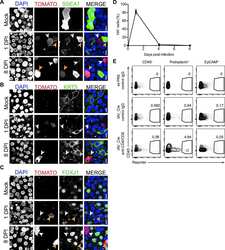
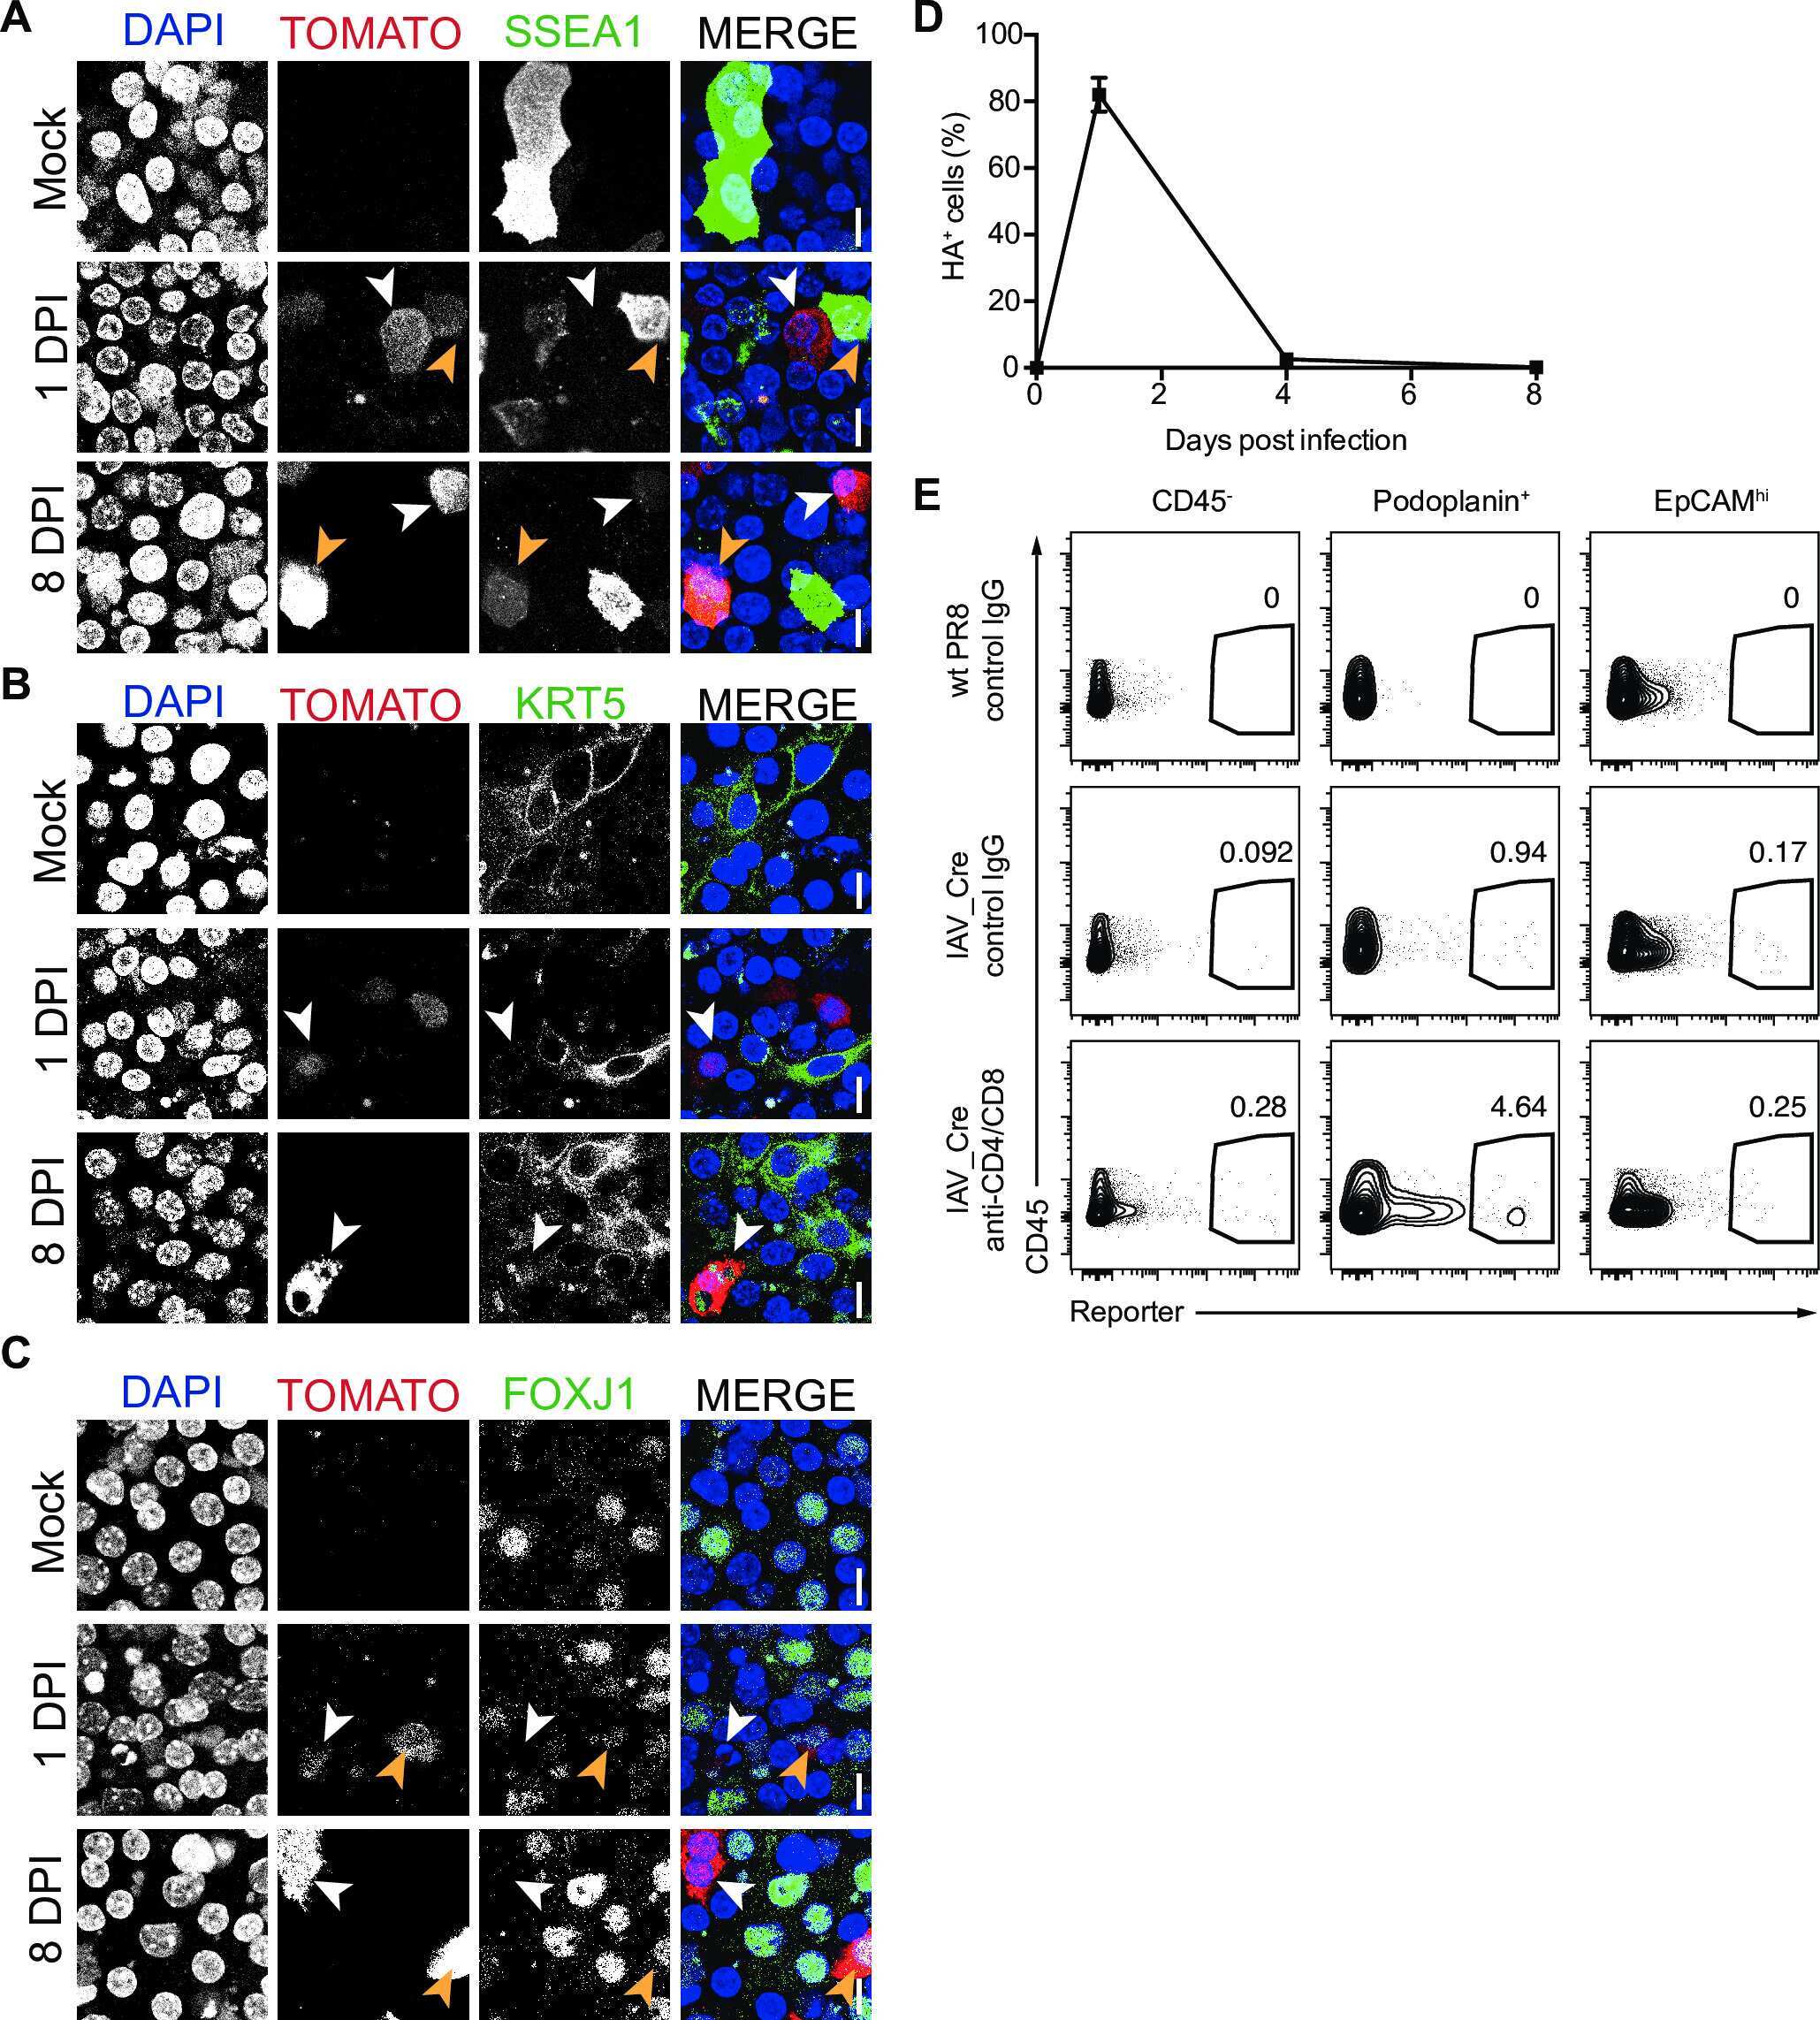
Long-term surviving influenza infected cells evade CD8+ T cell mediated clearance.
Sensing of apoptotic cells through Axl causes lung basal cell proliferation in inflammatory diseases.
A Subset of Olfactory Sensory Neurons Express Forkhead Box J1-Driven eGFP.
Jagged and Delta-like ligands control distinct events during airway progenitor cell differentiation.
Dnmt1 is required for proximal-distal patterning of the lung endoderm and for restraining alveolar type 2 cell fate.
Non-lytic clearance of influenza B virus from infected cells preserves epithelial barrier function.
E3 ubiquitin ligase MDM2 acts through p53 to control respiratory progenitor cell number and lung size.
Adult Neural Stem Cells and Multiciliated Ependymal Cells Share a Common Lineage Regulated by the Geminin Family Members.
Characterization of the ventricular-subventricular stem cell niche during human brain development.
CDC20B is required for deuterosome-mediated centriole production in multiciliated cells.
Developmental History Provides a Roadmap for the Emergence of Tumor Plasticity.
Expansion of Airway Basal Cells and Generation of Polarized Epithelium.
Bronchial extracellular matrix from COPD patients induces altered gene expression in repopulated primary human bronchial epithelial cells.
The mouse Jhy gene regulates ependymal cell differentiation and ciliogenesis.
Cell cycle-targeting microRNAs promote differentiation by enforcing cell-cycle exit.
Forkhead Box Protein J1 (FOXJ1) is Overexpressed in Colorectal Cancer and Promotes Nuclear Translocation of β-Catenin in SW620 Cells.
Spontaneous Chitin Accumulation in Airways and Age-Related Fibrotic Lung Disease.
A bioengineered niche promotes in vivo engraftment and maturation of pluripotent stem cell derived human lung organoids.
Rare SOX2(+) Airway Progenitor Cells Generate KRT5(+) Cells that Repopulate Damaged Alveolar Parenchyma following Influenza Virus Infection.
An in vitro model of murine middle ear epithelium.
GEMC1 is a critical regulator of multiciliated cell differentiation.
Zbtb20 promotes astrocytogenesis during neocortical development.
KLF4 regulates adult lung tumor-initiating cells and represses K-Ras-mediated lung cancer.
Dual SMAD Signaling Inhibition Enables Long-Term Expansion of Diverse Epithelial Basal Cells.
Sonic Hedgehog promotes proliferation of Notch-dependent monociliated choroid plexus tumour cells.
An FGFR1-SPRY2 Signaling Axis Limits Basal Cell Proliferation in the Steady-State Airway Epithelium.
Lin41/Trim71 is essential for mouse development and specifically expressed in postnatal ependymal cells of the brain.
GRHL2 coordinates regeneration of a polarized mucociliary epithelium from basal stem cells.
The in vitro generation of lung and airway progenitor cells from human pluripotent stem cells.
The LIM-domain only protein 4 contributes to lung epithelial cell proliferation but is not essential for tumor progression.
Parent stem cells can serve as niches for their daughter cells.
Injury induces direct lineage segregation of functionally distinct airway basal stem/progenitor cell subpopulations.
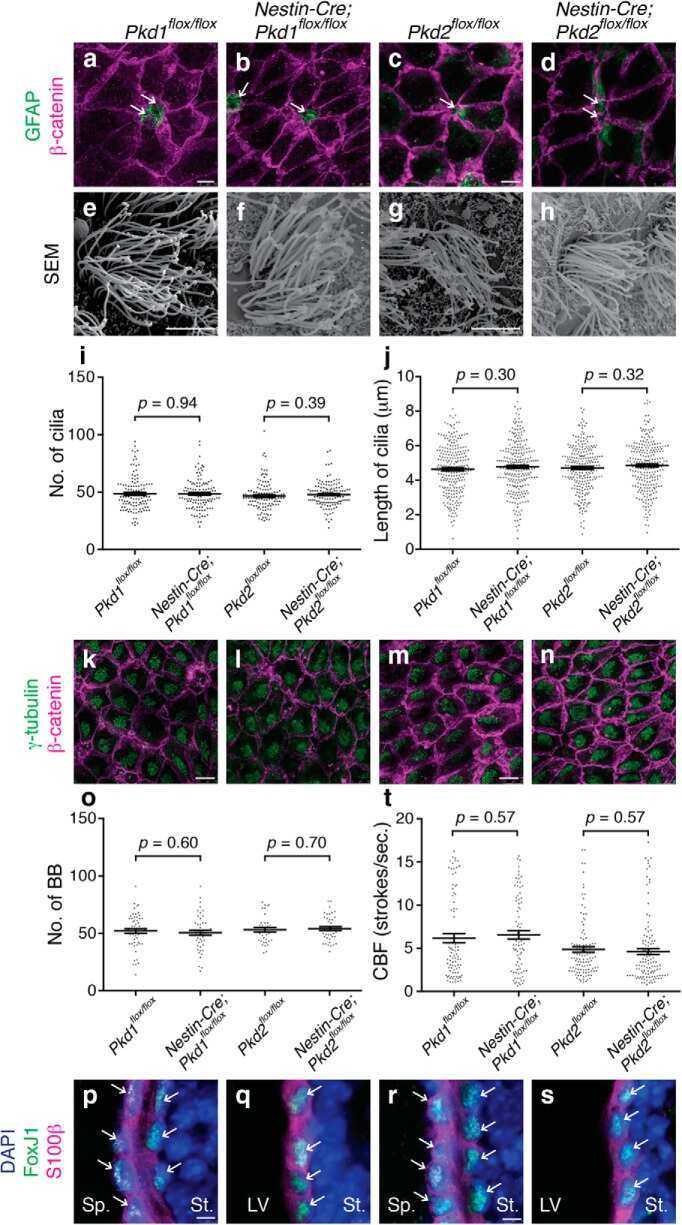
Mechanosensory Genes Pkd1 and Pkd2 Contribute to the Planar Polarization of Brain Ventricular Epithelium.
Repression of Igf1 expression by Ezh2 prevents basal cell differentiation in the developing lung.
The cell of origin and subtype of K-Ras-induced lung tumors are modified by Notch and Sox2.
Efficient generation of lung and airway epithelial cells from human pluripotent stem cells.
Loss of Dishevelleds disrupts planar polarity in ependymal motile cilia and results in hydrocephalus.
Dedifferentiation of committed epithelial cells into stem cells in vivo.
The establishment of rotational polarity in the airway and ependymal cilia: analysis with a novel cilium motility mutant mouse.
Generation of a human airway epithelium derived basal cell line with multipotent differentiation capacity.
Airway epithelial progenitors are region specific and show differential responses to bleomycin-induced lung injury.
Evidence for type II cells as cells of origin of K-Ras-induced distal lung adenocarcinoma.
Generation of multipotent lung and airway progenitors from mouse ESCs and patient-specific cystic fibrosis iPSCs.
Foxj1 transcription factors are master regulators of the motile ciliogenic program.
RhoA-mediated apical actin enrichment is required for ciliogenesis and promoted by Foxj1.
Restraint of B cell activation by Foxj1-mediated antagonism of NF-kappa B and IL-6.
Modulation of Th1 activation and inflammation by the NF-kappaB repressor Foxj1.
Yin W, Liontos A, Koepke J, Ghoul M, Mazzocchi L, Liu X, Lu C, Wu H, Fysikopoulos A, Sountoulidis A, Seeger W, Ruppert C, Günther A, Stainier DYR, Samakovlis C
Development (Cambridge, England) 2022 Feb 1;149(3)
Development (Cambridge, England) 2022 Feb 1;149(3)
Prominin 1 and Notch regulate ciliary length and dynamics in multiciliated cells of the airway epithelium.
Serra CFH, Liu H, Qian J, Mori M, Lu J, Cardoso WV
iScience 2022 Aug 19;25(8):104751
iScience 2022 Aug 19;25(8):104751
Engineering rotating apical-out airway organoid for assessing respiratory cilia motility.
Wijesekara P, Yadav P, Perkins LA, Stolz DB, Franks JM, Watkins SC, Reinoso Jacome E, Brody SL, Horani A, Xu J, Barati Farimani A, Ren X
iScience 2022 Aug 19;25(8):104730
iScience 2022 Aug 19;25(8):104730
Junctional Adhesion Molecule 3 Expression in the Mouse Airway Epithelium Is Linked to Multiciliated Cells.
Mateos-Quiros CM, Garrido-Jimenez S, Álvarez-Hernán G, Diaz-Chamorro S, Barrera-Lopez JF, Francisco-Morcillo J, Roman AC, Centeno F, Carvajal-Gonzalez JM
Frontiers in cell and developmental biology 2021;9:622515
Frontiers in cell and developmental biology 2021;9:622515
Distribution of Aldh1L1-CreER(T2) Recombination in Astrocytes Versus Neural Stem Cells in the Neurogenic Niches of the Adult Mouse Brain.
Beyer F, Lüdje W, Karpf J, Saher G, Beckervordersandforth R
Frontiers in neuroscience 2021;15:713077
Frontiers in neuroscience 2021;15:713077
ID4 Is Required for Normal Ependymal Cell Development.
Rocamonde B, Herranz-Pérez V, Garcia-Verdugo JM, Huillard E
Frontiers in neuroscience 2021;15:668243
Frontiers in neuroscience 2021;15:668243
Differentiation of mouse fetal lung alveolar progenitors in serum-free organotypic cultures.
Gkatzis K, Panza P, Peruzzo S, Stainier DY
eLife 2021 Sep 29;10
eLife 2021 Sep 29;10
Molecular diversity of diencephalic astrocytes reveals adult astrogenesis regulated by Smad4.
Ohlig S, Clavreul S, Thorwirth M, Simon-Ebert T, Bocchi R, Ulbricht S, Kannayian N, Rossner M, Sirko S, Smialowski P, Fischer-Sternjak J, Götz M
The EMBO journal 2021 Nov 2;40(21):e107532
The EMBO journal 2021 Nov 2;40(21):e107532
Transcriptional analysis of cystic fibrosis airways at single-cell resolution reveals altered epithelial cell states and composition.
Carraro G, Langerman J, Sabri S, Lorenzana Z, Purkayastha A, Zhang G, Konda B, Aros CJ, Calvert BA, Szymaniak A, Wilson E, Mulligan M, Bhatt P, Lu J, Vijayaraj P, Yao C, Shia DW, Lund AJ, Israely E, Rickabaugh TM, Ernst J, Mense M, Randell SH, Vladar EK, Ryan AL, Plath K, Mahoney JE, Stripp BR, Gomperts BN
Nature medicine 2021 May;27(5):806-814
Nature medicine 2021 May;27(5):806-814
SARS-CoV-2 infection of primary human lung epithelium for COVID-19 modeling and drug discovery.
Mulay A, Konda B, Garcia G Jr, Yao C, Beil S, Villalba JM, Koziol C, Sen C, Purkayastha A, Kolls JK, Pociask DA, Pessina P, de Aja JS, Garcia-de-Alba C, Kim CF, Gomperts B, Arumugaswami V, Stripp BR
Cell reports 2021 May 4;35(5):109055
Cell reports 2021 May 4;35(5):109055
Human-Induced Neural and Mesenchymal Stem Cell Therapy Combined with a Curcumin Nanoconjugate as a Spinal Cord Injury Treatment.
Bonilla P, Hernandez J, Giraldo E, González-Pérez MA, Alastrue-Agudo A, Elkhenany H, Vicent MJ, Navarro X, Edel M, Moreno-Manzano V
International journal of molecular sciences 2021 May 31;22(11)
International journal of molecular sciences 2021 May 31;22(11)
Pulmonary fibrosis distal airway epithelia are dynamically and structurally dysfunctional.
Stancil IT, Michalski JE, Davis-Hall D, Chu HW, Park JA, Magin CM, Yang IV, Smith BJ, Dobrinskikh E, Schwartz DA
Nature communications 2021 Jul 27;12(1):4566
Nature communications 2021 Jul 27;12(1):4566
Yap/Taz inhibit goblet cell fate to maintain lung epithelial homeostasis.
Hicks-Berthet J, Ning B, Federico A, Tilston-Lunel A, Matschulat A, Ai X, Lenburg ME, Beane J, Monti S, Varelas X
Cell reports 2021 Jul 13;36(2):109347
Cell reports 2021 Jul 13;36(2):109347
Androglobin gene expression patterns and FOXJ1-dependent regulation indicate its functional association with ciliogenesis.
Koay TW, Osterhof C, Orlando IMC, Keppner A, Andre D, Yousefian S, Suárez Alonso M, Correia M, Markworth R, Schödel J, Hankeln T, Hoogewijs D
The Journal of biological chemistry 2021 Jan-Jun;296:100291
The Journal of biological chemistry 2021 Jan-Jun;296:100291
BMP signaling suppresses Gemc1 expression and ependymal differentiation of mouse telencephalic progenitors.
Omiya H, Yamaguchi S, Watanabe T, Kuniya T, Harada Y, Kawaguchi D, Gotoh Y
Scientific reports 2021 Jan 12;11(1):613
Scientific reports 2021 Jan 12;11(1):613
Long noncoding RNA TINCR is a novel regulator of human bronchial epithelial cell differentiation state.
Omote N, Sakamoto K, Li Q, Schupp JC, Adams T, Ahangari F, Chioccioli M, DeIuliis G, Hashimoto N, Hasegawa Y, Kaminski N
Physiological reports 2021 Feb;9(3):e14727
Physiological reports 2021 Feb;9(3):e14727
Isolation, expansion, differentiation, and histological processing of human nasal epithelial cells.
Manna V, Caradonna S
STAR protocols 2021 Dec 17;2(4):100782
STAR protocols 2021 Dec 17;2(4):100782
Temporospatial Expression of Fgfr1 and 2 During Lung Development, Homeostasis, and Regeneration.
Yuan T, Klinkhammer K, Lyu H, Gao S, Yuan J, Hopkins S, Zhang JS, De Langhe SP
Frontiers in pharmacology 2020;11:120
Frontiers in pharmacology 2020;11:120
Generation of Complete Multi-Cell Type Lung Organoids From Human Embryonic and Patient-Specific Induced Pluripotent Stem Cells for Infectious Disease Modeling and Therapeutics Validation.
Leibel SL, McVicar RN, Winquist AM, Niles WD, Snyder EY
Current protocols in stem cell biology 2020 Sep;54(1):e118
Current protocols in stem cell biology 2020 Sep;54(1):e118
Fallopian Tube Basal Stem Cells Reproducing the Epithelial Sheets In Vitro-Stem Cell of Fallopian Epithelium.
Zhu M, Iwano T, Takeda S
Biomolecules 2020 Sep 3;10(9)
Biomolecules 2020 Sep 3;10(9)
Creation of Laryngeal Grafts from Primary Human Cells and Decellularized Laryngeal Scaffolds.
Moser PT, Gerli M, Diercks GR, Evangelista-Leite D, Charest JM, Gershlak JR, Ren X, Gilpin SE, Jank BJ, Gaudette GR, Hartnick CJ, Ott HC
Tissue engineering. Part A 2020 May;26(9-10):543-555
Tissue engineering. Part A 2020 May;26(9-10):543-555
Pathogenic DDX3X Mutations Impair RNA Metabolism and Neurogenesis during Fetal Cortical Development.
Lennox AL, Hoye ML, Jiang R, Johnson-Kerner BL, Suit LA, Venkataramanan S, Sheehan CJ, Alsina FC, Fregeau B, Aldinger KA, Moey C, Lobach I, Afenjar A, Babovic-Vuksanovic D, Bézieau S, Blackburn PR, Bunt J, Burglen L, Campeau PM, Charles P, Chung BHY, Cogné B, Curry C, D'Agostino MD, Di Donato N, Faivre L, Héron D, Innes AM, Isidor B, Keren B, Kimball A, Klee EW, Kuentz P, Küry S, Martin-Coignard D, Mirzaa G, Mignot C, Miyake N, Matsumoto N, Fujita A, Nava C, Nizon M, Rodriguez D, Blok LS, Thauvin-Robinet C, Thevenon J, Vincent M, Ziegler A, Dobyns W, Richards LJ, Barkovich AJ, Floor SN, Silver DL, Sherr EH
Neuron 2020 May 6;106(3):404-420.e8
Neuron 2020 May 6;106(3):404-420.e8
P73 C-terminus is dispensable for multiciliogenesis.
Buckley N, Panatta E, Morone N, Noguchi M, Scorrano L, Knight RA, Amelio I, Melino G
Cell cycle (Georgetown, Tex.) 2020 Jul;19(14):1833-1845
Cell cycle (Georgetown, Tex.) 2020 Jul;19(14):1833-1845
Airway epithelial cell differentiation relies on deficient Hedgehog signalling in COPD.
Belgacemi R, Luczka E, Ancel J, Diabasana Z, Perotin JM, Germain A, Lalun N, Birembaut P, Dubernard X, Mérol JC, Delepine G, Polette M, Deslée G, Dormoy V
EBioMedicine 2020 Jan;51:102572
EBioMedicine 2020 Jan;51:102572
Single-Cell Reconstruction of Human Basal Cell Diversity in Normal and Idiopathic Pulmonary Fibrosis Lungs.
Carraro G, Mulay A, Yao C, Mizuno T, Konda B, Petrov M, Lafkas D, Arron JR, Hogaboam CM, Chen P, Jiang D, Noble PW, Randell SH, McQualter JL, Stripp BR
American journal of respiratory and critical care medicine 2020 Dec 1;202(11):1540-1550
American journal of respiratory and critical care medicine 2020 Dec 1;202(11):1540-1550
Smooth Muscle Differentiation Is Essential for Airway Size, Tracheal Cartilage Segmentation, but Dispensable for Epithelial Branching.
Young RE, Jones MK, Hines EA, Li R, Luo Y, Shi W, Verheyden JM, Sun X
Developmental cell 2020 Apr 6;53(1):73-85.e5
Developmental cell 2020 Apr 6;53(1):73-85.e5
Chloride channels regulate differentiation and barrier functions of the mammalian airway.
He M, Wu B, Ye W, Le DD, Sinclair AW, Padovano V, Chen Y, Li KX, Sit R, Tan M, Caplan MJ, Neff N, Jan YN, Darmanis S, Jan LY
eLife 2020 Apr 14;9
eLife 2020 Apr 14;9
STK11 is required for the normal program of ciliated cell differentiation in airways.
Chu Q, Yao C, Qi X, Stripp BR, Tang N
Cell discovery 2019;5:36
Cell discovery 2019;5:36
Long-term surviving influenza infected cells evade CD8+ T cell mediated clearance.
Fiege JK, Stone IA, Dumm RE, Waring BM, Fife BT, Agudo J, Brown BD, Heaton NS, Langlois RA
PLoS pathogens 2019 Sep;15(9):e1008077
PLoS pathogens 2019 Sep;15(9):e1008077
Sensing of apoptotic cells through Axl causes lung basal cell proliferation in inflammatory diseases.
Fujino N, Brand OJ, Morgan DJ, Fujimori T, Grabiec AM, Jagger CP, Maciewicz RA, Yamada M, Itakura K, Sugiura H, Ichinose M, Hussell T
The Journal of experimental medicine 2019 Sep 2;216(9):2184-2201
The Journal of experimental medicine 2019 Sep 2;216(9):2184-2201
A Subset of Olfactory Sensory Neurons Express Forkhead Box J1-Driven eGFP.
Larson ED, Pathak S, Ramakrishnan VR, Finger TE
Chemical senses 2019 Oct 26;44(9):663-671
Chemical senses 2019 Oct 26;44(9):663-671
Jagged and Delta-like ligands control distinct events during airway progenitor cell differentiation.
Stupnikov MR, Yang Y, Mori M, Lu J, Cardoso WV
eLife 2019 Oct 21;8
eLife 2019 Oct 21;8
Dnmt1 is required for proximal-distal patterning of the lung endoderm and for restraining alveolar type 2 cell fate.
Liberti DC, Zepp JA, Bartoni CA, Liberti KH, Zhou S, Lu M, Morley MP, Morrisey EE
Developmental biology 2019 Oct 15;454(2):108-117
Developmental biology 2019 Oct 15;454(2):108-117
Non-lytic clearance of influenza B virus from infected cells preserves epithelial barrier function.
Dumm RE, Fiege JK, Waring BM, Kuo CT, Langlois RA, Heaton NS
Nature communications 2019 Feb 15;10(1):779
Nature communications 2019 Feb 15;10(1):779
E3 ubiquitin ligase MDM2 acts through p53 to control respiratory progenitor cell number and lung size.
Sui P, Li R, Zhang Y, Tan C, Garg A, Verheyden JM, Sun X
Development (Cambridge, England) 2019 Dec 16;146(24)
Development (Cambridge, England) 2019 Dec 16;146(24)
Adult Neural Stem Cells and Multiciliated Ependymal Cells Share a Common Lineage Regulated by the Geminin Family Members.
Ortiz-Álvarez G, Daclin M, Shihavuddin A, Lansade P, Fortoul A, Faucourt M, Clavreul S, Lalioti ME, Taraviras S, Hippenmeyer S, Livet J, Meunier A, Genovesio A, Spassky N
Neuron 2019 Apr 3;102(1):159-172.e7
Neuron 2019 Apr 3;102(1):159-172.e7
Characterization of the ventricular-subventricular stem cell niche during human brain development.
Coletti AM, Singh D, Kumar S, Shafin TN, Briody PJ, Babbitt BF, Pan D, Norton ES, Brown EC, Kahle KT, Del Bigio MR, Conover JC
Development (Cambridge, England) 2018 Oct 26;145(20)
Development (Cambridge, England) 2018 Oct 26;145(20)
CDC20B is required for deuterosome-mediated centriole production in multiciliated cells.
Revinski DR, Zaragosi LE, Boutin C, Ruiz-Garcia S, Deprez M, Thomé V, Rosnet O, Gay AS, Mercey O, Paquet A, Pons N, Ponzio G, Marcet B, Kodjabachian L, Barbry P
Nature communications 2018 Nov 7;9(1):4668
Nature communications 2018 Nov 7;9(1):4668
Developmental History Provides a Roadmap for the Emergence of Tumor Plasticity.
Tata PR, Chow RD, Saladi SV, Tata A, Konkimalla A, Bara A, Montoro D, Hariri LP, Shih AR, Mino-Kenudson M, Mou H, Kimura S, Ellisen LW, Rajagopal J
Developmental cell 2018 Mar 26;44(6):679-693.e5
Developmental cell 2018 Mar 26;44(6):679-693.e5
Expansion of Airway Basal Cells and Generation of Polarized Epithelium.
Levardon H, Yonker LM, Hurley BP, Mou H
Bio-protocol 2018 Jun 5;8(11)
Bio-protocol 2018 Jun 5;8(11)
Bronchial extracellular matrix from COPD patients induces altered gene expression in repopulated primary human bronchial epithelial cells.
Hedström U, Hallgren O, Öberg L, DeMicco A, Vaarala O, Westergren-Thorsson G, Zhou X
Scientific reports 2018 Feb 22;8(1):3502
Scientific reports 2018 Feb 22;8(1):3502
The mouse Jhy gene regulates ependymal cell differentiation and ciliogenesis.
Muniz-Talavera H, Schmidt JV
PloS one 2017;12(12):e0184957
PloS one 2017;12(12):e0184957
Cell cycle-targeting microRNAs promote differentiation by enforcing cell-cycle exit.
Otto T, Candido SV, Pilarz MS, Sicinska E, Bronson RT, Bowden M, Lachowicz IA, Mulry K, Fassl A, Han RC, Jecrois ES, Sicinski P
Proceedings of the National Academy of Sciences of the United States of America 2017 Oct 3;114(40):10660-10665
Proceedings of the National Academy of Sciences of the United States of America 2017 Oct 3;114(40):10660-10665
Forkhead Box Protein J1 (FOXJ1) is Overexpressed in Colorectal Cancer and Promotes Nuclear Translocation of β-Catenin in SW620 Cells.
Liu K, Fan J, Wu J
Medical science monitor : international medical journal of experimental and clinical research 2017 Feb 17;23:856-866
Medical science monitor : international medical journal of experimental and clinical research 2017 Feb 17;23:856-866
Spontaneous Chitin Accumulation in Airways and Age-Related Fibrotic Lung Disease.
Van Dyken SJ, Liang HE, Naikawadi RP, Woodruff PG, Wolters PJ, Erle DJ, Locksley RM
Cell 2017 Apr 20;169(3):497-509.e13
Cell 2017 Apr 20;169(3):497-509.e13
A bioengineered niche promotes in vivo engraftment and maturation of pluripotent stem cell derived human lung organoids.
Dye BR, Dedhia PH, Miller AJ, Nagy MS, White ES, Shea LD, Spence JR
eLife 2016 Sep 28;5
eLife 2016 Sep 28;5
Rare SOX2(+) Airway Progenitor Cells Generate KRT5(+) Cells that Repopulate Damaged Alveolar Parenchyma following Influenza Virus Infection.
Ray S, Chiba N, Yao C, Guan X, McConnell AM, Brockway B, Que L, McQualter JL, Stripp BR
Stem cell reports 2016 Nov 8;7(5):817-825
Stem cell reports 2016 Nov 8;7(5):817-825
An in vitro model of murine middle ear epithelium.
Mulay A, Akram KM, Williams D, Armes H, Russell C, Hood D, Armstrong S, Stewart JP, Brown SD, Bingle L, Bingle CD
Disease models & mechanisms 2016 Nov 1;9(11):1405-1417
Disease models & mechanisms 2016 Nov 1;9(11):1405-1417
GEMC1 is a critical regulator of multiciliated cell differentiation.
Terré B, Piergiovanni G, Segura-Bayona S, Gil-Gómez G, Youssef SA, Attolini CS, Wilsch-Bräuninger M, Jung C, Rojas AM, Marjanović M, Knobel PA, Palenzuela L, López-Rovira T, Forrow S, Huttner WB, Valverde MA, de Bruin A, Costanzo V, Stracker TH
The EMBO journal 2016 May 2;35(9):942-60
The EMBO journal 2016 May 2;35(9):942-60
Zbtb20 promotes astrocytogenesis during neocortical development.
Nagao M, Ogata T, Sawada Y, Gotoh Y
Nature communications 2016 Mar 22;7:11102
Nature communications 2016 Mar 22;7:11102
KLF4 regulates adult lung tumor-initiating cells and represses K-Ras-mediated lung cancer.
Yu T, Chen X, Zhang W, Liu J, Avdiushko R, Napier DL, Liu AX, Neltner JM, Wang C, Cohen D, Liu C
Cell death and differentiation 2016 Feb;23(2):207-15
Cell death and differentiation 2016 Feb;23(2):207-15
Dual SMAD Signaling Inhibition Enables Long-Term Expansion of Diverse Epithelial Basal Cells.
Mou H, Vinarsky V, Tata PR, Brazauskas K, Choi SH, Crooke AK, Zhang B, Solomon GM, Turner B, Bihler H, Harrington J, Lapey A, Channick C, Keyes C, Freund A, Artandi S, Mense M, Rowe S, Engelhardt JF, Hsu YC, Rajagopal J
Cell stem cell 2016 Aug 4;19(2):217-231
Cell stem cell 2016 Aug 4;19(2):217-231
Sonic Hedgehog promotes proliferation of Notch-dependent monociliated choroid plexus tumour cells.
Li L, Grausam KB, Wang J, Lun MP, Ohli J, Lidov HG, Calicchio ML, Zeng E, Salisbury JL, Wechsler-Reya RJ, Lehtinen MK, Schüller U, Zhao H
Nature cell biology 2016 Apr;18(4):418-30
Nature cell biology 2016 Apr;18(4):418-30
An FGFR1-SPRY2 Signaling Axis Limits Basal Cell Proliferation in the Steady-State Airway Epithelium.
Balasooriya GI, Johnson JA, Basson MA, Rawlins EL
Developmental cell 2016 Apr 4;37(1):85-97
Developmental cell 2016 Apr 4;37(1):85-97
Lin41/Trim71 is essential for mouse development and specifically expressed in postnatal ependymal cells of the brain.
Cuevas E, Rybak-Wolf A, Rohde AM, Nguyen DT, Wulczyn FG
Frontiers in cell and developmental biology 2015;3:20
Frontiers in cell and developmental biology 2015;3:20
GRHL2 coordinates regeneration of a polarized mucociliary epithelium from basal stem cells.
Gao X, Bali AS, Randell SH, Hogan BL
The Journal of cell biology 2015 Nov 9;211(3):669-82
The Journal of cell biology 2015 Nov 9;211(3):669-82
The in vitro generation of lung and airway progenitor cells from human pluripotent stem cells.
Huang SX, Green MD, de Carvalho AT, Mumau M, Chen YW, D'Souza SL, Snoeck HW
Nature protocols 2015 Mar;10(3):413-25
Nature protocols 2015 Mar;10(3):413-25
The LIM-domain only protein 4 contributes to lung epithelial cell proliferation but is not essential for tumor progression.
Holik AZ, Filby CE, Pasquet J, Viitaniemi K, Ciciulla J, Sutherland KD, Asselin-Labat ML
Respiratory research 2015 Jun 7;16(1):67
Respiratory research 2015 Jun 7;16(1):67
Parent stem cells can serve as niches for their daughter cells.
Pardo-Saganta A, Tata PR, Law BM, Saez B, Chow RD, Prabhu M, Gridley T, Rajagopal J
Nature 2015 Jul 30;523(7562):597-601
Nature 2015 Jul 30;523(7562):597-601
Injury induces direct lineage segregation of functionally distinct airway basal stem/progenitor cell subpopulations.
Pardo-Saganta A, Law BM, Tata PR, Villoria J, Saez B, Mou H, Zhao R, Rajagopal J
Cell stem cell 2015 Feb 5;16(2):184-97
Cell stem cell 2015 Feb 5;16(2):184-97
Mechanosensory Genes Pkd1 and Pkd2 Contribute to the Planar Polarization of Brain Ventricular Epithelium.
Ohata S, Herranz-Pérez V, Nakatani J, Boletta A, García-Verdugo JM, Álvarez-Buylla A
The Journal of neuroscience : the official journal of the Society for Neuroscience 2015 Aug 5;35(31):11153-68
The Journal of neuroscience : the official journal of the Society for Neuroscience 2015 Aug 5;35(31):11153-68
Repression of Igf1 expression by Ezh2 prevents basal cell differentiation in the developing lung.
Galvis LA, Holik AZ, Short KM, Pasquet J, Lun AT, Blewitt ME, Smyth IM, Ritchie ME, Asselin-Labat ML
Development (Cambridge, England) 2015 Apr 15;142(8):1458-69
Development (Cambridge, England) 2015 Apr 15;142(8):1458-69
The cell of origin and subtype of K-Ras-induced lung tumors are modified by Notch and Sox2.
Xu X, Huang L, Futtner C, Schwab B, Rampersad RR, Lu Y, Sporn TA, Hogan BL, Onaitis MW
Genes & development 2014 Sep 1;28(17):1929-39
Genes & development 2014 Sep 1;28(17):1929-39
Efficient generation of lung and airway epithelial cells from human pluripotent stem cells.
Huang SX, Islam MN, O'Neill J, Hu Z, Yang YG, Chen YW, Mumau M, Green MD, Vunjak-Novakovic G, Bhattacharya J, Snoeck HW
Nature biotechnology 2014 Jan;32(1):84-91
Nature biotechnology 2014 Jan;32(1):84-91
Loss of Dishevelleds disrupts planar polarity in ependymal motile cilia and results in hydrocephalus.
Ohata S, Nakatani J, Herranz-Pérez V, Cheng J, Belinson H, Inubushi T, Snider WD, García-Verdugo JM, Wynshaw-Boris A, Alvarez-Buylla A
Neuron 2014 Aug 6;83(3):558-71
Neuron 2014 Aug 6;83(3):558-71
Dedifferentiation of committed epithelial cells into stem cells in vivo.
Tata PR, Mou H, Pardo-Saganta A, Zhao R, Prabhu M, Law BM, Vinarsky V, Cho JL, Breton S, Sahay A, Medoff BD, Rajagopal J
Nature 2013 Nov 14;503(7475):218-23
Nature 2013 Nov 14;503(7475):218-23
The establishment of rotational polarity in the airway and ependymal cilia: analysis with a novel cilium motility mutant mouse.
Matsuo M, Shimada A, Koshida S, Saga Y, Takeda H
American journal of physiology. Lung cellular and molecular physiology 2013 Jun 1;304(11):L736-45
American journal of physiology. Lung cellular and molecular physiology 2013 Jun 1;304(11):L736-45
Generation of a human airway epithelium derived basal cell line with multipotent differentiation capacity.
Walters MS, Gomi K, Ashbridge B, Moore MA, Arbelaez V, Heldrich J, Ding BS, Rafii S, Staudt MR, Crystal RG
Respiratory research 2013 Dec 3;14(1):135
Respiratory research 2013 Dec 3;14(1):135
Airway epithelial progenitors are region specific and show differential responses to bleomycin-induced lung injury.
Chen H, Matsumoto K, Brockway BL, Rackley CR, Liang J, Lee JH, Jiang D, Noble PW, Randell SH, Kim CF, Stripp BR
Stem cells (Dayton, Ohio) 2012 Sep;30(9):1948-60
Stem cells (Dayton, Ohio) 2012 Sep;30(9):1948-60
Evidence for type II cells as cells of origin of K-Ras-induced distal lung adenocarcinoma.
Xu X, Rock JR, Lu Y, Futtner C, Schwab B, Guinney J, Hogan BL, Onaitis MW
Proceedings of the National Academy of Sciences of the United States of America 2012 Mar 27;109(13):4910-5
Proceedings of the National Academy of Sciences of the United States of America 2012 Mar 27;109(13):4910-5
Generation of multipotent lung and airway progenitors from mouse ESCs and patient-specific cystic fibrosis iPSCs.
Mou H, Zhao R, Sherwood R, Ahfeldt T, Lapey A, Wain J, Sicilian L, Izvolsky K, Musunuru K, Cowan C, Rajagopal J
Cell stem cell 2012 Apr 6;10(4):385-97
Cell stem cell 2012 Apr 6;10(4):385-97
Foxj1 transcription factors are master regulators of the motile ciliogenic program.
Yu X, Ng CP, Habacher H, Roy S
Nature genetics 2008 Dec;40(12):1445-53
Nature genetics 2008 Dec;40(12):1445-53
RhoA-mediated apical actin enrichment is required for ciliogenesis and promoted by Foxj1.
Pan J, You Y, Huang T, Brody SL
Journal of cell science 2007 Jun 1;120(Pt 11):1868-76
Journal of cell science 2007 Jun 1;120(Pt 11):1868-76
Restraint of B cell activation by Foxj1-mediated antagonism of NF-kappa B and IL-6.
Lin L, Brody SL, Peng SL
Journal of immunology (Baltimore, Md. : 1950) 2005 Jul 15;175(2):951-8
Journal of immunology (Baltimore, Md. : 1950) 2005 Jul 15;175(2):951-8
Modulation of Th1 activation and inflammation by the NF-kappaB repressor Foxj1.
Lin L, Spoor MS, Gerth AJ, Brody SL, Peng SL
Science (New York, N.Y.) 2004 Feb 13;303(5660):1017-20
Science (New York, N.Y.) 2004 Feb 13;303(5660):1017-20
No comments: Submit comment
Supportive validation
- Submitted by
- Invitrogen Antibodies (provider)
- Main image
- Experimental details
- NULL
- Submitted by
- Invitrogen Antibodies (provider)
- Main image
- Experimental details
- NULL
- Submitted by
- Invitrogen Antibodies (provider)
- Main image
- Experimental details
- NULL
- Submitted by
- Invitrogen Antibodies (provider)
- Main image
- Experimental details
- NULL
- Submitted by
- Invitrogen Antibodies (provider)
- Main image
- Experimental details
- NULL
- Submitted by
- Invitrogen Antibodies (provider)
- Main image
- Experimental details
- NULL
- Submitted by
- Invitrogen Antibodies (provider)
- Main image
- Experimental details
- NULL
- Submitted by
- Invitrogen Antibodies (provider)
- Main image
- Experimental details
- NULL

- Submitted by
- Invitrogen Antibodies (provider)
- Main image
- Experimental details
- NULL
- Submitted by
- Invitrogen Antibodies (provider)
- Main image
- Experimental details
- NULL
- Submitted by
- Invitrogen Antibodies (provider)
- Main image
- Experimental details
- NULL
- Submitted by
- Invitrogen Antibodies (provider)
- Main image
- Experimental details
- NULL
- Submitted by
- Invitrogen Antibodies (provider)
- Main image
- Experimental details
- NULL
- Submitted by
- Invitrogen Antibodies (provider)
- Main image
- Experimental details
- NULL
- Submitted by
- Invitrogen Antibodies (provider)
- Main image
- Experimental details
- NULL

- Submitted by
- Invitrogen Antibodies (provider)
- Main image
- Experimental details
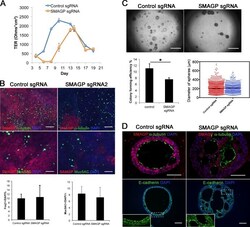
- Figure 6. Effect of mutation of SMAGP on phenotype of HBE cells. (A) ALI cultures were tested for TER as described in Materials and methods (section HBE cell culture). Values are mean and SEM of triplicate wells, and data are from one of n = 3 biological replicates. (B) Whole-mount IHC of control and SMAGP mutant cultures at ALI day 21 for Smagp, Foxj1, and Muc5AC. A few small patches of Smagp + cells are present in the cultures of mutant cells. Bottom panel is quantification of the proportion of ciliated and secretory cells. Values are mean and SEM of duplicate/triplicate wells from one of three donor samples. P > 0.05. (C, top) Representative DIC microscopy images of spheres at day 21. (Bottom) The CFE of SMAGP sgRNA mutant cells is decreased compared with control. However, the diameters of control and mutant spheres are similar. *, P > 0.05. Spheres were analyzed in triplicate wells from three biological replicates. Horizontal bars represent mean. Data are reported as mean +- SEM. (D) At day 21, spheres were fixed, sectioned, and stained for SMAGP, alpha-tubulin or E-cadherin, and DAPI (blue). Insets are higher magnification of the boxed regions. Bars: (B and D) 100 um; (C) 2 mm.
- Submitted by
- Invitrogen Antibodies (provider)
- Main image
- Experimental details
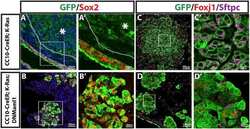
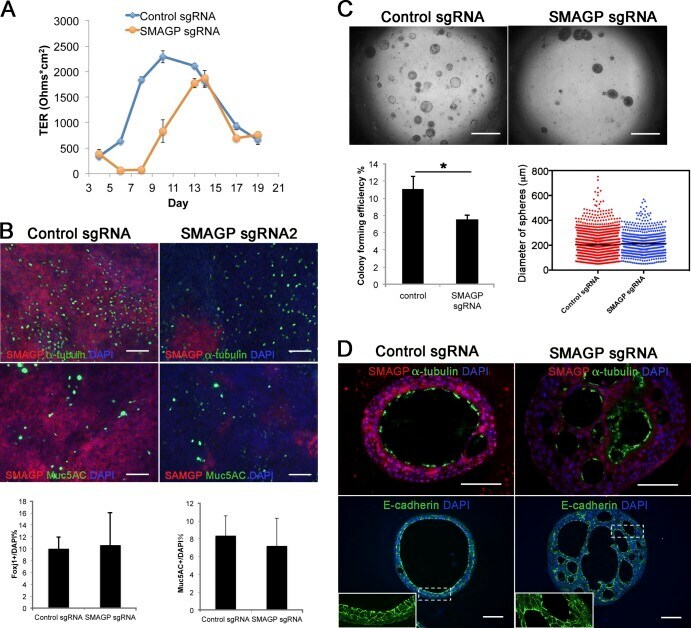
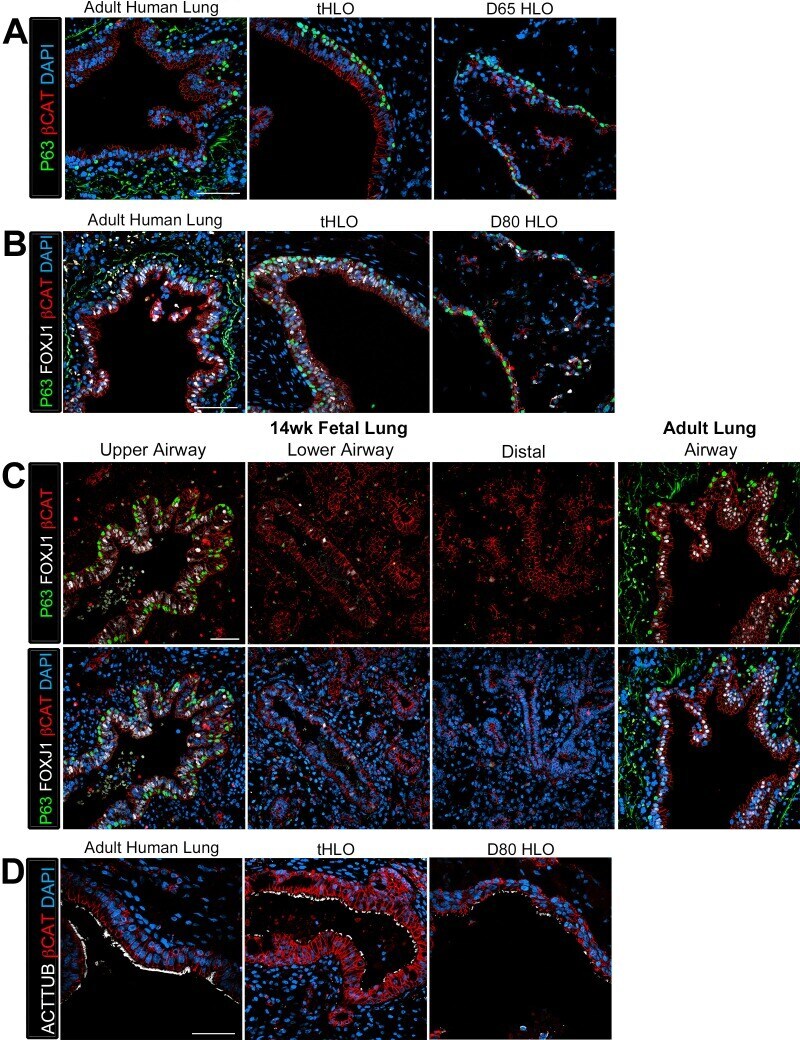
- Figure 2--figure supplement 1. Human airways, in vitro grown HLOs, and transplanted HLOs express airway markers. ( A - B ) Adult human lung, tHLOs, and 80d HLOs express the basal cell marker P63 (green) and the ciliated cell marker FOXJ1 (white, B ). ( C ) 14 wk fetal lung upper airway and adult lung airway express P63 (green) and FOXJ1 (white) whereas little to no P63 and FOXJ1 is observed in the fetal lower airways and fetal distal bud tips. ( D ) Cells facing in toward the lumen were multiciliated and stained positive for acetylated tubulin (ACTTUB, white) . Scale bars in A - D represent 50 um. DOI: http://dx.doi.org/
- Submitted by
- Invitrogen Antibodies (provider)
- Main image
- Experimental details
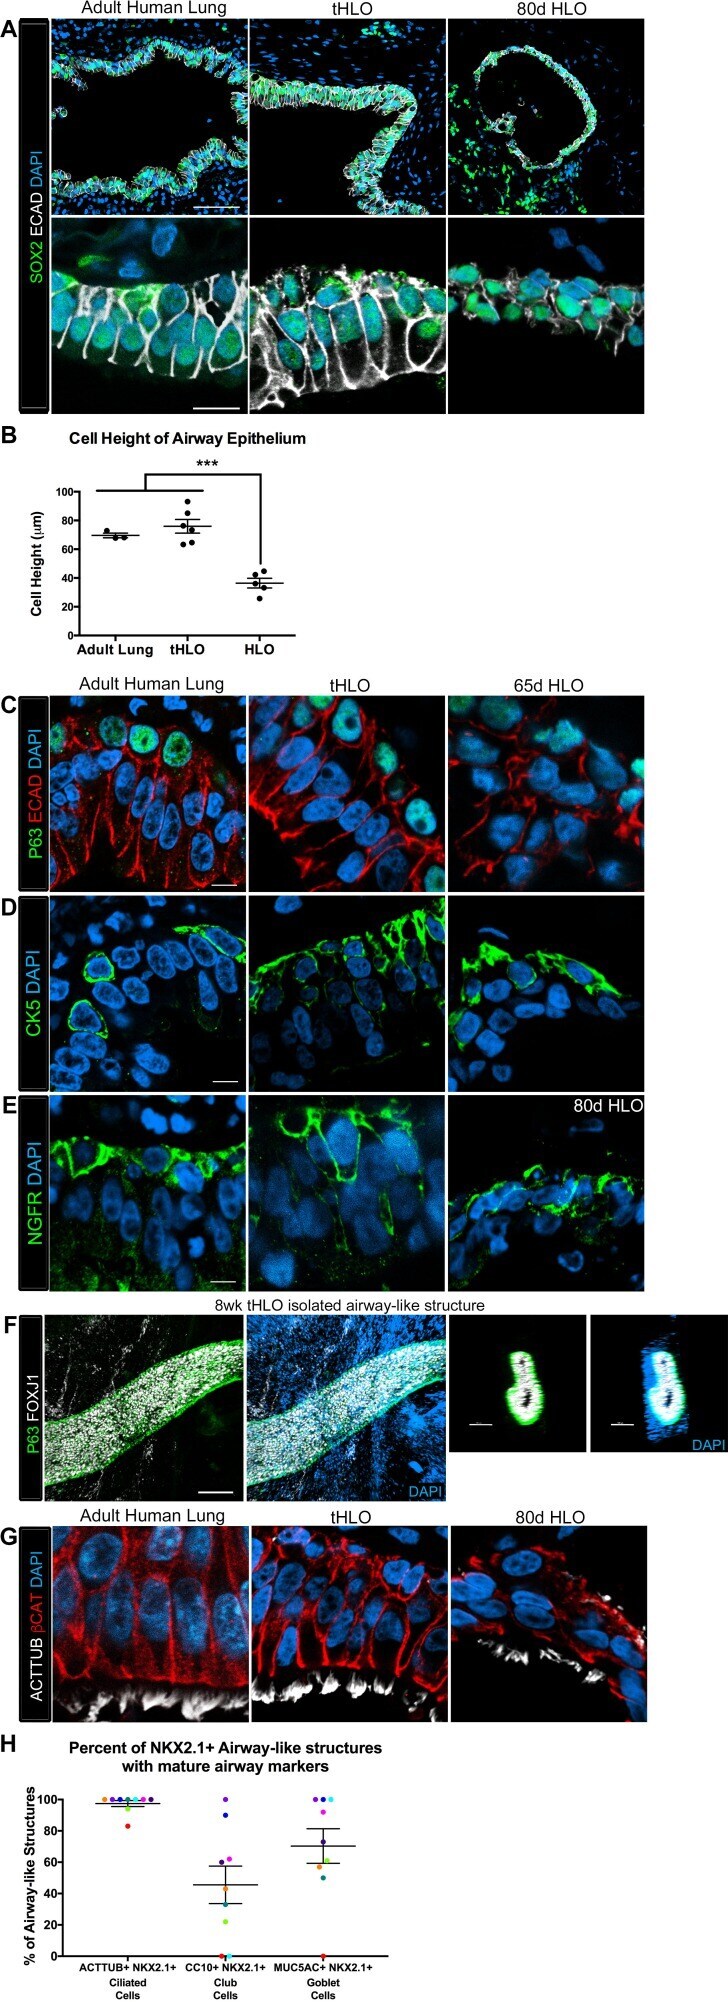
- Figure 2. Transplanted HLO-scaffold constructs harvested at 8 weeks possessed mature airway-like structures and had an enhanced epithelial structure. ( A ) Adult human lung, tHLOs and 80d HLOs possess SOX2+ (green) epithelium marked by ECAD (white). Only adult lung airways and tHLO airway-like structures possessed a pseudostratified epithelium (ECAD, white). Scale bars represent 50 um in low mag images and 10 um in high mag. ( B ) Measurements of cell height were taken from adult human lung (n = 3), tHLO (n = 5), and HLO (n = 6) airways of cells facing toward the lumen. Averages were adult: 69.59 um +- 1.65, tHLO: 75.69 um +- 4.74, HLO = 36.39 um +- 3.39. *** represents p
- Submitted by
- Invitrogen Antibodies (provider)
- Main image
- Experimental details
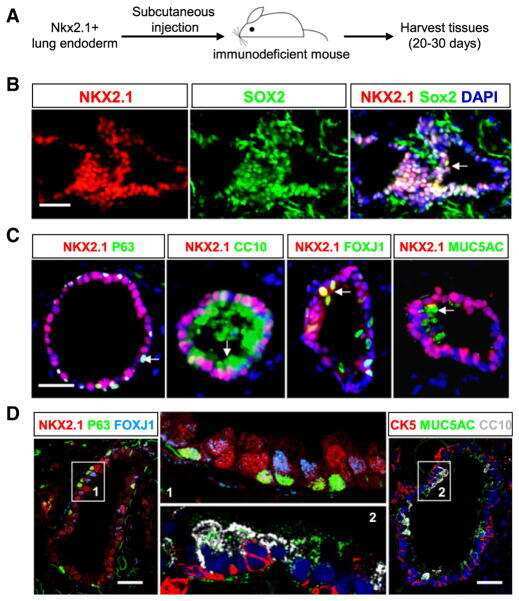
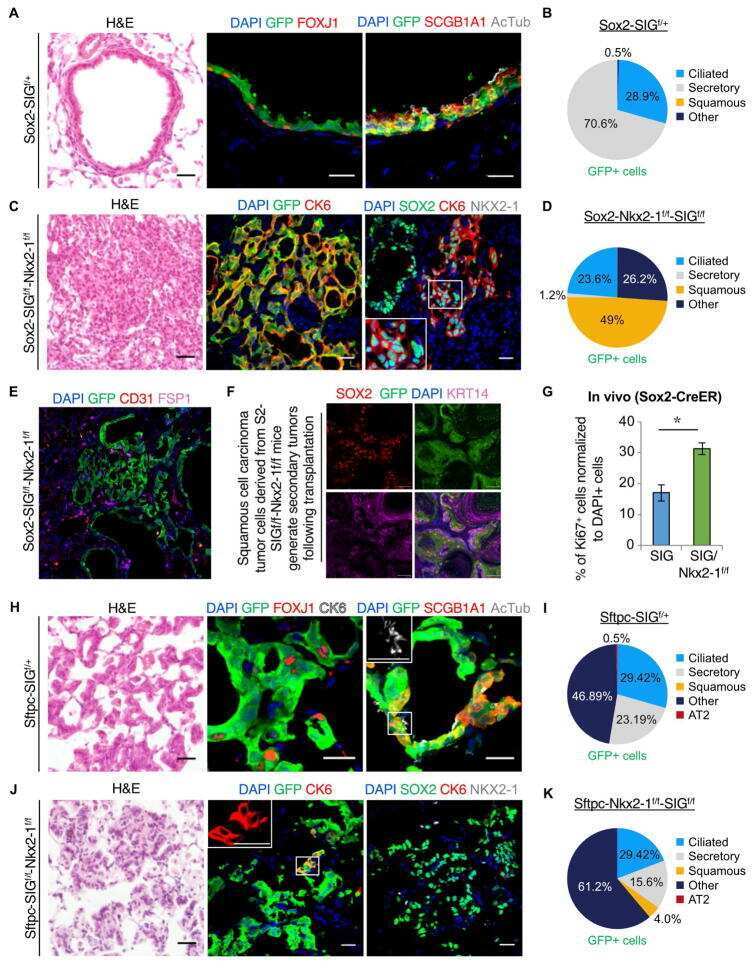
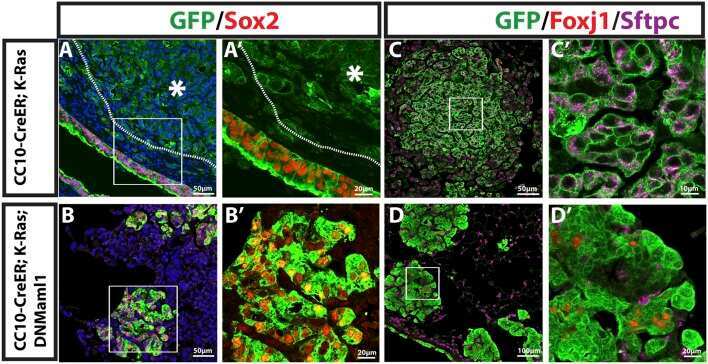
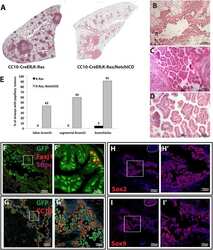
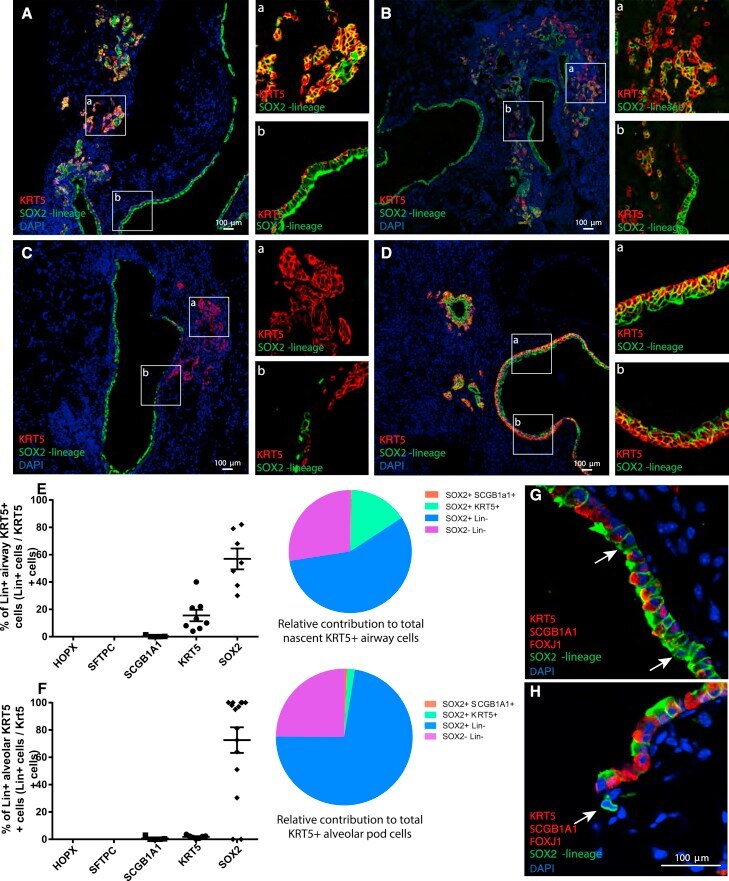
- Figure 3 Pre-existing SOX2 + Cells Are the Major Cellular Source of KRT5 + Cells after PR8 Infection Sox2-CreER , Rosa-mTmG mice treated with tamoxifen to lineage label airway epithelial cells were infected with PR8 influenza virus and killed 14 and 21 post infection. Photomicrographs (A-D) showing representative lung tissue sections immunostained for KRT5 (red), lineage markers (green), and DAPI (blue) (A-D). Scale bars, 100 mum. Scatterplots and pie charts show the quantitation and relative contribution, respectively, of HOPX, SFTPC, SCGB1A1, KRT5, and SOX2 cell lineages toward airway (E) and alveolar (F) KRT5 + cells after PR8 infection. Individual dots represent cells per animal (E) or cells per pod (F). Data include means +- SEM. Photomicrographs (G and H) show representative lung tissue sections from uninjured animals immunostained for KRT5, SCGB1A1, and FOXJ1 (red), lineage marker (green), and DAPI (blue). Arrows identify SOX2 + Lin - cells. At least three animals were analyzed per time point. See also Figures S1-S3 and Table S1 .
- Submitted by
- Invitrogen Antibodies (provider)
- Main image
- Experimental details
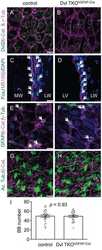
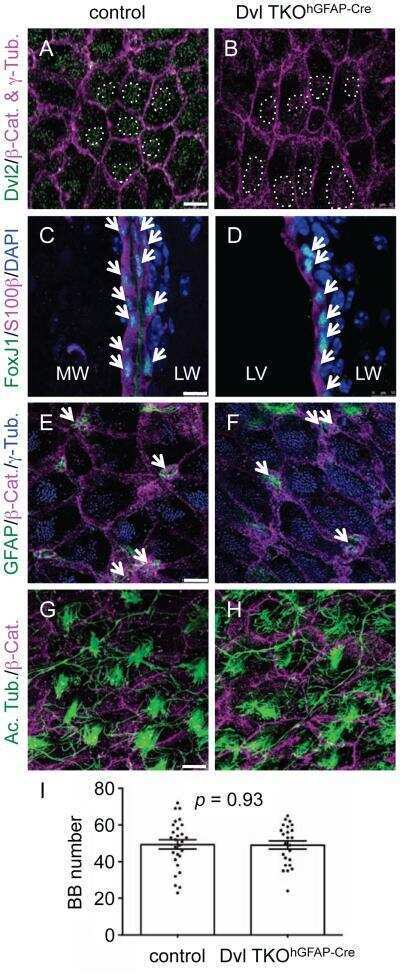
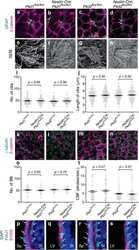
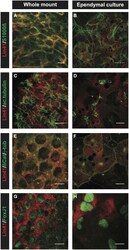
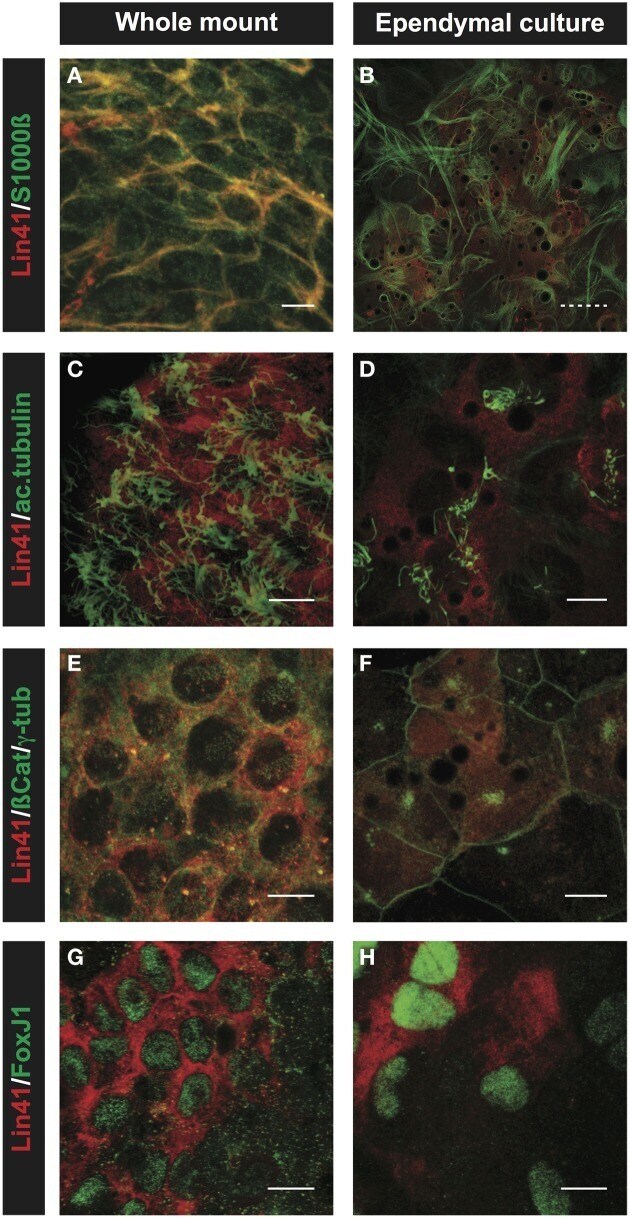
- Figure 6 Comparison of ependymal LIN41 expression in whole mount immunostaining and primary cell culture . Immunostaining of lateral wall whole mounts from adult wild type mouse brain (left column) and primary ependymal culture derived from newborn brain tissue at DIV15 (right column). LIN41 immunostaining is in red, marker antibodies in green. S100ss is an ependymal marker (A,B) , acetylated alpha-tubulin (ac.tubulin) stains the cilia (C,D) , ss-Catenin is used to label the cell-cell contacts and gamma-tubulin the basal bodies of the cilia (E,F) . FoxJ1 is a nuclear transcription factor responsible for the multicilia differentiation program (G,H) . Scale bar 10 mum except for (B) , with dashed line 40 mum.
- Submitted by
- Invitrogen Antibodies (provider)
- Main image
- Experimental details
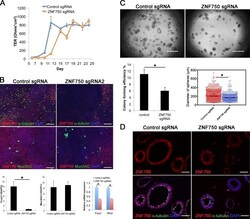
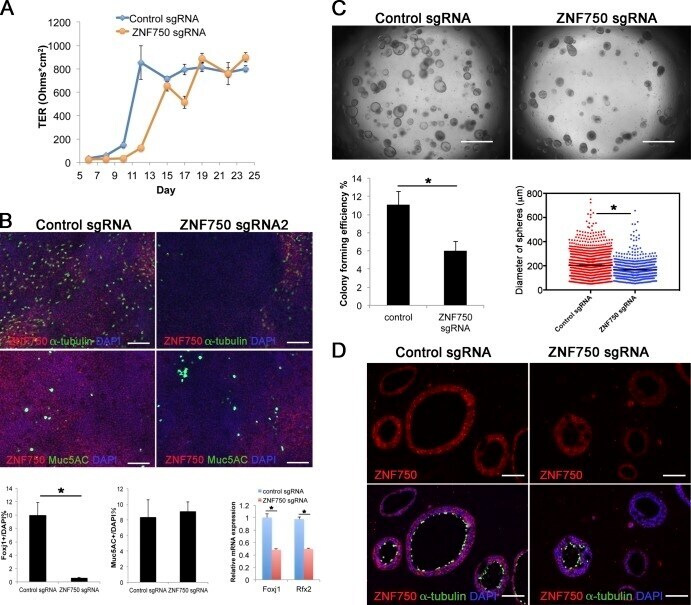
- Figure 7. Effect of mutation of ZNF750 on phenotype of HBE cells. (A) ALI cultures were tested for TER as described in Materials and methods (section HBE cell culture). Values are mean and SEM of triplicate wells, and data are from one of n = 3 donor samples. (B, top) Whole-mount IHC of control and ZNF750 mutant cultures at day 21 ALI stained for alpha-tubulin, Muc5AC, and Znf750. (Bottom) Proportion of ciliated and secretory cells in ALI culture. (Bottom right) qRT-PCR analysis of FoxJ1 and Rfx2 RNA in control and ZNF750 mutant cells cultured in ALI for 21 d. Values are mean and SEM of triplicate wells from one of three donor samples. *, P < 0.05. (C, top) Representative DIC microscopy images of spheres at day 21. (Bottom) CFE of ZNF750 sgRNA mutant cells is decreased compared with control, and the diameters of mutant spheres are smaller. *, P < 0.05. Spheres were analyzed in triplicate wells from three donor samples. Horizontal bars represent mean. Data are reported as mean +- SEM. (D) At day 21, spheres were fixed, sectioned, and stained for ZNF750 and alpha-tubulin. Note that the spheres that do not express ZNF750 do not have ciliated cells. Bars: (B and D) 100 um; (C) 2 mm.
- Submitted by
- Invitrogen Antibodies (provider)
- Main image
- Experimental details
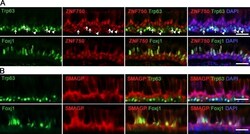
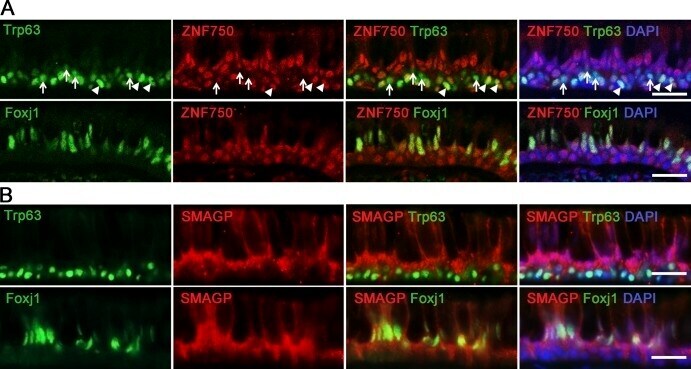
- Figure 8. Localization of ZNF750 and SMAGP proteins in human airway epithelial cells. (A) IHC of section through human lung (6-mm-diameter airway) for ZNF750, Trp63 (top), Foxj1 (bottom), and DAPI. Note that some Trp63 + BCs express ZNF750 (arrowheads), whereas others do not (arrows). (B) IHC for SMAGP, Trp63 (top), Foxj1 (bottom), and DAPI. Single images from confocal stacks. Bars, 25 um.
- Submitted by
- Invitrogen Antibodies (provider)
- Main image
- Experimental details
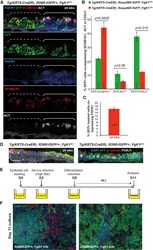
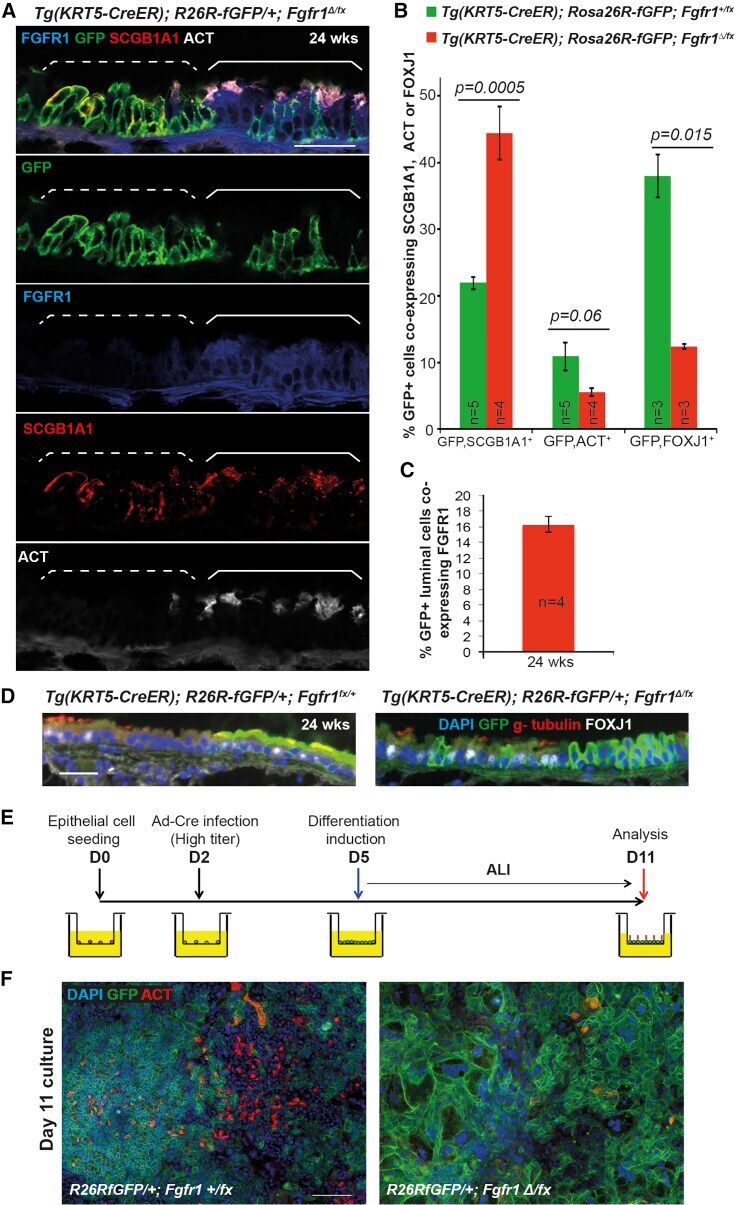
- Figure 4 Loss of FGFR1 Signaling Results in a Block in Ciliated Cell Differentiation (A) Confocal image of Tg ( KRT5-CreER ); Rosa26R fGFP/+ ; Fgfr1 Delta/fx tracheal section. Green, GFP (reporter); blue, FGFR1; red, SCGB1A1 (secretory cells); white, acetylated tubulin (ACT, cilia). In the patch of GFP + cells marked by the dashed bracket, FGFR1 is absent and there are no ciliated cells. In the GFP + cells within the solid bracket, FGFR1 has not been deleted, there are fewer GFP + cells, and ciliated cell differentiation has occurred. (B) Percentage of GFP + cells that co-express SCGB1A1, ACT, or FOXJ1 in control Tg ( KRT5-CreER ); Rosa26R fGFP/+ ; Fgfr1 +/fx and cKO Tg ( KRT5-CreER ); Rosa26R fGFP/+ ; Fgfr1 Delta/fx animals 24 weeks after tmx administration. (C) Percentage of GFP + luminal cells in cKO Tg ( KRT5-CreER ); Rosa26R fGFP/+ ; Fgfr1 Delta/fx trachea that retain FGFR1 protein 24 weeks after tmx administration. (D) Sections from control and Fgfr1 cKO tracheae at 24 weeks after tmx administration. Green, GFP (reporter); red, gamma-tubulin (basal bodies); white, FOXJ1 (ciliated cells). (E) Schematic of in vitro experiment. (F) Day-11 ALI cultures grown from control and Fgfr1 cKO animals. Green, GFP (reporter); red, ACT (cilia); blue, DAPI (nuclei). Error bars denote SEM. Scale bars represent 100 mum in (A) and (F), and 50 mum in (D).
- Submitted by
- Invitrogen Antibodies (provider)
- Main image
- Experimental details
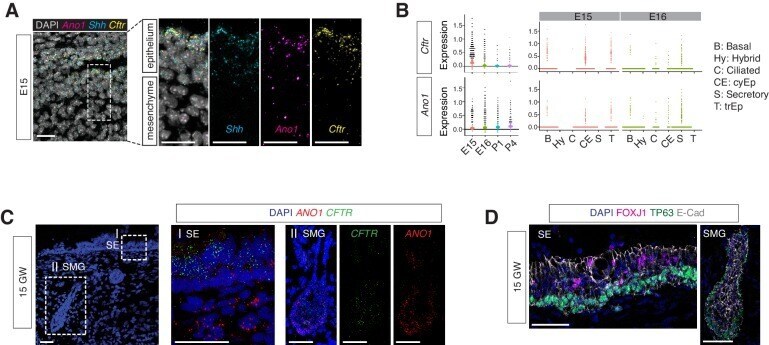
- Figure 6. Expressions of Ano1 and Cftr in embryonic and fetal airways. ( A ) Expression of Shh , Cftr , and Ano1 in E15 trachea examined by FISH. Shh marks tracheal epithelial cells. Nuclei are stained by DAPI (white). Scale bar indicates 20 mu m. ( B ) Expression of Cftr and Ano1 in tracheal epithelial cells at different time points, with a cell type breakdown for E15 and E16. Expressions of Cftr and Ano1 in neonatal tracheal epithelial cells are shown in Figure 6--figure supplement 1 . ( C ) Expression of CFTR and ANO1 in human fetal trachea of GW 15 by FISH. Two areas (I: surface epithelium/SE; II: submucosal glands/SMG) of the fetal tracheal epithelium are enlarged. Nuclei are stained by DAPI (blue). Scale bar indicates 50 mu m. ( D ) Immunofluorescence staining of TP63 (green) and FOXJ1 (magenta) in human fetal tracheal sample at GW 15. SE and SMG are shown. Ciliated cells are only present in the surface epithelial cell layer. Epithelial cells are marked by E-cad in white. Nuclei are stained by DAPI (blue). Scale bar indicates 50 mu m. Figure 6--figure supplement 1. Expansion of the secretory cell lineage in global and conditional Ano1 knockouts. ( A ) Cellular composition for tracheal epithelial cells of wild-type littermates and Ano1 -/- mutants from different time points. ( B ) scGPS showing cell-cycle gene expression in every epithelial cell state at E16 in wild-type and Ano1 -/- mutant embryos. scGPS (single-cell Geneset Percentile Score) is an expression enrichment
- Submitted by
- Invitrogen Antibodies (provider)
- Main image
- Experimental details
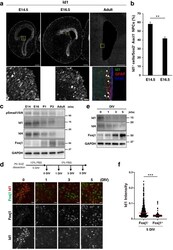
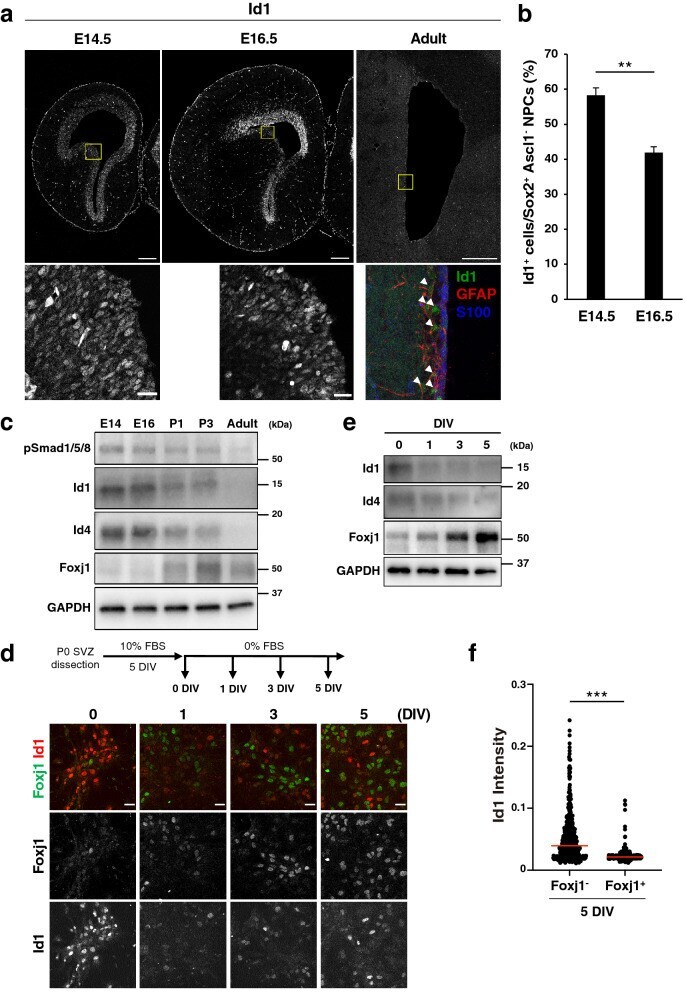
- Figure 1 BMP signaling declines during ependymal cell differentiation. ( a ) Immunohistofluorescence analysis of Id1 in the LGE of the embryonic mouse brain at E14.5 or E16.5 as well as of Id1, glial fibrillary acidic protein (GFAP), and S100 in the SVZ of the lateral ventricles in the adult mouse brain (P56-P63). The boxed regions of the upper panels are shown at higher magnification in the corresponding lower panels. Arrowheads indicate Id1 + cells. Scale bars, 200 mum (upper panels) or 20 mum (lower panels). Data are representative of three independent experiments. ( b ) Quantification by immunohistofluorescence analysis of Id1 + cells among Sox2 + Ascl1 - NPCs in the LGE at E14.5 and E16.5. Data are means +- SEM (n = 3 embryos for each stage). Three sections were counted per sample. Total of 500-800 cells were counted per section. ** p < 0.01 (two-tailed Student''s unpaired t test). ( c ) Immunoblot analysis of the VZ-SVZ of the embryonic GE and corresponding postnatal basal ganglia at the indicated embryonic, postnatal, and young adult (P30) stages with antibodies to phosphorylated (p) Smad1/5/8, to Id1, to Id4, and to glyceraldehyde-3-phosphate dehydrogenase (GAPDH, loading control). Data are representative of three independent experiments, with each experiment analyzed several times. ( d ) Dissociated cells of the lateral ventricular wall of P0 mice were cultured first for 5 days in vitro (DIV) in the presence of 10% FBS (proliferation medium) and then for up to 5 DIV
- Submitted by
- Invitrogen Antibodies (provider)
- Main image
- Experimental details
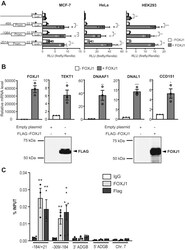
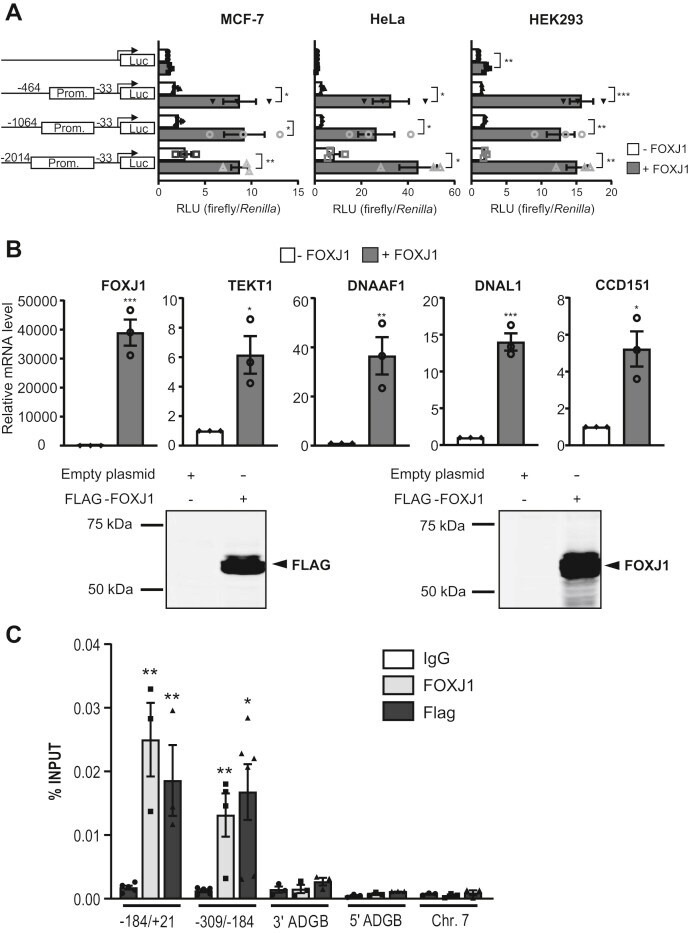
- Figure 6 FOXJ1 activates the ADGB promoter via direct binding. A , reporter gene assays of ADGB promoter elements in MCF-7, HeLa, and HEK293T cells with or without co-overexpression of FOXJ1 display a FOXJ1-induced activation of ADGB promoter-driven luciferase activity. This increase in promoter activity is seen in all promoter elements of different lengths (-33 bp to -464, -1064, and -2014 bp upstream of the ADGB TSS). Results are displayed as ratios of firefly to Renilla luciferase activities in relative light units (RLU) and normalized to the pGL3-basic vector (n = 3 independent experiments). B , mRNA and protein experiments of HEK293 cells transiently transfected with a FLAG-FOXJ1 vector. FOXJ1 target gene mRNA levels were measured by RT-qPCR and normalized to beta-actin mRNA levels. Immunoblotting using anti-FLAG and anti-FOXJ1 antibodies also confirmed FOXJ1 overexpression. C , the amount of coprecipitated chromatin derived from the proximal ADGB promoter region using two primer pairs (covering +21 to -184 and -184 to -309 upstream of the ADGB TSS, selected based on the reporter gene assays), its upstream (5'') and downstream (3'') regions as well as an independent region on chromosome 7 in the EPO locus (), was determined by qPCR. Data represent mean +- S.E.M (error bars); * p < 0.05; ** p < 0.01; *** p < 0.001; **** p < 0.0001.
- Submitted by
- Invitrogen Antibodies (provider)
- Main image
- Experimental details
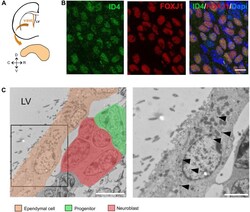
- FIGURE 1 ID4 expression in ependymal cells. (A) Scheme of a coronal section of a mouse brain hemisphere showing the ventricular-subventricular zone (V-SVZ) of the lateral ventricles (LV) and a wholemount section that can be dissected out from this region. (B) Immunolabeling of ID4 and FOXJ1 (ependymal cell marker) on wholemount sections of adult C57BL/6J mice. Scale bar: 5 mum. (C) Immunogold staining of ID4 protein on V-SVZ sections. Left panel shows ependymal cells next to neural progenitors and neuroblasts (identified by pseudo-colors). Arrowheads indicate some of the gold particles labeling ID4 protein in ependymal cells. Right panel shows higher magnification of boxed area on left panel. Scale bar: 5 mum left and 2 mum right.

- Submitted by
- Invitrogen Antibodies (provider)
- Main image
- Experimental details
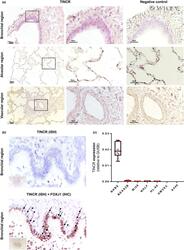
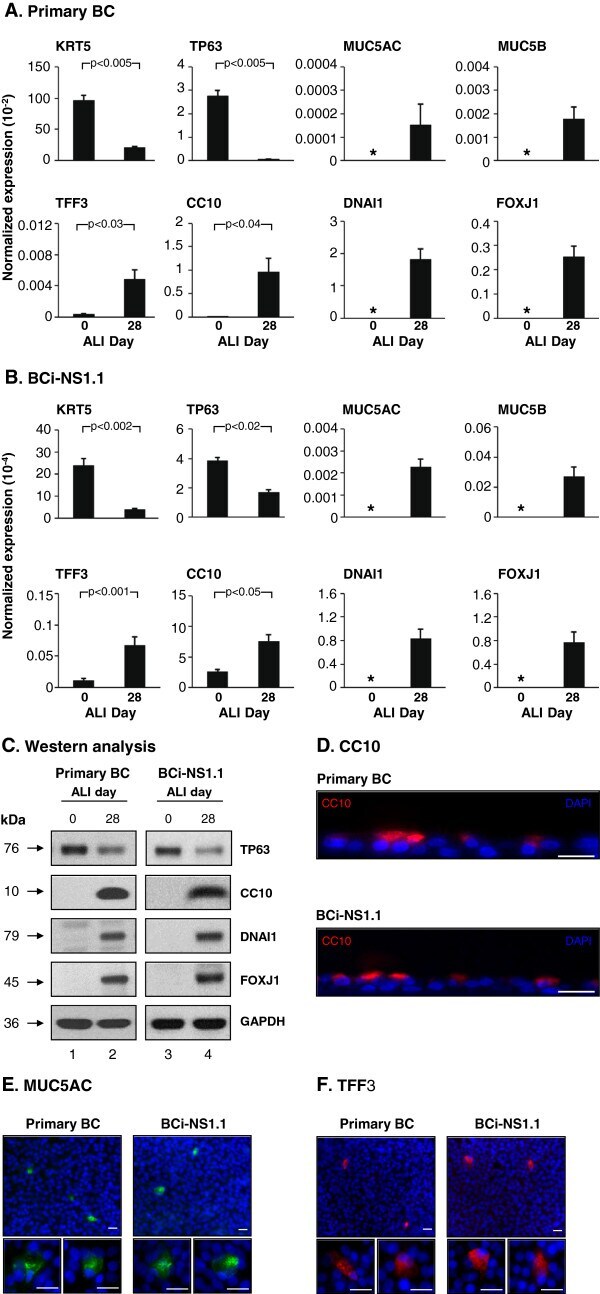
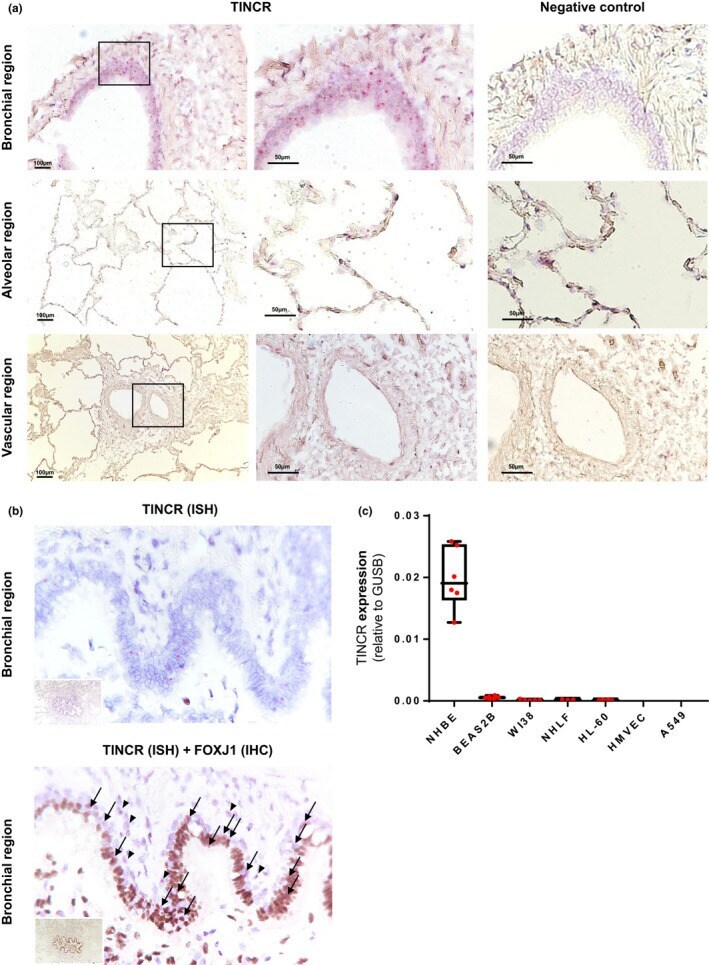
- 1 FIGURE TINCR in mainly expressed in bronchial epithelial cell in human lung. (a) RNA-ISH analysis of representative human lung tissue samples from normal histology lung. TINCR expression in normal histology lung (right image; x100, left image; x200-400). Boxed regions are shown enlarged on the middle and as insets on the left. (b) RNA-ISH and co-staining with IHCs for FOXJ1 in human lung samples. Black arrows point to double positive cells for TINCR and FOXJ1; black arrowheads indicate TINCR positive cells (FOXJ1 negative). (c) qRT-PCR for RNA extracted from various human lung cells; NHBEC (normal human bronchial epithelial cell), BEAS2B (immortalized normal bronchial epithelial cell line), NHLF (normal human lung fibroblasts), WI38 (normal human embryonic lung fibroblast), HL-60 (promyelocytic human cell line), HMVEC (human lung microvascular endothelial cell) and A549 (adenocarcinomic human alveolar basal epithelial cell). Data are presented as box-whisker plots, n = 6
- Submitted by
- Invitrogen Antibodies (provider)
- Main image

- Experimental details
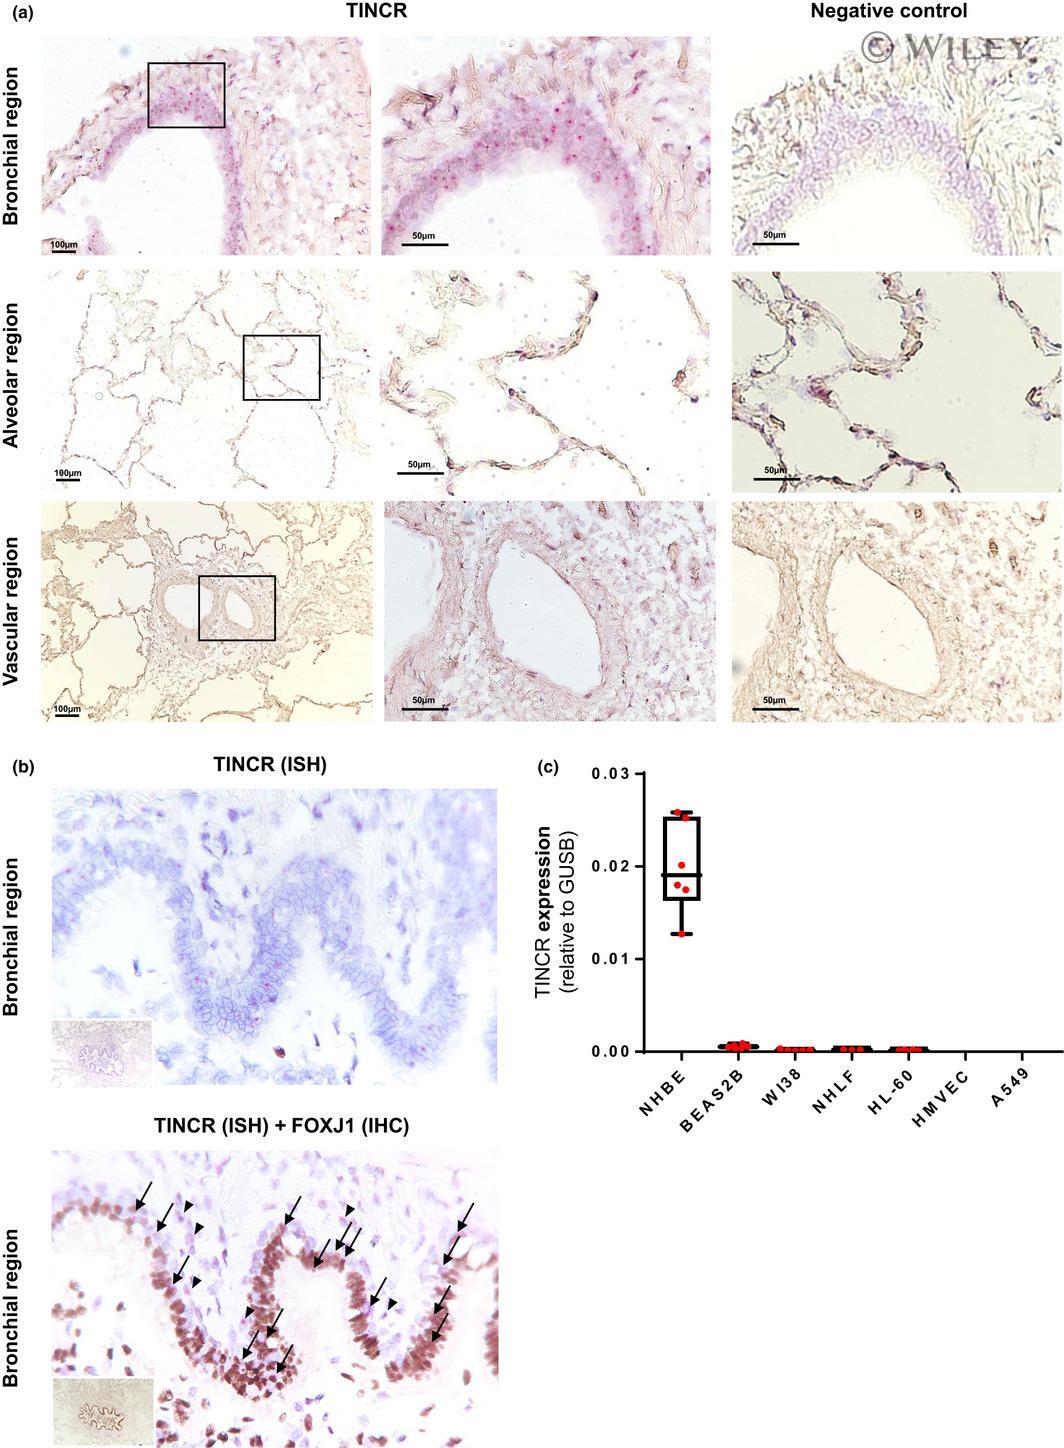
- Figure 6 Comparison of the differentiation capacity of immortalized BCi-NS1 cells to that of primary basal cells. Primary airway BC and immortalized BCi-NS1 cells were cultured under differentiation inducing conditions on air-liquid interface (ALI). A, B . mRNA transcripts; A . Primary BC. B . BCi-NS1.1 cells. At ALI day 0 and day 28, TaqMan quantitative PCR analysis was used to assess cell type specific mRNA markers: KRT5 (basal cell); TP63 (basal cell); MUC5AC (secretory cell); MUC5B (secretory cell); TFF3 (goblet cell); CC10 (Clara cell); DNAI1 (ciliated cell) and FOXJ1 (ciliated cell). Data shown is the average +- the standard error of n = 5 independent experiments for primary BC and n = 10 independent experiments for BC-NS1.1 cells. Statistics were calculated by a 2-tailed Student's t test. Asterisk (*) indicates not detected. For B , the data represents an average +- the standard error for BCi-NS1.1 cells from passage 6 to 43. C . Characterization of differentiation by Western analysis of cell type specific markers. Lane 1 - Primary BC, ALI day 0; lane 2 - Primary BC, ALI day 28; lane 3 - BCi-NS1.1, ALI day 0; and lane 4 - BCi-NS1.1, ALI day 28. Shown is the expression of a basal cell marker (TP63); Clara cell marker (CC10); and ciliated cell markers (DNAI1 and FOXJ1). GAPDH was used as a loading control. D, E, F . Immunofluorescent staining of ALI day 28 primary BC and BCi-NS1.1 cells for D . CC10 (Clara cell, red), E . MUC5AC (secretory cell, green) or F . TFF3 (goble
- Submitted by
- Invitrogen Antibodies (provider)
- Main image

- Experimental details
- FIGURE 1 TINCR in mainly expressed in bronchial epithelial cell in human lung. (a) RNA-ISH analysis of representative human lung tissue samples from normal histology lung. TINCR expression in normal histology lung (right image; x100, left image; x200-400). Boxed regions are shown enlarged on the middle and as insets on the left. (b) RNA-ISH and co-staining with IHCs for FOXJ1 in human lung samples. Black arrows point to double positive cells for TINCR and FOXJ1; black arrowheads indicate TINCR positive cells (FOXJ1 negative). (c) qRT-PCR for RNA extracted from various human lung cells; NHBEC (normal human bronchial epithelial cell), BEAS2B (immortalized normal bronchial epithelial cell line), NHLF (normal human lung fibroblasts), WI38 (normal human embryonic lung fibroblast), HL-60 (promyelocytic human cell line), HMVEC (human lung microvascular endothelial cell) and A549 (adenocarcinomic human alveolar basal epithelial cell). Data are presented as box-whisker plots, n = 6
- Submitted by
- Invitrogen Antibodies (provider)
- Main image

- Experimental details
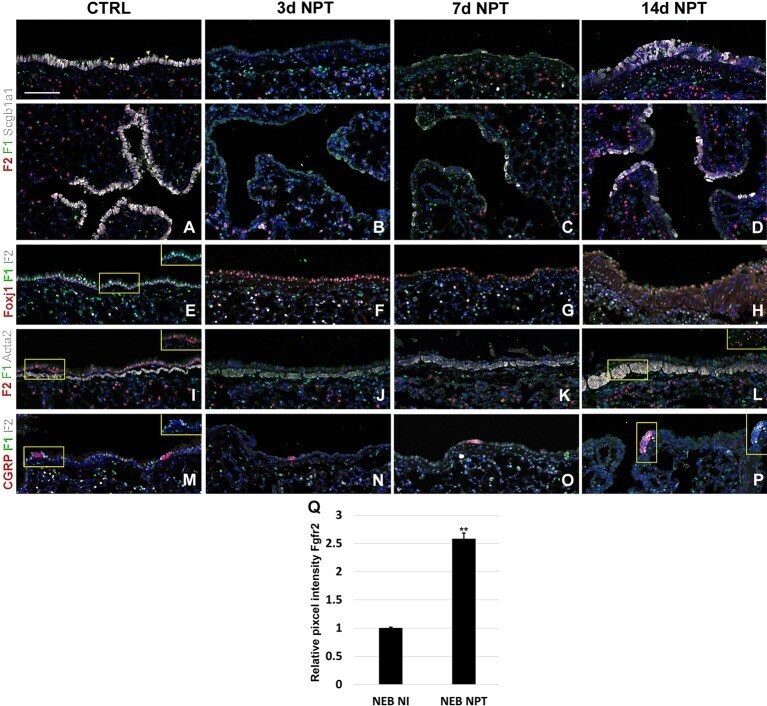
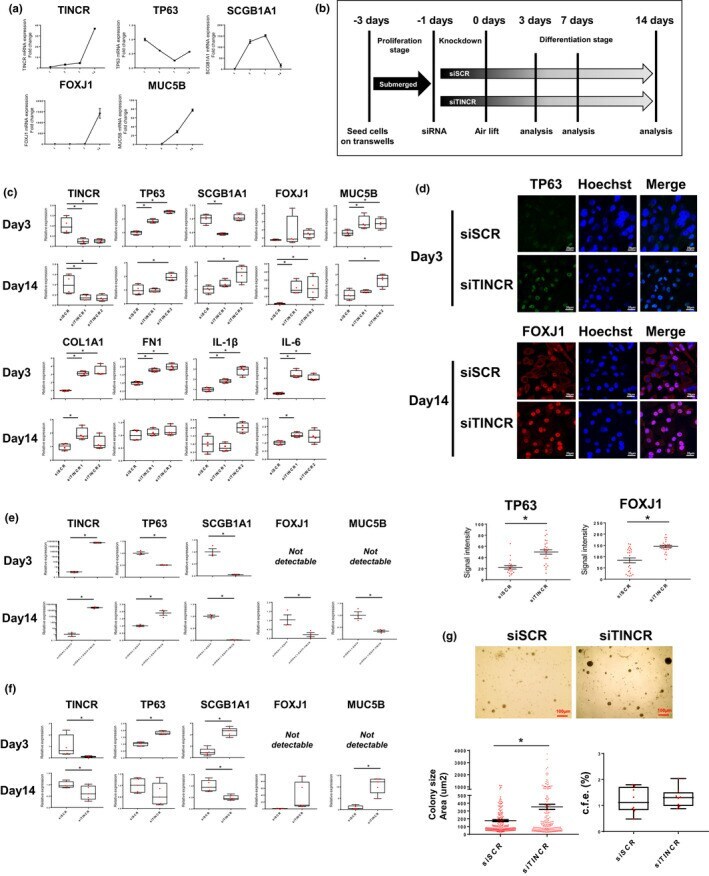
- FIGURE 3 Loss of TINCR expression induced aberrant bronchial cell differentiation in ALI culture model and 3D organoid formation assay. (a) qRT-PCR analysis of relative TINCR, TP63, SCGB1A1, FOXJ1 and MUC5B expression (mean +- SEM) (b) Schematic overview of NHBECs differentiation with transfection of siRNA in ALI culture model. NHBECs were seeded in transwell inserts and expanded for 2-3 days until confluency was reached. NHBECs were transfected with siSCR or siTINCR at day-1, subsequently airlifted and basolateral media was exchanged to differentiation medium at day0. The medium was renewed every 2 days and samples were taken for analysis at 3, 7, and 14 days after airlift. (c) qRT-PCR analysis of TINCR, TP63, SCGB1A1, FOXJ1, MUC5B, COL1A1, FN1, IL-1beta and IL-6 expression at day3 and day14 after airlift with siRNA. * p < 0.05. Data presented are from one of two independent experiments with similar results. (d) Immuofluorescence staining of TP63 and FOXJ1 for NHBEC transfected with siSCR and siTINCR day day3 and day14. Green represents TP63, and red represents FOXJ1 staining. Blue represents nuclear DNA staining by Hoechst33342; bars =20 mum. Quantitative analysis of the singal intensity per cell per group. Bars represent mean score +- SEM. ; * p < 0.05. (e) 3D organoid formation assay for NHBECs transfected siSCR or siTINCR (day14). qRT-PCR analysis of relative gene expression of TINCR, TP63, SCGB1A1, FOXJ1 and MUC5B at day14. * p < 0.05. Data presented are from one of two
- Submitted by
- Invitrogen Antibodies (provider)
- Main image
- Experimental details
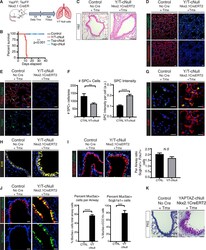
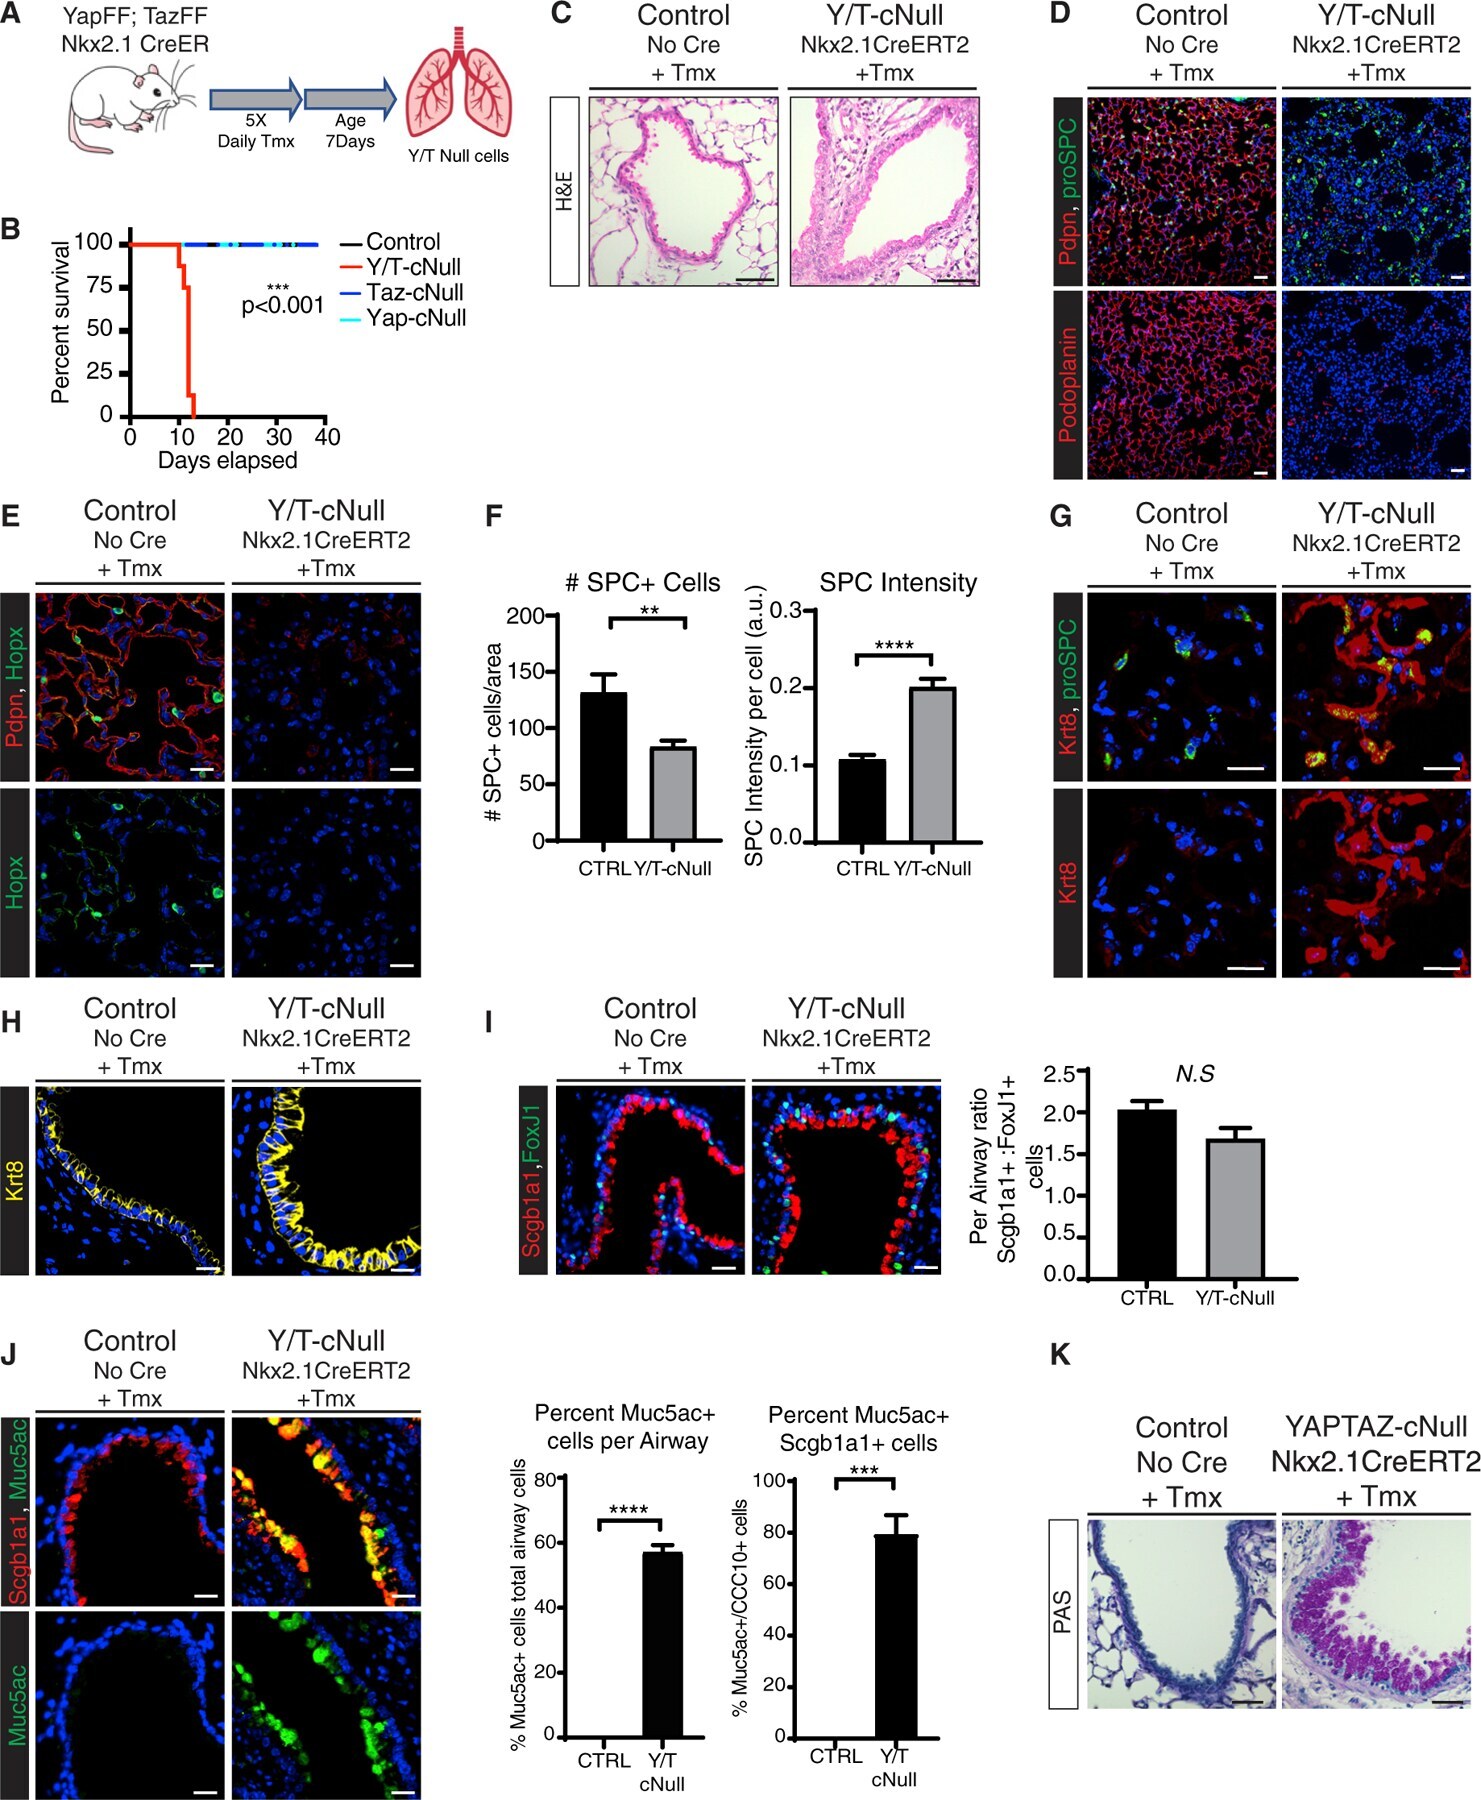
- Figure 1. Yap/Taz deletion leads to lung injury, epithelial remodeling, and goblet cell metaplasia (A) Outline of tamoxifen (Tmx) injection scheme for inducible knockout of Yap and Taz using the Nxk2.1-CreERT2 model. Lung tissues for all experiments described below were collected 12 days following tamoxifen treatment. (B) Survival curve for Yap/Taz Nxk-KO (n = 8), Yap Nxk-KO (n = 4), Taz Nxk-KO (n = 3), and control (n = 7) mice (log-rank [Mantel-Cox] test, ***p < 0.0001). (C) H&E staining of representative airway sections from control and Yap/Taz Nxk-KO lungs (scale bars, 50 mum). (D-I) Immunostaining of representative tissue sections from control and Yap/Taz Nxk-KO lungs. DAPI stained nuclei are in blue. (D) Pdpn and pro-SPC immunostaining (scale bars, 50 mum). (E) Immunostaining for Hopx with Pdpn co-staining in representative lungs. (F) The number and intensity of pro-SPC + cells were calculated per image area (from n = 3 images per mouse, from n = 3 control, and n = 5 knockout mice; unpaired t test, **p < 0.01, ****p < 0.0001). (G) Immunostaining for Krt8 and pro-SPC reveals elevated Krt8 expression in SPC + alveolar cells in Yap/Taz Nxk-KO lungs. (H) Krt8 immunostaining in representative airways. (I) Scgb1a1 and Foxj1 immunostaining reveals similar ratios of ciliated and club cells in control and Yap/Taz Nxk-KO lungs. For quantitation, the numbers of FoxJ1 + cells and Scgb1a1 + cells were counted per airway and the ratio was compared for n = 5 airways for each genotype (
- Submitted by
- Invitrogen Antibodies (provider)
- Main image
- Experimental details
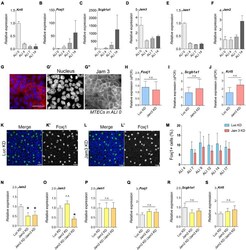
- FIGURE 6 Junctional adhesion molecule 3 (Jam 3) expression varies along the differentiation process but does not affect cell differentiation. (A-C) Quantification of mRNA expression of Krt5 (basal marker, in panel A ), FoxJ1 (multiciliated cells marker in panel B ), and Scgb1a1 (secretory cells marker in panel C ) expression in ALI 0, ALI 4, ALI 7, and ALI14. (D-F) Quantification of mRNA expression of Jam1 (E) , Jam2 (F) , and Jam3 (D) expression in ALI 0, ALI 4, ALI 7, and ALI14. Mean relative to control cells and standard deviation as error bars were plotted for each lineage marker, n = 4. (G) Jam3 immunofluorescence in BSCs during expansion in vitro , nucleus in blue (gray in panel G' ) and Jam3 in red (gray in panel G"" ). (H-J) mRNA expression levels of Krt5 (J) , FoxJ1 (H) , and Scgb1a1 (I) in Luc KD (C) and Jam3 KD (D) MTECs. Mean relative to control cells and standard deviation as error bars were plotted for each lineage marker, n = 4. (K,L) Confocal images for Foxj1 (green in panels K,L and gray in panels K',L' ) immunofluorescence in Luc KD (K) or Jam3 KD (L) cells in ALI14. (M) Relative quantification of Foxj1-positive cells along the differentiation process in Luc KD and Jam3 KD cells from ALI 4 to ALI 17. (N-S) Mean mRNA expression levels of Jam3 (O) , Jam1 (P) , Jam2 (N) , Krt5 (D) , Foxj1 (E) , and Scgb1a1 (F) assessed in differentiated MTECs infected with control viruses (Luc KD), Jam2-shRNAs (Jam2 KD), and double knockdown (Jam2 and Jam3), n = 4. Scale bar in

- Submitted by
- Invitrogen Antibodies (provider)
- Main image
- Experimental details
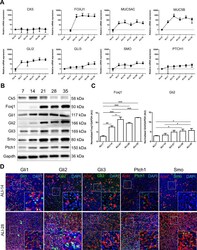
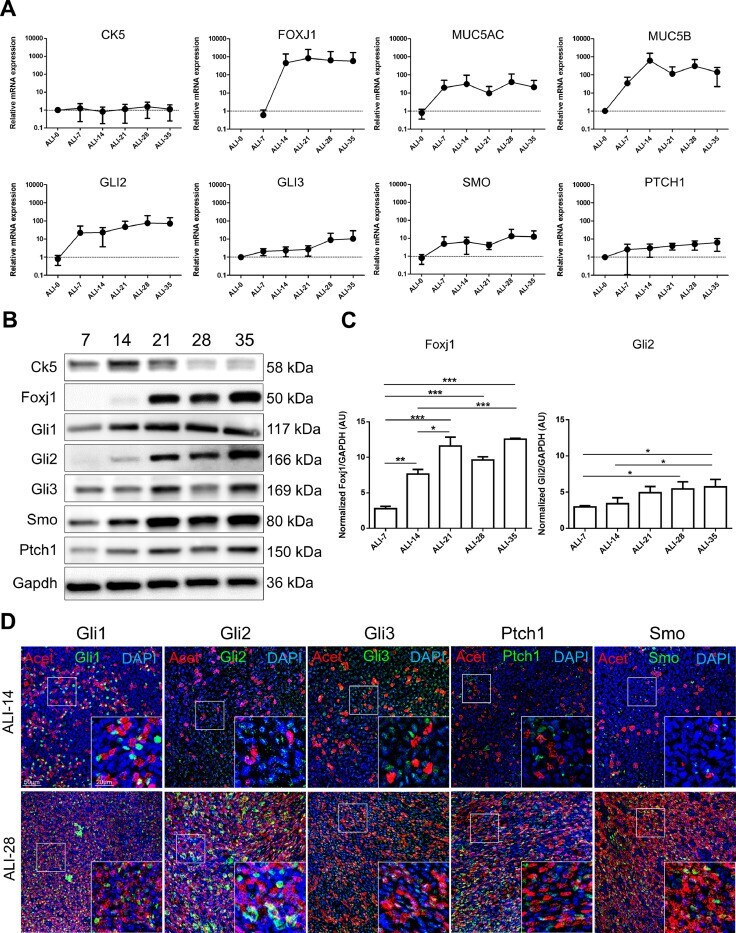
- Fig. 2 HH pathway is activated during AEC differentiation. A , Curves representing the relative mRNAs levels normalized to GAPDH obtained during the course of ALI cultures by RT-qPCR ( n = 5) for differentiation markers (CK5, non-differentiated cells; FOXJ1, ciliated cells; and MUC5AC/MUC5B, mucous-secreting cells) and HH pathway elements (GLI2/3; SMO and PTCH1). Means +-SEM of 2 -DeltaDeltaCt are shown for each ALI time point. B , Representative immunoblots of total proteins extracted from ALI AEC cultures from ALI-7 to ALI-35 for the differentiation markers (Ck5 and Foxj1), HH pathway elements (Gli1/2/3; Smo; Ptch1) and Gapdh ( n = 3). C , Histograms showing the relative increased expressions of Foxj1 and Gli2 protein levels as evaluated by western blot analysis after processing on ImageJ (Gapdh normalized ratios) during the course of AEC differentiation (in arbitrary units, AU). Results show mean +-SEM, * p < 0.05, ** p < 0.01, *** p < 0.001. D , Representative confocal acquisitions from AEC cultures at ALI-14 and ALI-28 for the core HH pathway components Gli1, Gli2, Gli3, Ptch1 and Smo (all green); cilia (acetylated tubulin, red) and cell nuclei (DAPI, blue). Merged z-projections are shown with a magnification corresponding to the selected area.(For interpretation of the references to colour in this figure legend, the reader is referred to the web version of this article.) Fig 2
- Submitted by
- Invitrogen Antibodies (provider)
- Main image
- Experimental details
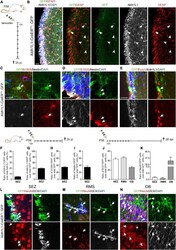
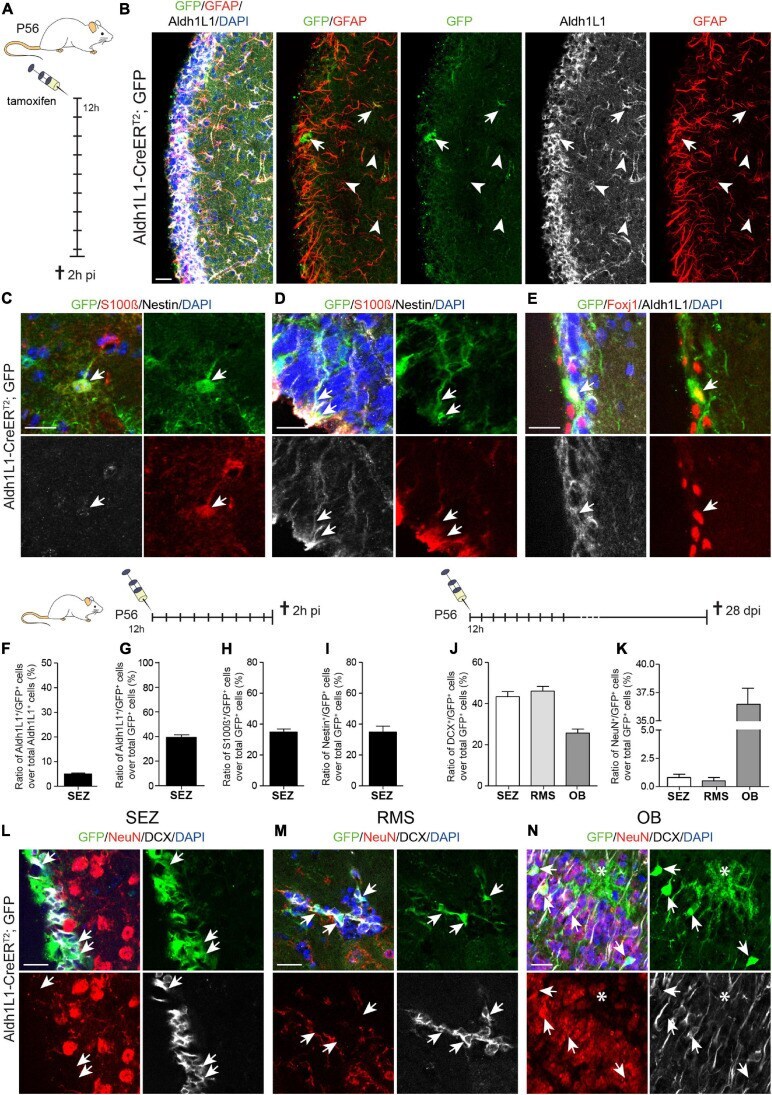
- FIGURE 3 Recombination in Aldh1L1-CreER T2 ; GFP mice targets astrocytes and neural stem cells in the subependymal zone. (A) Schematic drawing showing the short-term tamoxifen pulse. Here, Aldh1L1-CreER T2 ; GFP mice were injected with tamoxifen every 12 h (12 h) for five consecutive days and killed 2 h post-injection (2 h pi). (B) Representative pictures illustrate an overview of the immunohistochemically stained SEZ of adult Aldh1L1-CreER T2 ; GFP mice. Arrows point toward GFP/GFAP/Aldh1L1 triple positive cells while arrowheads highlight non-recombined GFAP + /Aldh1L1 + cells (DAPI in blue, GFP in green, GFAP in red, Aldh1L1 in white; scale bar = 20 mum). (C,D) Representative images show an immunohistochemically stained SEZ of Aldh1L1-CreER T2 , GFP transgenic mice using antibodies directed against GFP (green), S100beta (red), and Nestin (white). The arrows point toward a GFP/S100beta double positive astrocyte in the SEZ (C) , or a triple positive radial glia-like NSC (D) DAPI is depicted in blue, scale bar = 20 mum. (E) Images show an immunohistochemically stained SEZ of Aldh1L1-CreER T2 , GFP transgenic mice using antibodies directed against GFP (green), FoxJ1 (red), and Aldh1L1 (white). The arrows point toward a triple positive ependymal cell. DAPI is depicted in blue, scale bar = 20 mum. (F,G) Efficiency and specificity of recombination are expressed as the ratio of Aldh1L1/GFP double positive cells over all Aldh1L1 + or GFP + cells, respectively (mean + SEM; 2 h pi). (
- Submitted by
- Invitrogen Antibodies (provider)
- Main image
- Experimental details
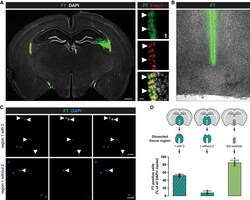
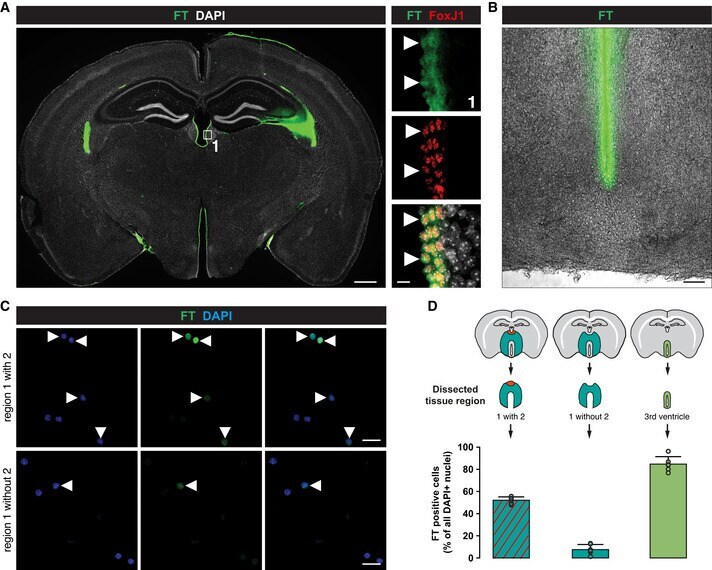
- Figure EV3 Optimization of ependymal cell removal using cell tracker/FlashTag Micrographs of coronal forebrain sections of 3-mo-old C57BL/6J mice stained as indicated showing that FlashTag (FT) labelled cells are all positive for the ependymal cell marker FoxJ1. Double-positive cells are indicated by white arrowheads. Scale bars: 500 um (overview) and 20 um (magnification). Brightfield micrograph of a coronal forebrain section of 3-mo-old C57BL/6J mice, showing that FT-positive cells are only lining around the lateral wall of the third ventricle and not penetrating within the parenchyma. Scale bar: 100 um. Removing the dorsal part of the ventricle followed by ACSA-2 MACS from FT labelled 3-mo-old C57BL/6J mice resulted in very little remaining FT-positive cells (lower panel) compared to the tissue preparation where the dorsal part was included in the preparation (upper panel). FT labelled DAPI cells are highlighted by white arrowheads. Scale bars: 20 um. Quantification of FT-positive cells after ACSA-2 MACS using different areas of dissection. Data information: In D data are presented as mean +- SEM. Each dot represents one field per coverslip.
- Submitted by
- Invitrogen Antibodies (provider)
- Main image
- Experimental details
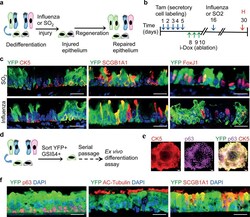
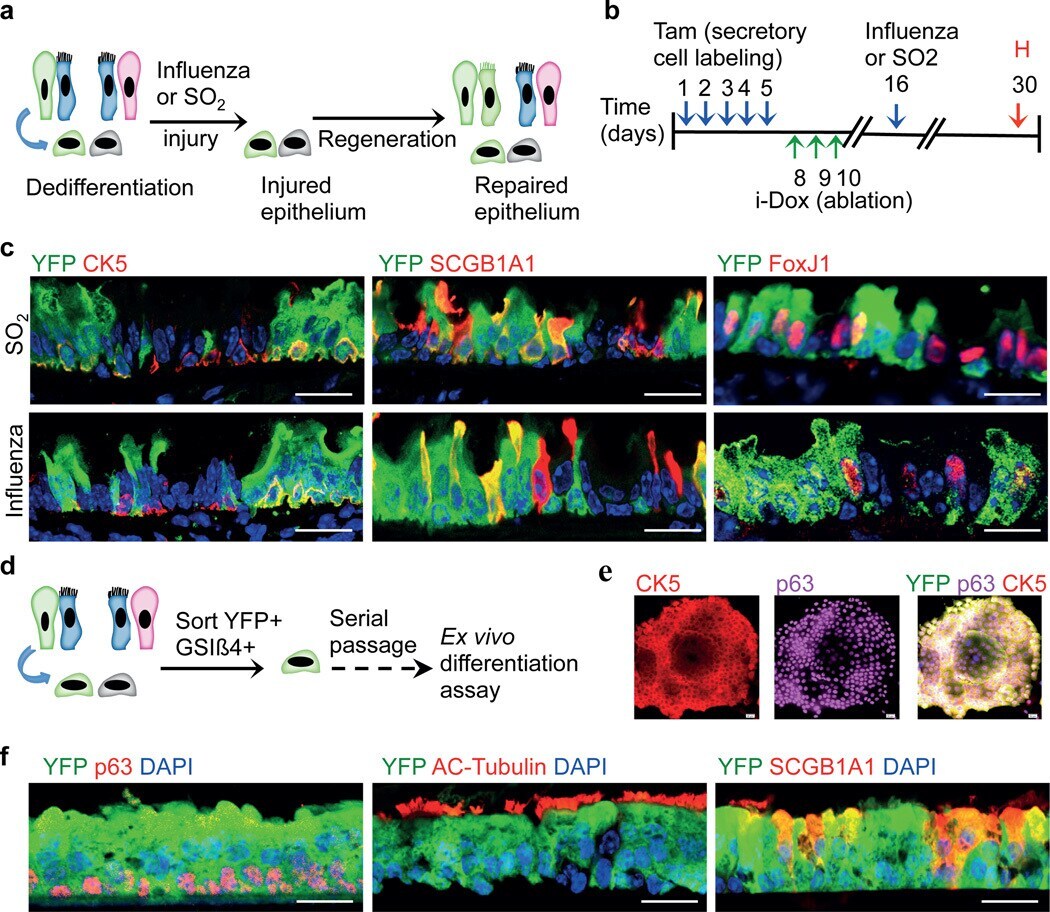
- Figure 5 Dedifferentiated cells are functional stem cells both in vivo and ex vivo a, Schematic representation of the regeneration of epithelium from dedifferentiated cells after SO2 or influenza induced injury. b, Timeline for the induction of dedifferentiation prior to infectious or toxic injury followed by tissue harvest. c, Co-labeling of YFP (green) with CK5 (red; left panels), SCGB1A1 (red; middle panels) and FoxJ1 (red; right panels) after SO 2 (upper panels) or influenza induced injury (lower panels). d. Ex vivo expansion, and differentiation of sorted dedifferentiated cells. e, Immunostaining for CK5(red), p63 (magenta) and YFP (green) on colonies from sorted dedifferentiated cells. f, Co-labeling of YFP (green) with p63 or Acetylated-Tubulin or SCGB1A1 (red). i-Dox, inhaled doxycycline; Tam, tamoxifen; H, harvest. Nuclei - DAPI (blue). n=3 (2 replicates/mice per condition). Scale bar 20um.
- Submitted by
- Invitrogen Antibodies (provider)
- Main image
- Experimental details
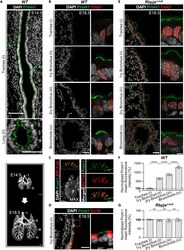
- Prom1 becomes restricted to multiciliated cells and its regional levels are controlled by Notch signaling in the developing lung (A) Immunofluorescence (IF) of Prom1 in the E14.5 trachea and intrapulmonary airways at the sites indicated by the numbered green bars in the diagram at the bottom left (adapted from , depicting the stages analyzed in panels A-D, E). Prom1 is detected throughout the epithelium at the apical surface. (B) Double Prom1/Foxj1 IF in E18.5 wild-type lungs. Each panel represents a series of single optical sections from different airway generations as depicted in the diagram (Boxed areas enlarged on the right panels). Prom1 is detected in multiciliated cells marked by Foxj1; labeling is stronger in intrapulmonary airways. (C) Maximum intensity projection of double Prom1/betaIV-Tubulin in E18.5 WT lungs. Boxed area is enlarged on the right panels. Prom1 is detected in ciliated cells in the apical membrane, and in the axonemes where it co-localizes with betaIV-Tubulin. (D) Double IF of Prom1/Cc10 in E18.5 wild-type lungs. Boxed areas are enlarged on the right panel. Prom1 is not detected in secretory cells (marked by Cc10). (E) Double Prom1/Foxj1 IF in E18.5 Rbpjkappa c lungs in different airway generations as depicted in diagram (green bars, bottom left). Boxed areas are enlarged on the right panels. The intensity of the Prom1 channel was increased in relation to panel B in order to better visualize the signal. Airways are overpopulated by multiciliated
- Submitted by
- Invitrogen Antibodies (provider)
- Main image
- Experimental details
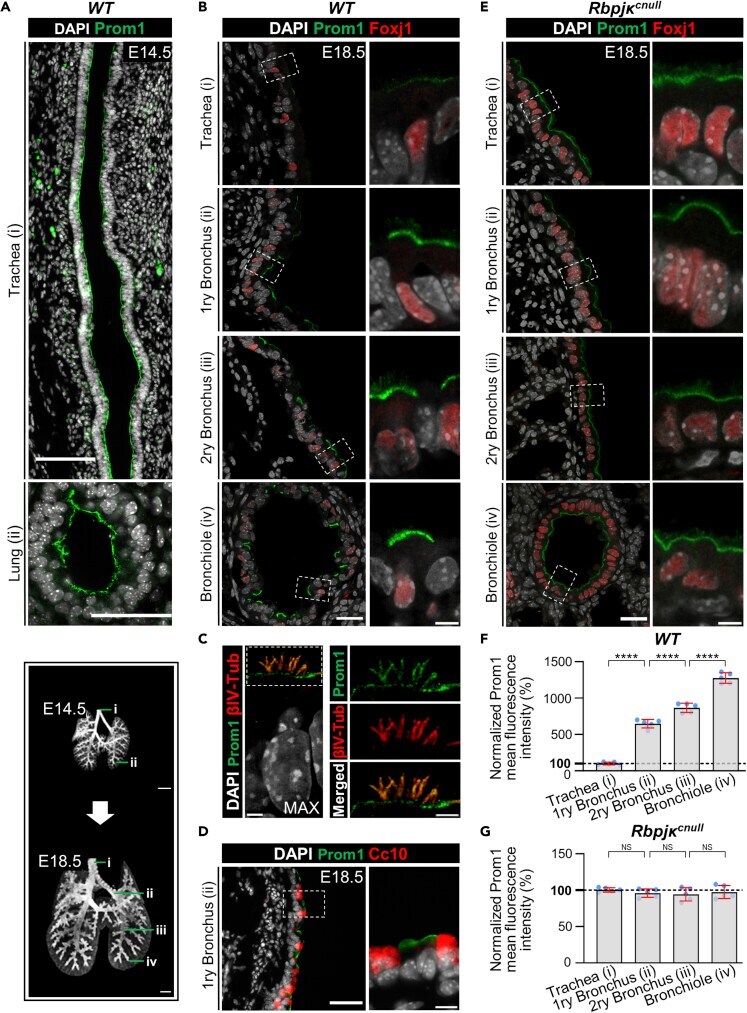
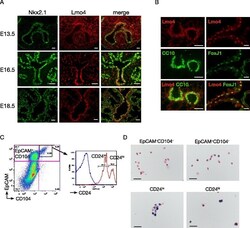
- Fig. 1 Lmo4 is expressed in lung epithelial cells. a Immunofluorescence staining for Nkx2.1 (green) and Lmo4 (red) in embryonic lung. Scale bars = 25 mum. b Immunofluorescence staining for CC10, FoxJ1 and Lmo4 in adult lung. Scale bars = 50 mum. c Representative FACS plots showing the sorting strategy to isolate adult lung epithelial subpopulations from live CD31 - CD45 - cells. EpCAM - CD104 - : non epithelial cells; EpCAM + CD104 + (also known as integrin beta4): enriched in alveolar cells; EpCAM + CD104 + CD24 lo (CD24 lo ): enriched in club cells and progenitor cells; EpCAM + CD104 + CD24 hi (CD24 hi ): enriched in ciliated cells. d Representative photos of X-Gal and Nucleo-Fast Red counterstaining of sorted lung subpopulations isolated from Lmo4 LacZKI/+ mice. Scale bars = 50 mum
- Submitted by
- Invitrogen Antibodies (provider)
- Main image
- Experimental details
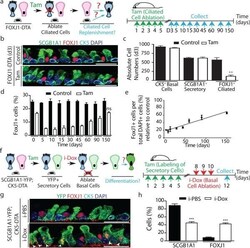
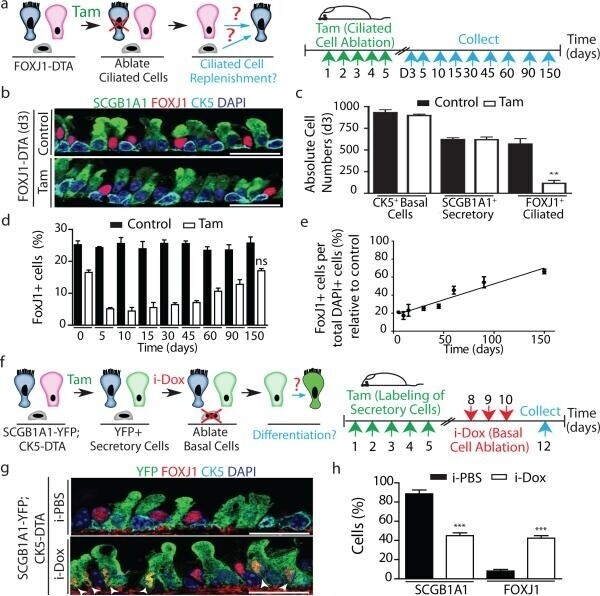
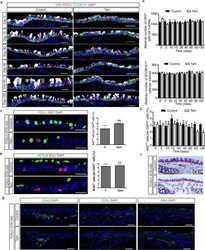
- Figure 1 Secretory progenitor cells differentiate into ciliated cells following basal stem/progenitor cell ablation a, Schematic representation of ciliated cell ablation. Ciliated, secretory and basal cells are shown in blue, pink and gray respectively. b, Immunostaining for SCGB1A1 (green), FOXJ1 (red) and CK5 (cyan) on control (top) or tamoxifen (Tam)-treated FOXJ1-DTA mice (bottom) (n=6 mice). c, Absolute cell number of each cell type in both groups (n=3 mice). d, Percentage of FOXJ1 + cells per total DAPI + cells over time (n=3 mice). ns, not significant when compared to day 0 of the same group. e, Percentage of FOXJ1 + cells in Tam-treated mice (n=3 mice). f, Schematic representation of secretory cell lineage labeling and basal cell ablation. g, Immunostaining for FOXJ1 (red), YFP (green) and CK5 (cyan) on i-PBS (top) or i-Dox (bottom) treated SCGB1A1-YFP; CK5-DTA mice (n=3 mice). White arrowheads, lineage labeled ciliated cells. h, Percentage of SCGB1A1 + and FOXJ1 + cells per total YFP + cells. Nuclei, DAPI (blue). n=biological replicates/condition repeated twice (two independent experiments). ** p
- Submitted by
- Invitrogen Antibodies (provider)
- Main image
- Experimental details
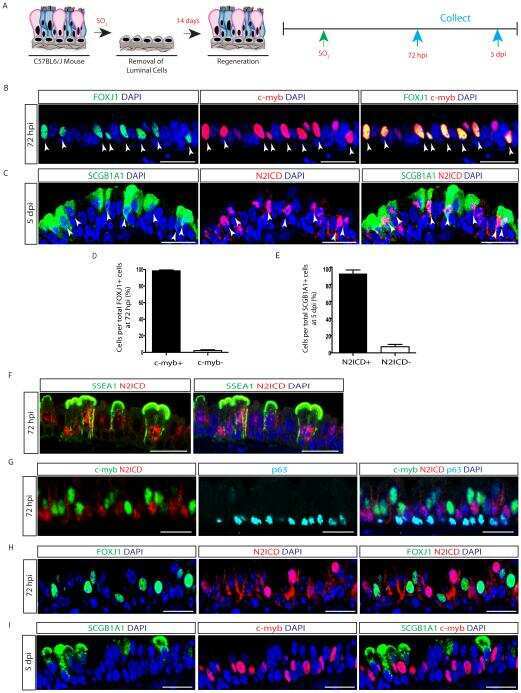
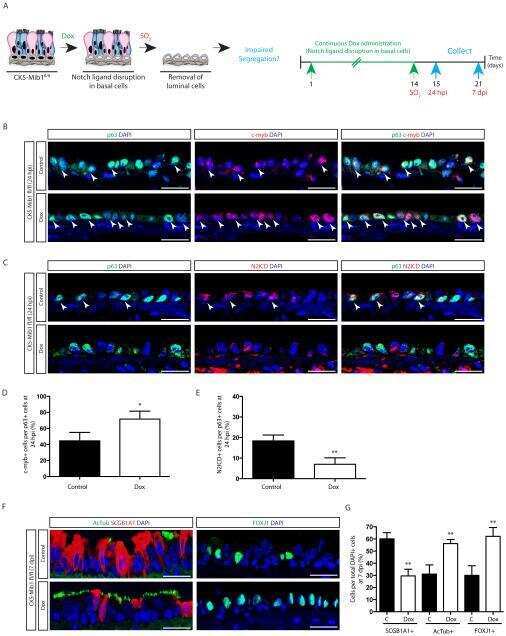
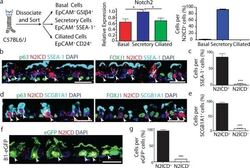
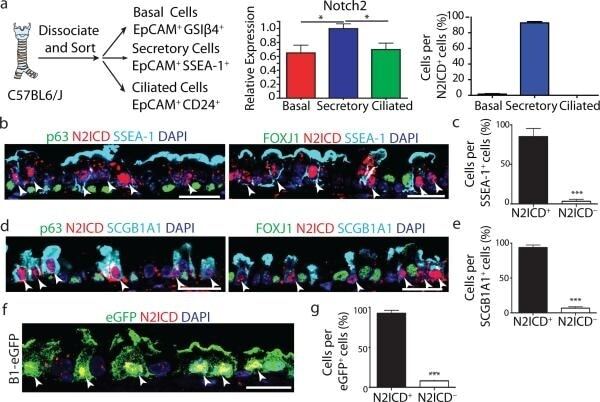
- Figure 2 Secretory progenitor cells show tonic Notch2 activity at steady-state a, Schematic representation of airway epithelial cell isolation. Relative mRNA expression of Notch2 in sorted cells (n=3 mice) (middle). Percentage of each cell type per total N2ICD + cells (right). b-e, Immunostaining for p63 (left) or FOXJ1 (right) (green), SSEA-1 (b) or SCGB1A1 (d) (cyan) and N2ICD (red). Percentage of N2ICD + cells per total SSEA-1 + (c) or SCGB1A1 + (e) cells (n=3 mice). f, Immunostaining for eGFP (green) and N2ICD (red) in B1-eGFP mice. g, Percentage of N2ICD + cells per total eGFP + cells (n=3 mice). Nuclei, DAPI (blue). White arrowheads, double-positive cells. Images are representative of n=3 mice (biological replicates). * p
- Submitted by
- Invitrogen Antibodies (provider)
- Main image
- Experimental details
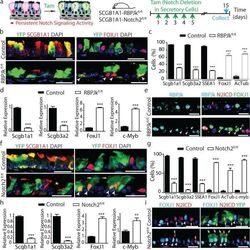
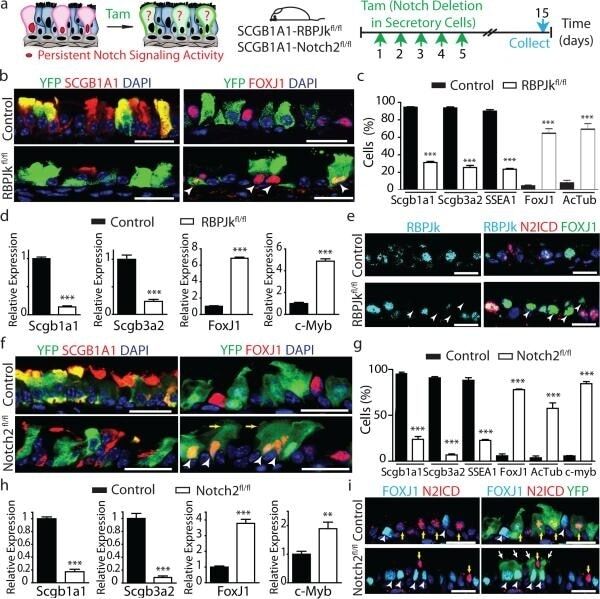
- Figure 3 Tonic Notch2 activity is required to maintain secretory cells by preventing their differentiation into ciliated cells a, Schematic representation of canonical Notch signaling inhibition in secretory cells. b, f, Immunostaining for YFP (green) and SCGB1A1 (left) or FOXJ1 (right) (red) in control (top) and experimental (bottom) mice (n=6 mice (b); n=7 mice (f)). White arrowheads, lineage labeled ciliated cells. c, g, Percentage of SCGB1A1 + , SCGB3A2 + , SSEA-1 + , FOXJ1 + , ACTUB + and C-MYB + cells per total YFP + cells. n=3 mice (c); n=7 mice (g). d, h, Relative mRNA expression of Scgb1a1 , Scgb3a2 , FoxJ1 and c-Myb in control and experimental YFP + cells (n=3 mice). e, Immunostaining for RBPJk (cyan), N2ICD (red) and FOXJ1 (green). White arrowheads, RBPJk - N2ICD - FOXJ1 + cells. i, Immunostaining for YFP (green), FOXJ1 (cyan) and N2ICD (red). White arrowheads, FOXJ1 + cells. Yellow arrows, N2ICD + cells. White arrows, actual cilia in lineage labeled cells. Nuclei, DAPI (blue). n=biological replicates/condition repeated three times (three independent experiments). *** p
- Submitted by
- Invitrogen Antibodies (provider)
- Main image
- Experimental details
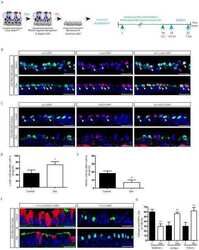
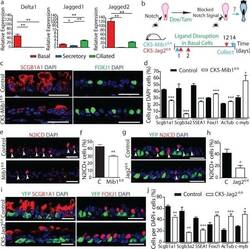
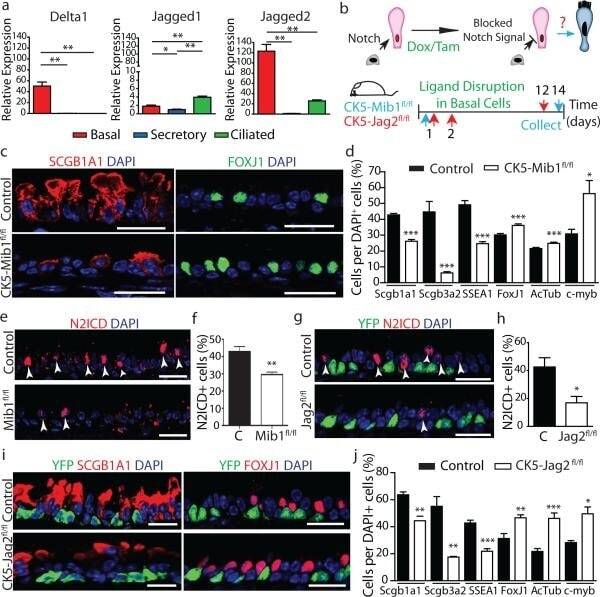
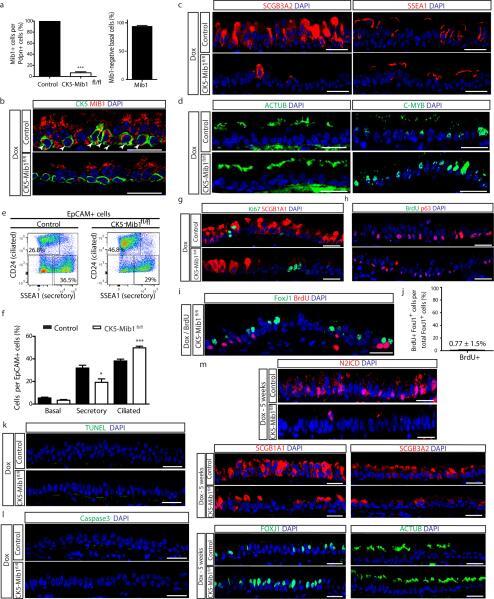
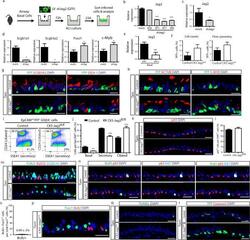
- Figure 4 Basal cell Jagged2 expression is required to maintain secretory progenitors and prevent their differentiation into ciliated cells a, Relative mRNA expression of Delta1 , Jagged1 and Jagged2 in sorted cells (n=3 mice). b, Schematic representation of Notch ligand disruption in basal cells. c, Immunostaining for SCGB1A1 (red, left) and FOXJ1 (green, right) in control (top) and experimental CK5-Mib1 fl/fl mice (bottom) (n=4 mice). d,j Percentage of SCGB1A1 + , SCGB3A2 + , SSEA-1 + , FOXJ1 + , ACTUB + and C-MYB + cells in control and experimental mice. n=4 mice (d); n=5 mice (j). e,g Immunostaining for N2ICD (red) and YFP (green, in g ) n=4 mice (e); n=5 mice (g). White arrowheads, N2ICD + cells. f,h, Percentage of N2ICD + cells per total DAPI + cells (n=4 mice; n=5 mice). i, Immunostaining for YFP (green) and SCGB1A1 (left) or FOXJ1 (right) (red) in control (top) and experimental CK5-Jag2 fl/fl mice (bottom) (n=5). Nuclei, DAPI (blue). n=biological replicates/condition repeated twice (CK5-Mib1 mice) or three times (CK5-Jag2 mice). * p
- Submitted by
- Invitrogen Antibodies (provider)
- Main image
- Experimental details
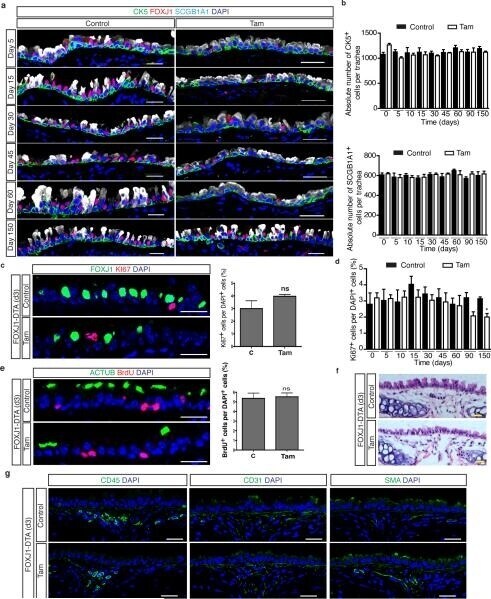
- Extended Data Figure 2 Ablation of ciliated cells has no effect on airway cell proliferation, mesenchymal cell types, mesenchymal morphology, and airway stem and progenitor cell replication over time a, Immunostaining for basal (CK5 (green)), ciliated (FOXJ1 (red)), and secretory cells (SCGB1A1 (white)) on either control (left panels) or tamoxifen (Tam)-treated FOXJ1-DTA mice (right panels) 5, 15, 30, 45, 60, and 150 days after ciliated cell ablation (n=3 mice). b, Quantification of absolute cell numbers of basal CK5 + cells (top graph) and secretory SCGB1A1 + cells (bottom graph) per trachea on control (black bars) or Tam-treated (white bars) mice over time (n=3 mice). c, Immunostaining for ciliated cells (FOXJ1 (green)) and proliferating cells (Ki67 (red)) on either control (upper panel) or tamoxifen (Tam)-treated FOXJ1-DTA mice (lower panel) (n=6 mice). On the right, quantification of the percentage of Ki67 + cells per total DAPI + cells in tracheal sections from control (C) or Tam-treated mice 3 days after cell ablation (n=3 mice). d, Quantification of the percentage of proliferating Ki67 + cells relative to total DAPI + cells in control (black bars) or Tam-treated (white bars) mice over time (n=3 mice). e, Immunostaining for ciliated cells (ACTUB (green)) and cells that have undergone proliferation (BrdU (red)) on either control (upper panel) or Tam-treated mice (lower panel) at day 3 (n=6 mice). On the right, quantification of the percentage of BrdU + cells per total DA
- Submitted by
- Invitrogen Antibodies (provider)
- Main image
- Experimental details
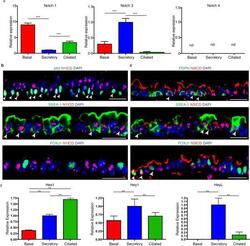
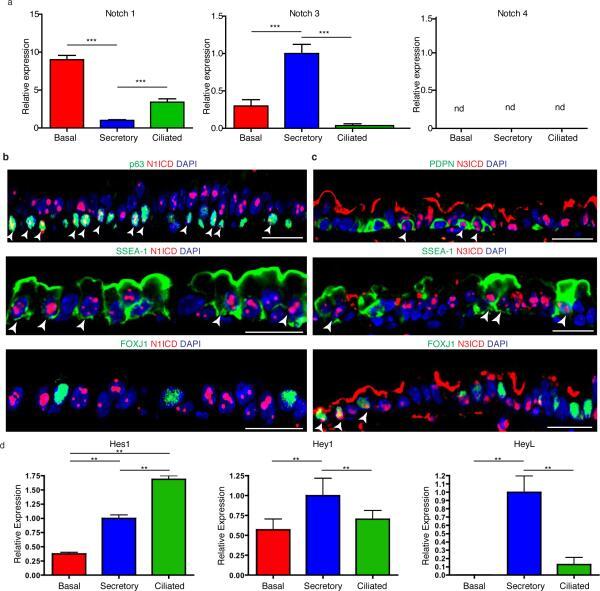
- Extended Data Figure 4 Characterization of Notch pathway components in the steady-state murine tracheal epithelium a, Relative mRNA expression of Notchl, Notch3 and Notch4 assessed by qRT-PCR in pure sorted populations of airway epithelial cells (n=3 mice). Relative expression is normalized to baseline transcript levels in secretory progenitor cells. b, Immunostaining for N1ICD (red) in combination with the basal cell marker p63 (top panel), the secretory cell marker SSEA-1 (middle panel) and the ciliated cell marker FOXJ1 (bottom panel) (green). c, Immunostaining for N3ICD (red) in combination with the basal cell marker podoplanin (PDPN) (top panel), the secretory cell marker SSEA-1 (middle panel) and the ciliated cell marker FOXJ1 (bottom panel) (green). d, Relative mRNA expression of Hes1 , Hey1 and HeyL assessed by qRT-PCR in pure sorted populations of airway epithelial cells (n=3 mice). Relative expression is normalized to baseline transcript levels in secretory progenitor cells. n=biological replicates/condition. ** p
- Submitted by
- Invitrogen Antibodies (provider)
- Main image
- Experimental details
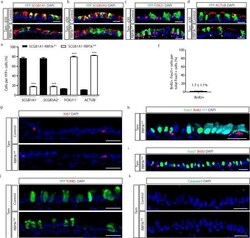
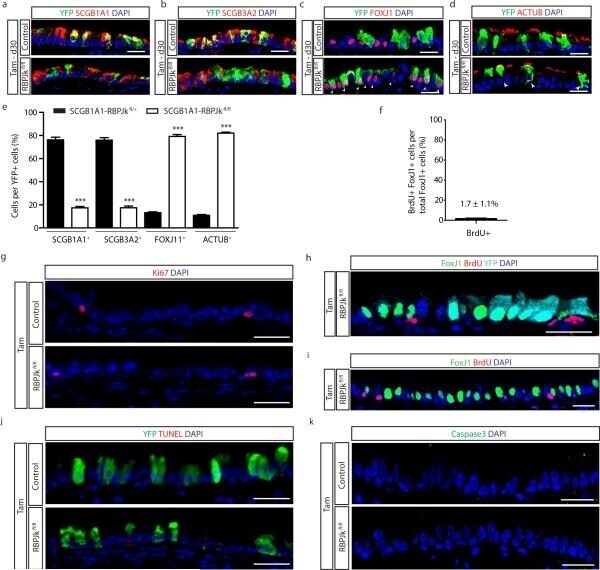
- Extended Data Figure 6 Lineage labeled ciliated cells demonstrate long term persistence after RBPJk deletion without a change in epithelial cell proliferation and apoptosis Immunostaining for the lineage label YFP (green) in combination with the secretory cell markers SCGB1A1 (a), SCGB3A2 (b), or the ciliated cell markers FOXJ1 (c) and ACTUB (d) (red) on either Tam-treated SCGB1A1-RBPJk fl/+ control mice (upper panels) or Tam-treated SCGB1A1-RBPJk fl/fl mice (lower panels) thirty days after the last tamoxifen injection (n=3 mice). White arrowheads point to lineage labeled ciliated cells. e, Quantification of the percentage of each cell type per YFP + cells on either control mice (black bars) or Tam-treated SCGB1A1-RBPJk fl/fl mice (white bars) at day 30. f, Quantification of the percentage of ciliated FOXJ1 + cells that incorporate BrdU after continuous BrdU administration to Tam-treated SCGB1A1-RBPJk fl/fl mice (n=3 mice). g, Immunostaining for Ki67 (red) to assess overall proliferation in either Tam-treated SCGB1A1-RBPJk fl/+ control mice (upper panel) or Tam-treated SCGB1A1-RBPJk fl/fl mice (lower panel) (n=3 mice). h,i Immunostaining for FOXJ1 (green) and BrdU (red) in combination with YFP (cyan) (h) or alone (i) on Tam-treated SCGB1A1-RBPJk fl/fl mice that received continuous BrdU (n=3 mice). j, Immunostaining to detect apoptotic cells by TUNEL assay (red) in combination with YFP lineage labeled cells (green) in either Tam-treated SCGB1A1-RBPJk fl/+ control mice (upper p
- Submitted by
- Invitrogen Antibodies (provider)
- Main image
- Experimental details
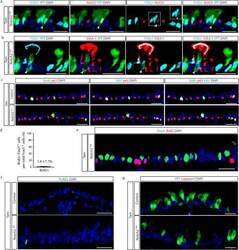
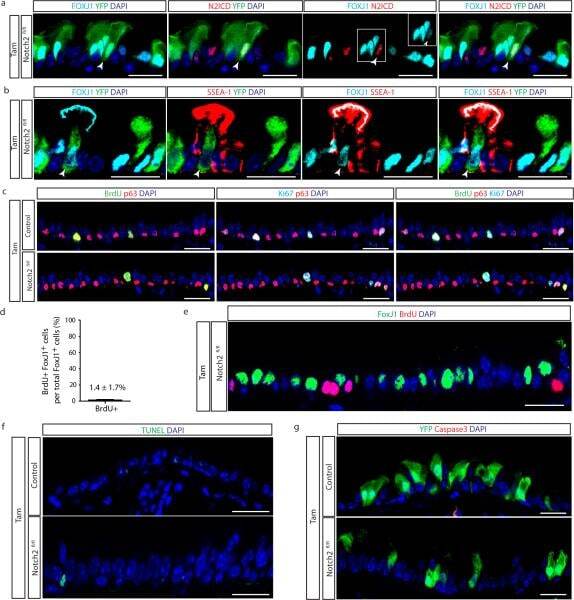
- Extended Data Figure 8 Proliferation and apoptosis following deletion of Notch2 in secretory progenitor cells a, Immunostaining for lineage label YFP (green), FOXJ1 (cyan) and N2ICD (red) in Tam-treated SCGB1A1-Notch2 fl/fl mice. White arrowhead points to a lineage labeled cell co-expressing markers for secretory and ciliated cell fates. The inset shows the single stain for FOXJ1 of the indicated region. b, Immunostaining for lineage label YFP (green), FOXJ1 (cyan) and SSEA-1 (red) in Tam-treated SCGB1A1-Notch2 fl/fl mice. White arrowhead points to a lineage labeled transitional cell. c, Immunostaining for BrdU (green), p63 (red) and Ki67 (cyan) to assess overall proliferation on either Tam-treated SCGB1A1-Notch2 +/+ control mice (upper panels) or Tam-treated SCGB1A1-Notch2 fl/fl mice (lower panels). d, Quantification of the percentage of ciliated FOXJ1 + cells that incorporate BrdU after continuous BrdU administration to Tam-treated SCGB1A1-Notch2 fl/fl mice (n=4 mice). e, Immunostaining for FOXJ1 (green) and BrdU (red) on Tam-treated SCGB1A1-Notch2 fl/fl mice that received continuous BrdU (n=4 mice). f, Immunostaining to detect apoptotic cells by TUNEL assay (green) on either Tam-treated SCGB1A1-Notch2 +/+ control mice (upper panel) or Tam-treated SCGB1A1-Notch2 fl/fl mice (lower panel). g, Immunostaining for YFP (green) in combination with activated caspase3 (red) on control mice (upper panel) or Tam-treated SCGB1A1-Notch2 fl/fl mice (lower panel). Analysis performed 10 da
- Submitted by
- Invitrogen Antibodies (provider)
- Main image
- Experimental details
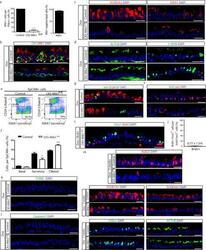
- Extended Data Figure 9 Loss of Notch ligands in basal stem cells promotes secretory cell differentiation into ciliated cells without affecting proliferation or apoptosis a, Quantification of the percentage of basal PDPN + cells that express Mib1 (left graph) on either Dox-treated CK5-Mib1 +/+ control mice or Dox-treated CK5-Mib1 fl/fl mice (n=4 mice). Right graph, percentage of basal cells in which Mib1 was deleted in Dox-treated CK5-Mib1 fl/fl mice (n=4 mice). b, Immunostaining for Mib1 (red) and the basal cell marker CK5 (green). White arrowheads point to Mib1 + basal cells. c, Immunostaining for the secretory cell markers SCGB3A2 (left panels) and SSEA-1 (right panels) (red) in control (top panels) and experimental (bottom panels) mice. d, Immunostaining for the ciliated cell markers ACTUB (left panels) and C-MYB (right panels) (green) in control (top panels) and experimental (bottom panels) mice. e, Flow cytometry analysis of EpCAM + CD24 + ciliated cells and EpCAM + SSEA-1 + secretory cells from control and experimental mice. f, Percentage of epithelial (EpCAM + ) basal, secretory and ciliated cells on both groups by flow cytometry (n=3 mice). g, Immunostaining for Ki67 (green) and the secretory cell marker SCGB1A1 (red) on control (top panel) or Dox-treated CK5-Mib1 fl/fl mice (bottom panel). h, Immunostaining for BrdU (green) in combination with the basal cell transcription factor p63 (red) on both groups. i, Immunostaining for FOXJ1 (green) and BrdU (red) on Dox-treat
- Submitted by
- Invitrogen Antibodies (provider)
- Main image
- Experimental details
- Extended Data Figure 10 Disruption ofDisruption of Jag2 in basal stem/progenitor cells causes the differentiation of secretory progenitor cells into ciliated cells without affecting proliferation or apoptosis a, Schematic representation of Jag2 inhibition using lentiviruses (LV) carrying shRNAs. Infected GFP + cells were cultured in an air-liquid interface (ALI) culture system for 23d, when they were harvested, sorted and analyzed. b, Relative mRNA expression of Jag2 in tracheal epithelial cells infected with mock vector (control) or with vectors carrying 4 different shRNAs targeting Jag2 72h after infection. c, Relative mRNA expression of Jag2 in tracheal epithelial basal cells infected with mock vector (control) or with lentivirus targeting Jag2 (shJag2 877) after 23d in ALI. d, Relative mRNA expression of the secretory genes ( Scgb1a1 and Scgb3a2 ) and the ciliated cell genes ( FoxJ1 and c-Myb ) in mock (black bars) and shJag2 877 (grey bars) infected cells 23d after ALI initiation. Relative expression is normalized to baseline transcript levels in mock infected cells. e, Relative mRNA expression of Jag2 on sorted recombined (YFP + ) basal cells and unrecombined YFP - basal cells from Tam-treated CK5-Jag2 fl/fl mice (n=3 mice). Relative expression is normalized to baseline transcript levels in YFP - cells. f, Percentage of YFP + cells per total DAPI + cells (efficiency of recombination) on either Tam-treated CK5-Jag2 +/+ control (black bars) or Tam-treated CK5-Jag2 fl/fl (
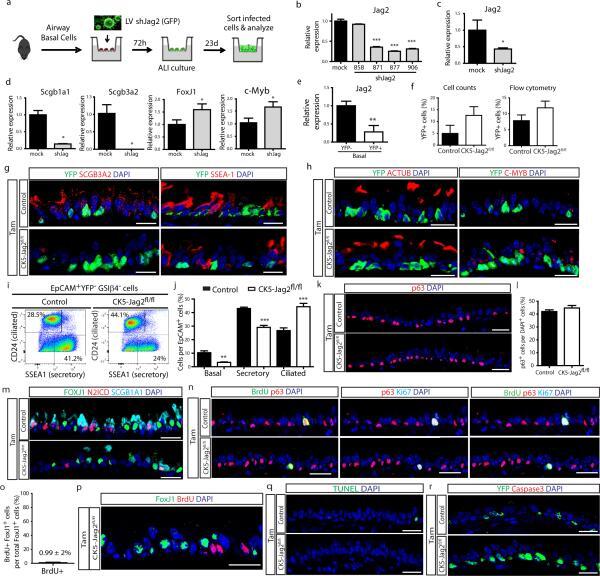
- Submitted by
- Invitrogen Antibodies (provider)
- Main image
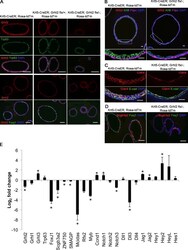
- Experimental details
- Figure 4. Deletion of Grhl2 in BCs impairs apical-basal polarity of daughter cells in clonal spheres and their differentiation into ciliated cells. (A) At day 14, spheres were fixed, sectioned, and stained for Grhl2, Trp63 or Foxj1, and DAPI. Note the presence of Trp63 + BCs and absence of Foxj1 cells in spheres that do not stain for Grhl2 (right). (B) Sections of spheres stained for Grhl2, Krt8, Pdpn (BC marker), and DAPI. Bottom panels are higher magnifications of boxed regions. Note the low cuboidal shape of mutant Krt8 + luminal cells. (C) Sections of similar spheres stained for E-cadherin (E-cad) and Cldn4. (D) Sections stained for Scgb3a2, Foxj1, and DAPI. Note the absence of ciliated cells and the presence of secretory cells in mutant spheres. (E) qRT-PCR analysis of grainyhead-like genes and genes involved in cell differentiation, ciliogenesis, and Notch signaling in spheres cultured for 14 d. Data (+-SEM) are from triplicates of two biological replicates. *, P < 0.05. Bars: (A and D) 100 um; (B and C) 20 um.
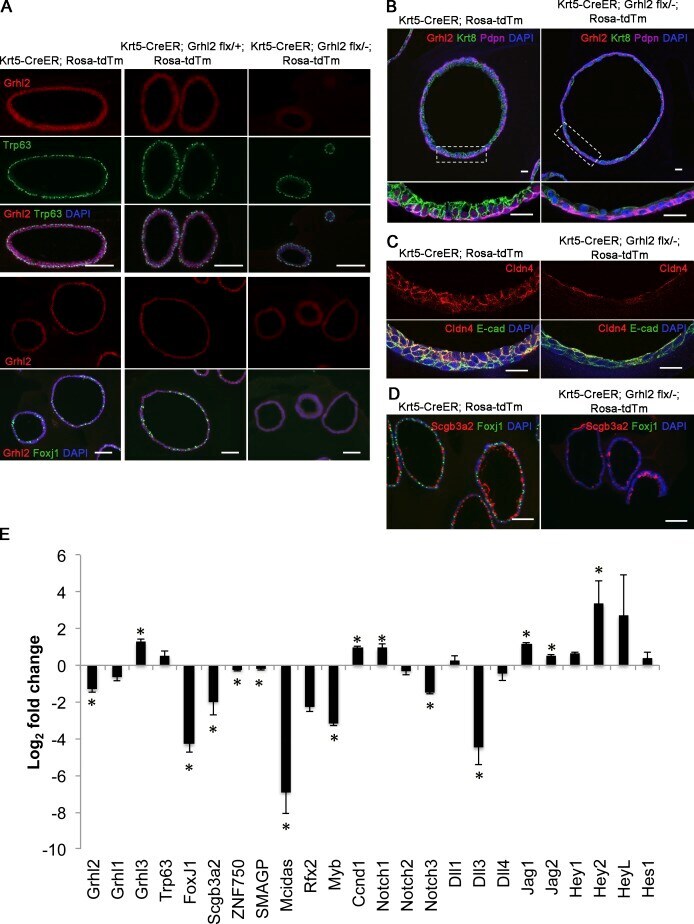
- Submitted by
- Invitrogen Antibodies (provider)
- Main image
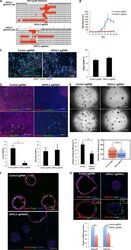
- Experimental details
- Figure 5. Mutation of GRHL2 in HBE cells using CRISPR/Cas9 inhibits the development of TER and differentiation of ciliated cells. (A) Sequences of 18 clones amplified from the target region of genomic DNA of selected cells transfected with any lentiCRISPR-GRHL2 sgRNA viruses. Target regions amplified from control cells showed no mutations. The red highlights are mismatched, missing, or inserted nucleotides. Asterisks indicate every 10 nucleotides of the genomic sequence. (B) Selected cells were cultured in ALI, and TER was measured every other day. Values are mean and SEM of triplicate wells, and data are from one of n = 4 biological replicates. Other replicates gave similar results. (C) At ALI day 3, cell proliferation was assayed using EdU incorporation over 2 h, and EdU and the BC marker Trp63 were analyzed by IHC. The right panel is quantification of the proportion of EdU + cells. P = 0.077 > 0.05. (D) Whole-mount IHC of control and GRHL2 mutant ALI cultures at day 21 for alpha-tubulin (ciliated cell marker), Muc5AC (secretory cell marker), and Grhl2. Note the presence of a small patch of cells that still express Grhl2 protein in the top right panel. The bottom panel is the quantification of the proportion of Foxj1 + ciliated and Muc5AC + secretory cells. Values are mean and SEM of triplicate wells from one donor. Other donors gave similar results. *, P < 0.05. (E) Representative DIC microscopy images of spheres at day 21 from BCs from two different donors. (Bottom) CFE o
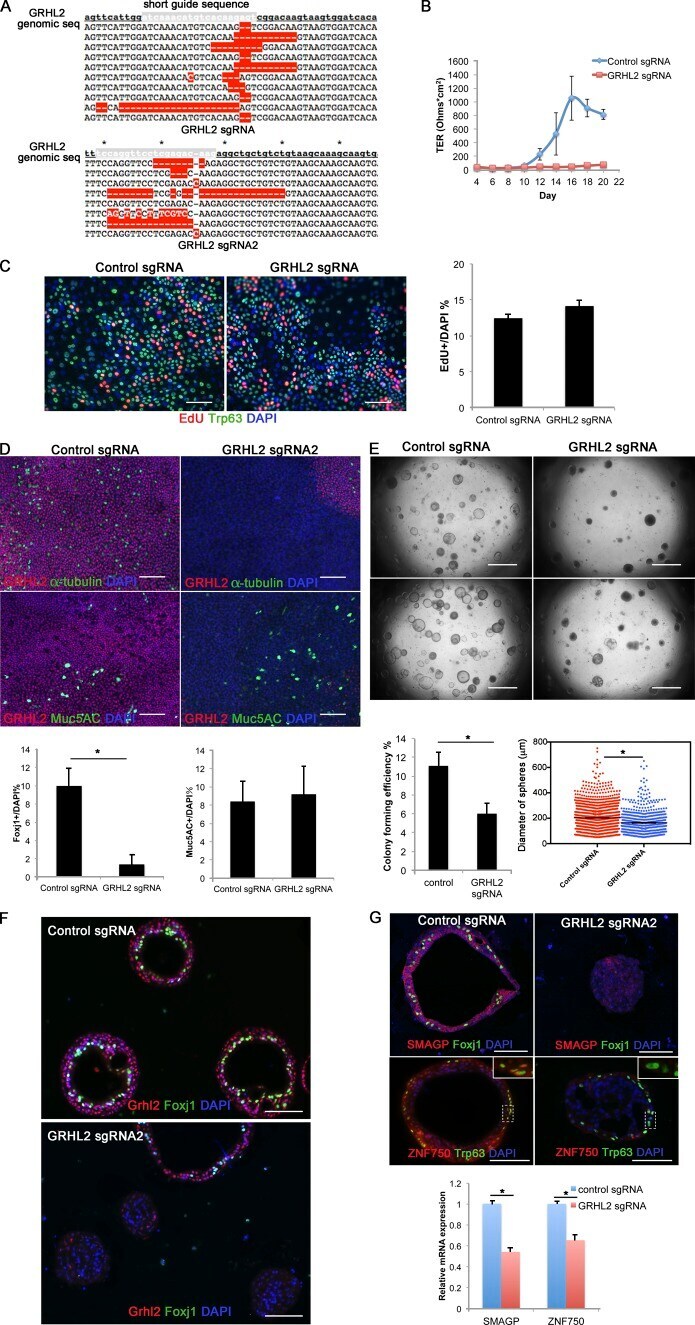
- Submitted by
- Invitrogen Antibodies (provider)
- Main image
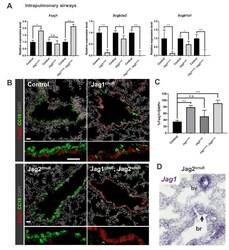
- Experimental details
- Figure 2. Jag1 and Jag2 collectively contribute to balance multiciliated and secretory cell fate in intrapulmonary airways. ( A ) qPCR analysis: markers of multiciliated ( Foxj1) and secretory cell fate ( Scgb3a2, Scgb1a1 [ CC10 ]) in mutant and respective control lung homogenates (n = 4 Jag1 control, n = 3 Jag1 c ; n = 4 Jag2 control; n = 4 Jag2 c ; n = 4 Jag1/Jag2 control; n = 4 Jag1 c ; Jag2 c ). Decreased expression of secretory markers and increased Foxj1 predominantly in Jag1 c and in double Jag1 c ; Jag2 c . Graphs represent mean +- SEM. Student's t-test: differences statistically significant at *p
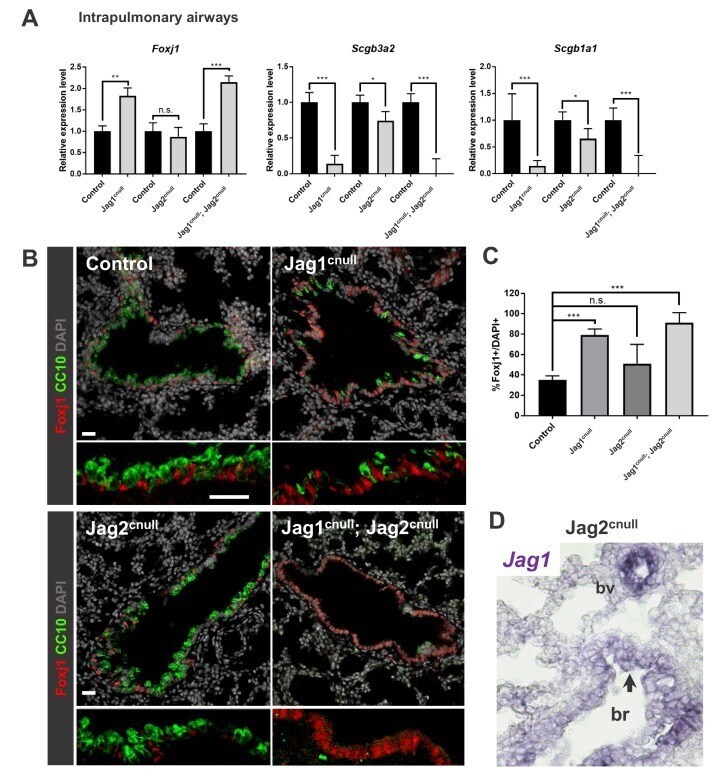
- Submitted by
- Invitrogen Antibodies (provider)
- Main image
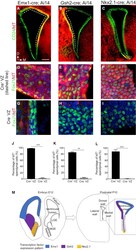
- Experimental details
- Figure 1 Ependymal Cell Progenitors Are Produced Locally along the Brain Ventricles (A-C) Representative images of coronal sections of Emx1-Cre; Ai14 (A), Gsh2-Cre; Ai14 (B), and Nkx2.1-Cre; Ai14 (C) forebrain at P10, immunostained with CD24 (green) and DsRed (tdT, red) antibodies. CD24 + tdT + ependymal cells are only observed in the Cre-expressing domains in each mouse line (indicated by a dashed line). (D-I) Representative high-magnification images of the Emx1-Cre; Ai14 (D and G), Gsh2-Cre; Ai14 (E and H), and Nkx2.1-Cre; Ai14 (F and I) coronal sections immunostained with FoxJ1 (green) and DsRed (tdT, red) antibodies in the Cre + domains (D-F) or Cre - domains (G-I), respectively. In the Cre + domains, almost all ependymal cells are tdT + , whereas very few cells are double-labeled in the Cre - domains in each mouse line. (J-L) Quantification of the mean percentage of tdT + ependymal cells in different areas of the ventricular zone from n = 6, n = 4, and n = 5 mice from each of the three transgenic mouse lines: Emx1-Cre; Ai14 (J), Gsh2-Cre; Ai14 (K), and Nkx2.1-Cre; Ai14 (L), respectively. Error bars indicate the SEM. The p values were determined with a Mann-Whitney test; ** p
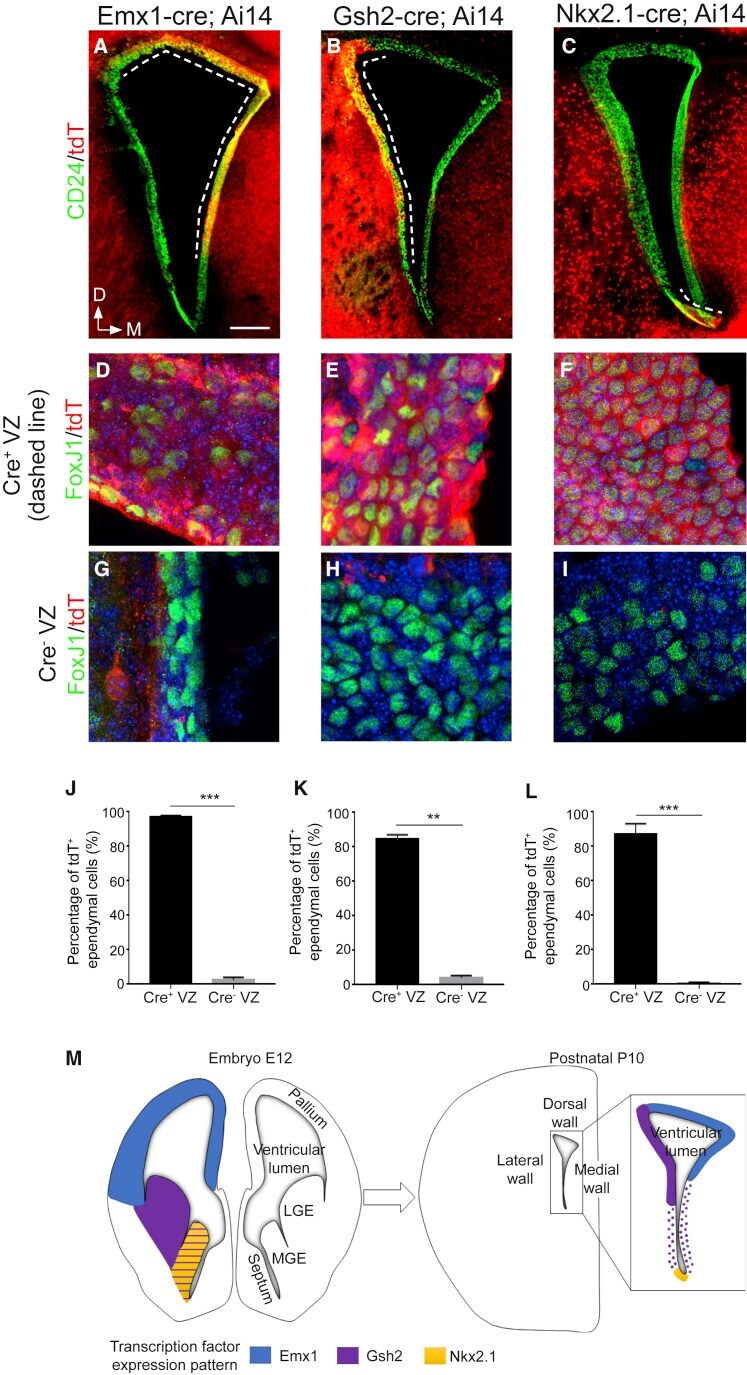
- Submitted by
- Invitrogen Antibodies (provider)
- Main image

- Experimental details
- Figure 2 Radial Glial Cells Generate Ependymal Cells and Adult Neural Stem Cells (Type B1 Astrocytes) (A) Experimental schematic for (B)-(D). The H2B-GFP-expressing plasmid was electroporated in utero at E14.5 and analyzed on V-SVZ whole-mount (WM) at P15. CC, corpus callosum; Cx, cortex; LV, lateral ventricle; R, rostral; D, dorsal. (B and D) P15 V-SVZ whole-mounts were double-immunostained with FoxJ1 (red) and Sox9 (blue) antibodies (B) or FOP (white) and GFAP (red) antibodies (D). GFP + FoxJ1 + Sox9 + ependymal cells are indicated by arrows, and GFP + FoxJ1 - Sox9 + astrocytes are outlined in white (B). GFP + GFAP - ependymal cells with multiple FOP + dots are indicated by arrows, and a GFP + GFAP + astrocyte with a FOP + centrosome is indicated by an arrowhead (D). (C) Mean percentage of astrocytes (Sox9 + FoxJ1 - ), ependymal cells (Sox9 + FoxJ1 + ), and others (Sox9 - FoxJ1 - ) among H2B-GFP + electroporated cells. Analyses were done on n = 3 animals; a total of 441 cells were counted. Error bars represent the SEM. The p values were determined with a two-proportion Z test; *** p
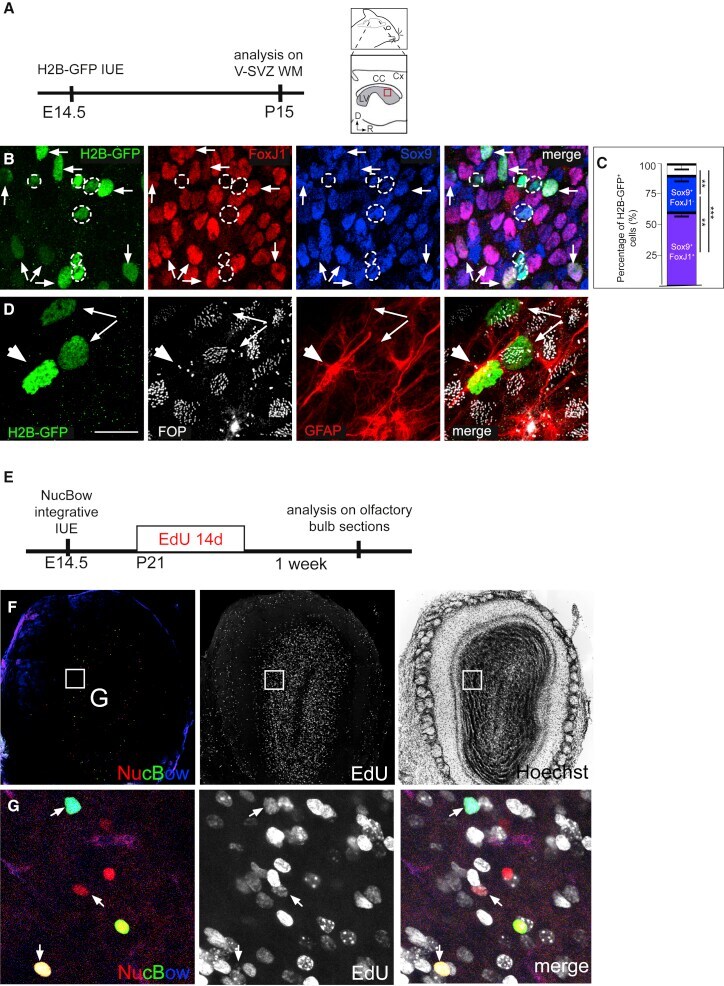
- Submitted by
- Invitrogen Antibodies (provider)
- Main image
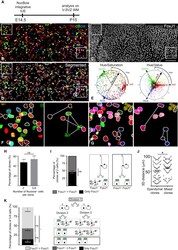
- Experimental details
- Figure 3 Clonal Analysis of Ependymal Cells with MAGIC Markers Reveals Both Symmetric and Asymmetric Divisions of RGCs (A) Experimental schematic. Nucbow plasmids were electroporated in utero at E14.5 and analyzed at P15-P20. (B-D) Representative Z-projected image of an en face view of the V-SVZ (B) immunostained at P15 with anti-FoxJ1 antibody (C). (D) shows a segmented image of (B) and (C), obtained using FoxJ1 staining, as a reference ( STAR Methods ; Figures S3-S5 ). FoxJ1 + Nucbow + cells are outlined in white. (E) Circular hue-saturation and hue-value plots of all Nucbow + cells from (D). (F and G) High-magnification images of the insets in (D), showing examples of clones: 2 ependymal doublets and 1 triplet containing 1 ependymal cell and 2 FoxJ1 - cells (F) and 3 ependymal doublets, 1 ependymal triplet, and 1 triplet containing 1 ependymal cell and 2 FoxJ1 - cells (G). (H) Mean percentages of clones containing 2 or 3-8 Nucbow + cells. Error bars represent the SEM of n = 163 clones of 2 cells and n = 186 clones of 3-8 cells; p values were determined by Mann-Whitney test; ns, p > 0.05. (I) Mean percentages of clones of 2 Nucbow + cells containing 1 (mixed clones, gray) or 2 (ependymal clones, black) FoxJ1 + cells. Error bars represent the SEM of n = 82 ependymal clones and n = 81 mixed clones from 6 independent experiments; p values were determined by Mann-Whitney test; ns, p > 0.05. (J) Average 3D distances between the cells composing ependymal or mixed clon
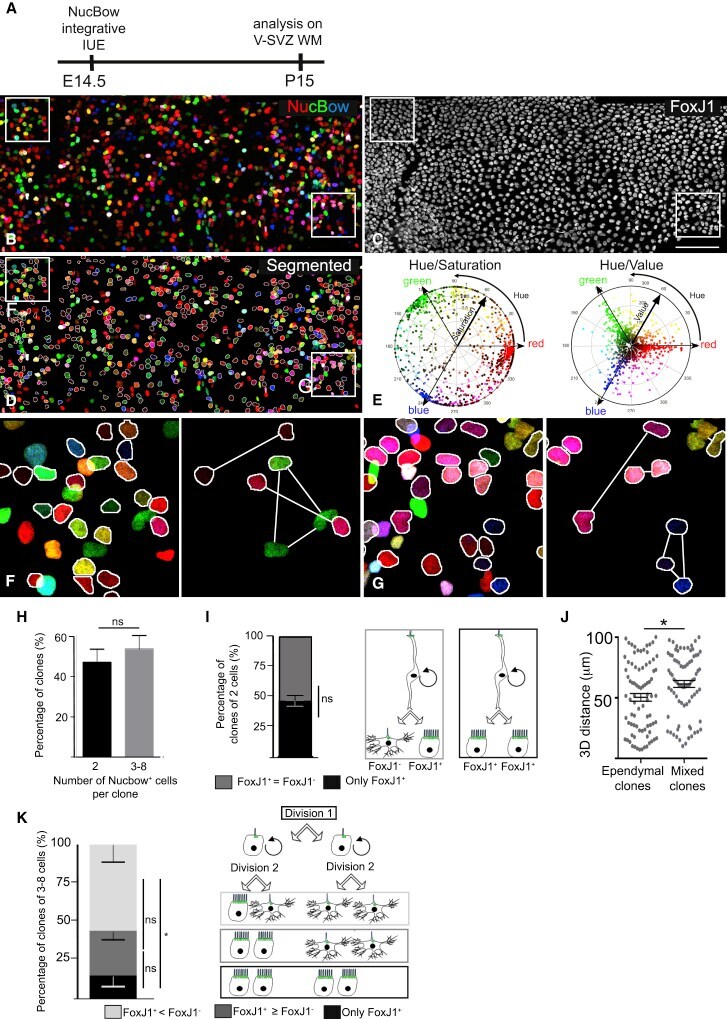
- Submitted by
- Invitrogen Antibodies (provider)
- Main image
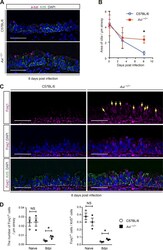
- Experimental details
- Figure 6. Ciliated cell regeneration is promoted in Axl -/- mice at an early phase of influenza virus-induced epithelial injury in vivo. (A) Immunostaining of cilia (acetylated tubulin, magenta) and basal cells (Krt5, green) of mouse tracheas at day 8 after H1N1/PR8 influenza A virus infection. (B) Quantification of area covered by cilia/um of airways. (C) Immunostaining of ciliated cells (Foxj1, magenta) and basal cells (Krt5, green) of mouse tracheas 8 d after infection of C57BL/6 or Axl-deficient mice. Yellow arrows indicate nuclear staining of Foxj1 in ciliated cells. (D) Quantification of the number of Foxj1 + ciliated cells/um of airways (left graph) and the ratio of Foxj1 + cells to Krt5 + basal cells (right graph). Data are representative of two independent experiments and are expressed as mean +- SEM of three individual mice (B and D). *, P < 0.05 vs. C57BL/6; two-tailed unpaired t test. Nuclei (blue) were stained with DAPI, and scale bars represent 25 um (A and C).

- Submitted by
- Invitrogen Antibodies (provider)
- Main image
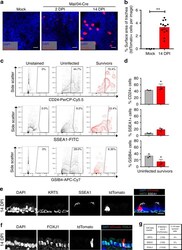
- Experimental details
- Fig. 3 IBV survivor cell populations are predominantly composed of cells expressing ciliated cell markers. a Tracheas were collected from Mock and Mal/04-Cre infected mice at 2 and 14 DPI then opened longitudinally and flattened to image the surface area of the whole-mount tracheal epithelium. Scale bar = 25 mum. b Quantification of apical surface area covered by tdTomato+ survivor cells from whole-mount trachea images. n = 4, 12 images per group, respectively, Student's T -test. c Flow cytometry of 14 DPI tdTomato- (uninfected cells) and 14 DPI tdTomato+ (survivor cells) from the lungs of Mal/04-Cre infected mice, where cells are stained with CD24 (ciliated), SSEA-1 (secretory), GSIB4 (basal) cell surface markers. d Quantification of flow cytometry. n = 3 mice per group. e Cross-sectioned microscopy of murine tracheal epithelial cells from mice 14 days post-infection with Mal/04-Cre stained with KRT5 to label basal stem cells and SSEA-1 to label secretory cells. f Cross-sectioned microscopy of murine tracheal epithelial cells from mice 14 days post-infection with Mal/04-Cre stained with FOXJ1 to label ciliated cells. g Quantification of tdTomato+ survivor cells stained with cell-specific markers: KRT5, SSEA-1, and FOXJ1 compiled from two independent experiments. Data are presented as the number of marker+ cells out of total tdTomato+ cells and the percentage was calculated for marker+ cells out of total tdTomato+ cells imaged. S.E.M was plotted to indicate variability around

- Submitted by
- Invitrogen Antibodies (provider)
- Main image
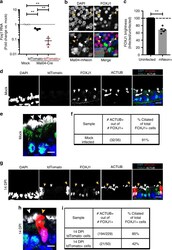
- Experimental details
- Fig. 5 Ciliated-like survivor cells display reduced expression of ciliated cell transcription factors and fail to elaborate surface cilia. a Quantitative RT-PCR measuring RNA levels of Forkhead Box J1 (Foxj1) in flow sorted EpCam+ CD24+ mock infected cells, tdTomato- (uninfected cells), and tdTomato+ (survivor cells) at 14 days post-infection. n = 3 mice per sample, one-way ANOVA. b Air-liquid interface differentiated cultures of primary murine epithelial cells were infected with Mal/04-mNeon (green) and stained for FOXJ1 (red). White arrows = mNeon+ (infected cells), yellow arrows = mNeon- (uninfected cells). c Quantification of FOXJ1 brightness per cell, normalized to brightness of uninfected cells. n = 6 images, at least four cells quantified per image for each group, Student's T -test. d Microscopy of cross-sectioned murine tracheas from mock infected mice where epithelial cells were stained for FOXJ1 and acetylated tubulin for mature cilia. White arrow = tdTomato- (uninfected cells) with intact cilia. e Close-up panel of uninfected murine tracheal ciliated cells stained for FOXJ1 and ACTUB. White arrow = tdTomato- (uninfected cells) with intact cilia. f Quantification of uninfected cells that are double positive for FOXJ1 and ACTUB. g Microscopy of cross-sectioned murine tracheas from Mal/04-Cre infected mice at 14 DPI where epithelial cells were stained for FOXJ1 and ACTUB. White arrow = tdTomato- (uninfected cells) with intact cilia, yellow arrows = tdTomato+ (survivor

- Submitted by
- Invitrogen Antibodies (provider)
- Main image
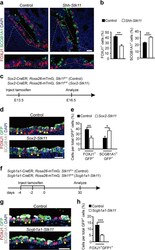
- Experimental details
- Fig. 2 Loss of Stk11 in airway progenitor cells impairs ciliated cell differentiation. a E16.5 lungs were stained with antibodies against FOXJ1 and SCGB1A1. b The proportion of FOXJ1 + cells (Left, n = 3) and SCGB1A1 + cells (Right, n = 4) in the intrapulmonary airways of E16.5 lungs. c Pregnant mice carrying Sox2 -CreER; Rosa26 -mTmG; Stk11 F/+ (Control) and Sox2 -CreER; Rosa26 -mTmG; Stk11 F/F ( Sox2 - Stk11 ) embryos were treated with tamoxifen at E13.5 and analyzed at E16.5. d E16.5 lungs were stained with antibodies against GFP, FOXJ1, and SCGB1A1. The yellow arrowheads indicate cells expressing both GFP and FOXJ1. e The proportion of FOXJ1 + GFP + cells to GFP + cells (Left) (Control, n = 6; Sox2 - Stk11 , n = 5) and SCGB1A1 + GFP + cells to GFP + cells (Right) ( n = 3) in the intrapulmonary airways of E16.5 lungs. f Ten-week-old mice were treated with three doses of tamoxifen and analyzed after 30 days. g Lungs were stained with antibodies against GFP, FOXJ1, and SCGB1A1 at day 30. The yellow arrowheads indicate cells expressing both GFP and FOXJ1. h The proportion of FOXJ1 + GFP + cells to GFP + cells at day 30 ( n = 4). * P < 0.05; ** P < 0.01; *** P < 0.001. Data shown in the graphs are means +- SEM. Student's t test. Scale bars: a , d : 25 mum, g : 20 mum
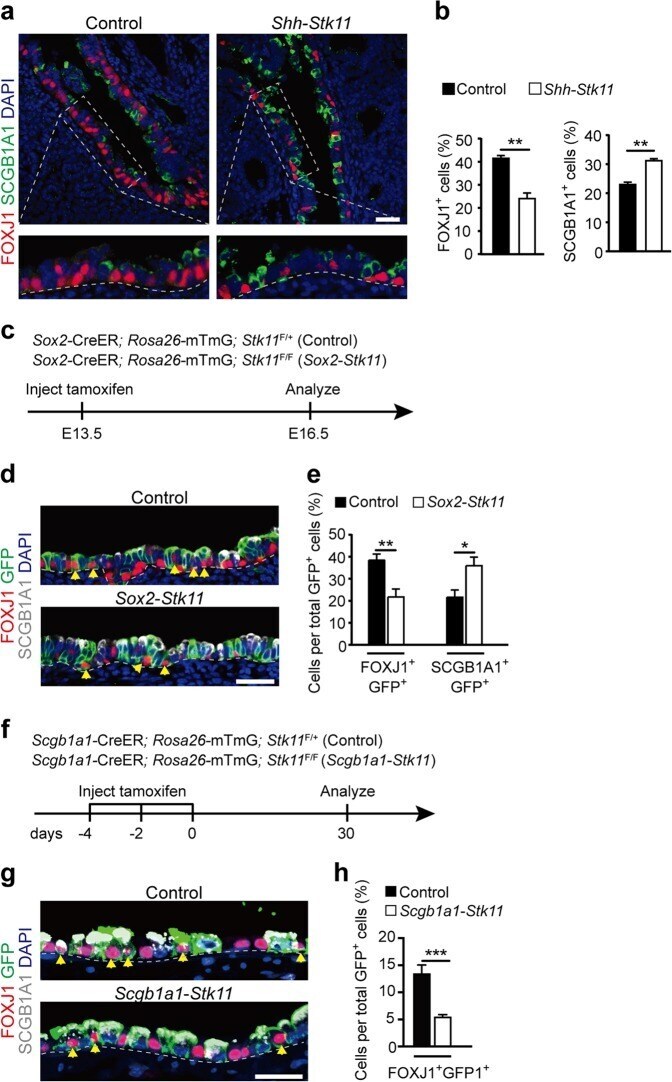
- Submitted by
- Invitrogen Antibodies (provider)
- Main image
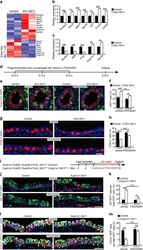
- Experimental details
- Fig. 3 Inhibiting cell proliferation partially rescues the impaired ciliated cell differentiation. a Heat map of the expression values of genes expressed differentially between E16.5 Shh - Stk11 lungs and control lungs. b Fold change of relative mRNA expression of airway epithelial cell genes in E16.5 Shh - Stk11 lungs compared to Control lungs ( n = 3). c Fold change of relative mRNA expression of cell-cycle genes in E16.5 Shh - Stk11 lungs compared to Control lungs ( n = 3). d Pregnant females were oral gavaged daily with a CDK4/6 inhibitor (PD0332991) each day from E12.5 to E14.5. Lungs were analyzed at E16.5. e Cell proliferation was analyzed by antibody staining against Ki67 and E-cadherin (E-cad). f The proportion of Ki67 + cells in the intrapulmonary airways of E16.5 lungs (vehicle Control, n = 5; vehicle Shh - Stk11 , n = 3; PD0332991 Control, n = 7; PD0332991 Shh - Stk11 , n = 8). g Immunofluorescence staining with antibodies against FOXJ1 and SCGB1A1 in lungs after either vehicle or PD0332991 treatment. h The proportion of FOXJ1 + cells (vehicle Control, n = 3; vehicle Shh - Stk11 , n = 4; PD0332991 Control, n = 3; PD0332991 Shh - Stk11 , n = 5) and the proportion of SCGB1A1 + cells ( n = 3) in the intrapulmonary airways of E16.5 lungs after either vehicle or PD0332991 treatment. i Ten-week-old mice were treated with three doses of tamoxifen. Mice were treated with PD0332991 or vehicle every other day via oral gavage and fed with water containing IdU for 30 days bef
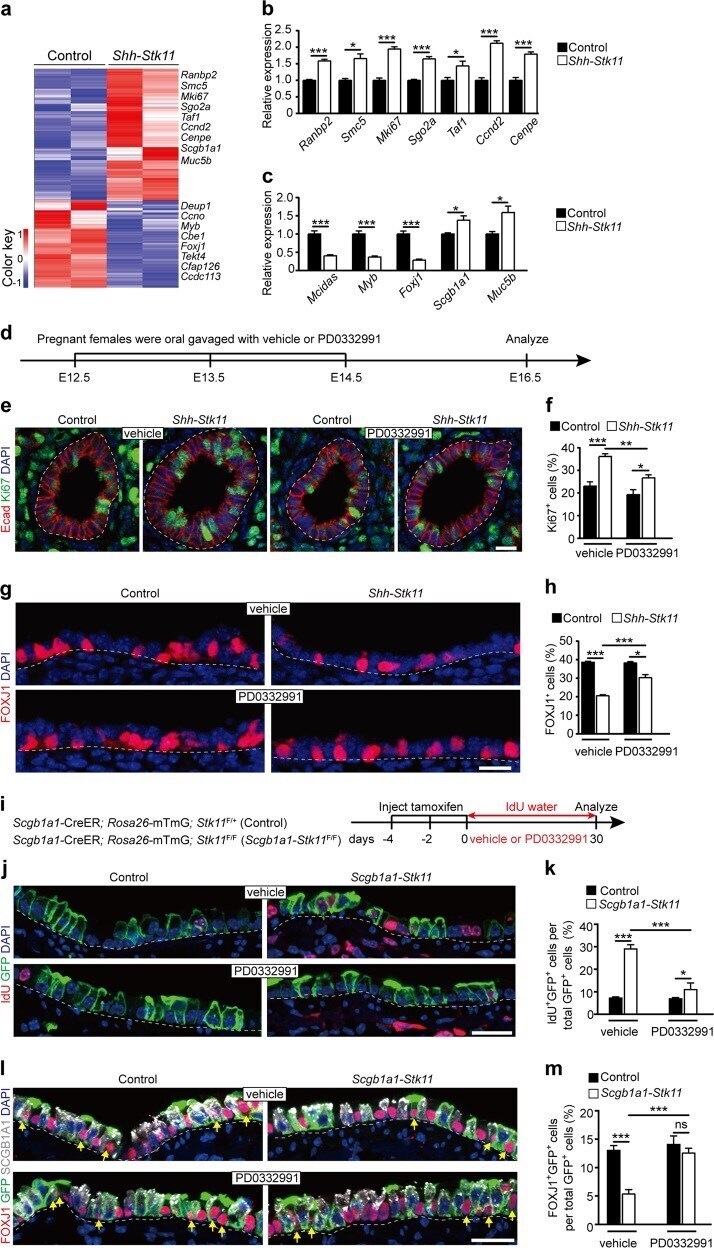
- Submitted by
- Invitrogen Antibodies (provider)
- Main image
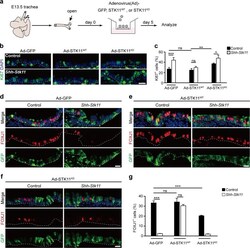
- Experimental details
- Fig. 4 The kinase activity of STK11 is required for ciliated cell differentiation. a A schematic illustration showing the air-liquid interphase trachea culture system of this study. Adenovirus (Ad)-GFP, STK11 WT , or STK11 KD particles were added into the medium at day 0. The tracheal rudiments were cultured with different adenovirus for 5 days. b , c The proportion of Ki67 + cells in the epithelium of cultured tracheal rudiments at day 5 ( c ) were quantified by Ki67 immunostaining ( b ) (Ad-GFP Control, n = 5; Ad-GFP Shh - Stk11 , n = 6; Ad-STK11 WT Control, n = 4; Ad-STK11 WT Shh - Stk11 , n = 5; Ad-STK11 KD Control, n = 4; Ad-STK11 KD Shh - Stk11 , n = 6). d - f Cultured tracheal rudiments were stained with antibodies against FOXJ1 and GFP at day 5. g The proportion of FOXJ1 + cells in the epithelium of cultured tracheal rudiments at day 5 (Ad-GFP Control, n = 3; Ad-GFP Shh - Stk11 , n = 3; Ad-STK11 WT Control, n = 3; Ad-STK11 WT Shh - Stk11 , n = 3; Ad-STK11 KD Control, n = 5; Ad-STK11 KD Shh - Stk11 , n = 3). ns, not significant; * P < 0.05; ** P < 0.01; *** P < 0.001. Data shown in the graphs are means +- SEM. Student's t test. Scale bars: 11 mum
- Submitted by
- Invitrogen Antibodies (provider)
- Main image
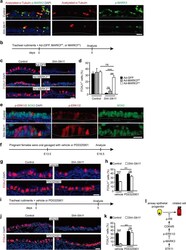
- Experimental details
- Fig. 5 A STK11/MARK3 cascade controls ciliated cell differentiation by limiting the activity of ERK1/2 signaling. a Immunofluorescence staining with antibodies against p-MARK3 and acetylated-alpha-Tubulin in E16.5 lungs. Yellow arrows indicate ciliated cells expressing both acetylated-alpha-Tubulin and p-MARK3. b E13.5 tracheal rudiments were cultured with Ad-GFP, Ad-MARK3 WT , or Ad-MARK3 CA viruses for 5 days. c , d Cultured tracheal rudiments were stained with antibodies against FOXJ1 at day 5 ( c ). The proportion of FOXJ1 + ciliated cells was quantified (Ad-GFP Control, n = 3; Ad-GFP Shh - Stk11 , n = 3; Ad-MARK3 WT Control, n = 3; Ad-MARK3 WT Shh - Stk11 , n = 4; Ad-MARK3 CA Control, n = 4; Ad-MARK3 CA Shh - Stk11 , n = 3) (d). e E16.5 lungs were stained with antibodies against p-ERK1/2 and SOX2. f Pregnant female mice were oral gavaged with p-ERK1/2 inhibitor PD0325901 or vehicle at E13.5. Lungs were analyzed at E16.5. g , h Immunofluorescence staining with antibodies against FOXJ1 in the vehicle-treated or PD0325901-treated lungs ( g ). The proportion of FOXJ1 + cells ( n = 3) and the proportion of SCGB1A1 + cells ( n = 3) in the intrapulmonary airways of E16.5 lungs were quantified ( h ). i E13.5 tracheal rudiments were cultured with vehicle or PD0325901 for 5 days. j , k Cultured tracheal rudiments were stained with antibodies against FOXJ1 at day 5 (j). The proportion of FOXJ1 + ciliated cells was quantified (vehicle Control, n = 4; vehicle Shh - Stk11 , n = 3; PD0
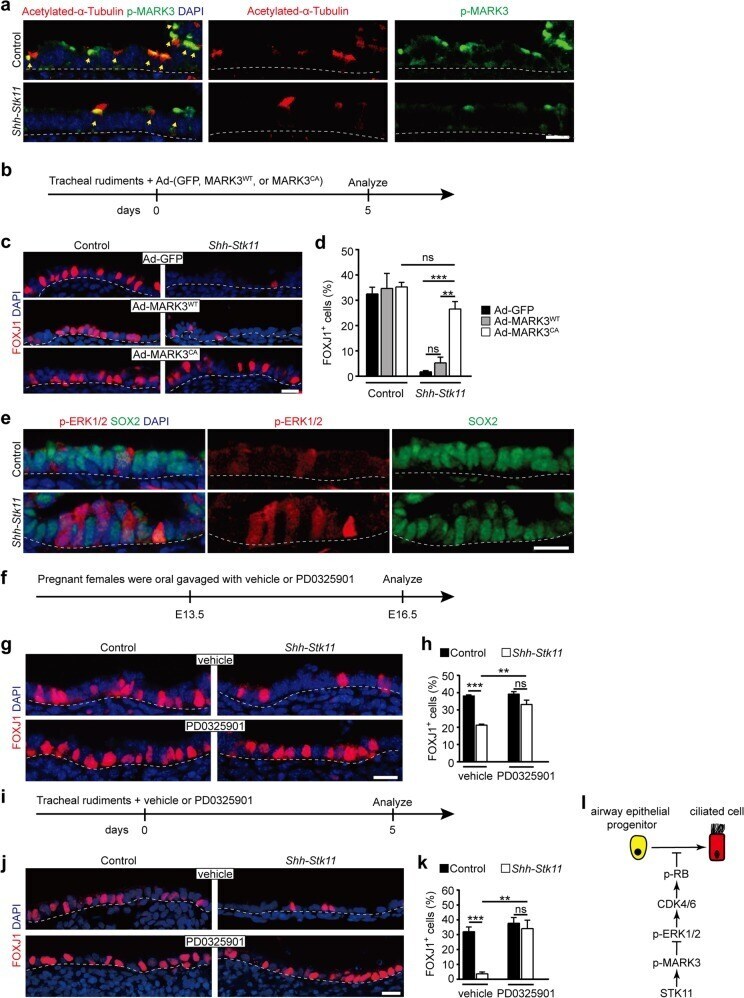
- Submitted by
- Invitrogen Antibodies (provider)
- Main image
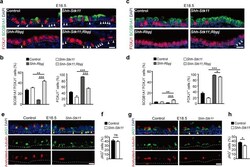
- Experimental details
- Fig. 6 STK11 ensures the ciliated cell fate commitment. a Immunofluorescence staining with antibodies against FOXJ1 and SCGB1A1 in the E16.5 lungs. White arrowheads indicate cells that do not express SCGB1A1 and FOXJ1. b The proportion of SCGB1A1 - FOXJ1 - cells (Left), and the proportion of FOXJ1 + cells (Right) in the intrapulmonary airways of E16.5 lungs ( n = 3). c Immunofluorescence staining with antibodies against FOXJ1 and SCGB1A1 in the E18.5 lungs. White arrowheads indicate cells that do not express SCGB1A1 and FOXJ1. d The proportion of SCGB1A1 - FOXJ1 - cells (Left), and the proportion of FOXJ1 + cells (Right) in the intrapulmonary airways of E18.5 lungs ( n = 3). e Immunofluorescence staining with antibodies against acetylated-alpha-tubulin and JAG1 (JAGGED1) in E16.5 lungs. Yellow arrowheads indicate the acetylated-alpha-tubulin - cells that express JAG1. f The proportion of JAG1 + cells in the intrapulmonary airways of E16.5 lungs (Control, n = 4; Shh - Stk11 , n = 4). g Immunofluorescence staining with antibodies against acetylated-alpha-tubulin and JAG1 in E18.5 lungs. Yellow arrowheads indicate the acetylated-alpha-tubulin - cells that express JAG1. h The proportion of JAG1 + cells in the intrapulmonary airways of E18.5 lungs (Control, n = 4; Shh - Stk11 , n = 5). ns, not significant; * P < 0.05; ** P < 0.01; *** P < 0.001. Data shown in the graphs are means +- SEM. Student's t -test. Scale bars: 11 mum
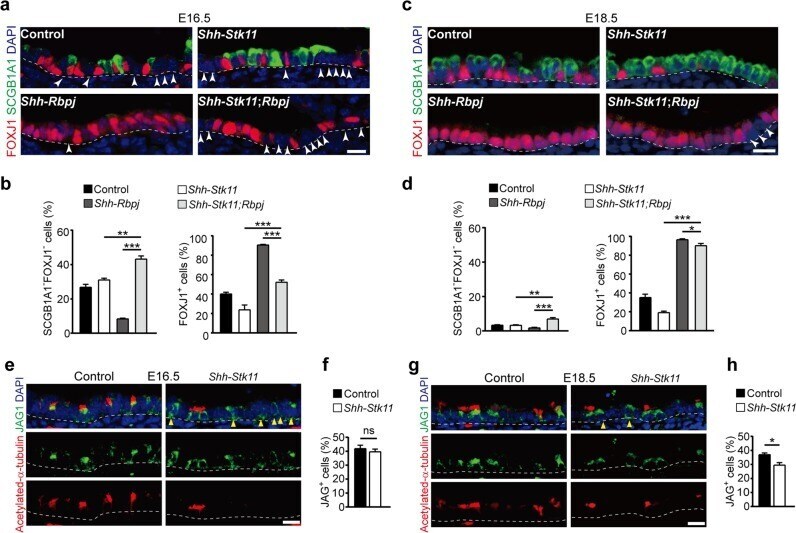
- Submitted by
- Invitrogen Antibodies (provider)
- Main image
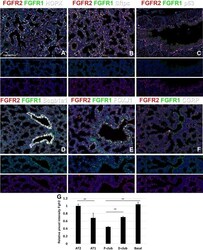
- Experimental details
- Figure 3 Fgfr1 and Fgfr2 expression during late embryonic lung development in specific epithelial lineages. (A-E) Immunostaining on E18.5 Fgfr1-Cerulean;Fgfr2-mCherry lungs for GFP (Fgfr1-Cerulean), RFP (Fgfr2-mCherry, red), Hopx (white), Sftpc (white), p63 (white), Scgb1a1 (white), Foxj1 (white), or CGRP (white). (G) Quantification of relative average pixel intensity for Fgfr2 in alveolar type 2 (AT2) cells, AT1 cells, proximal and distal club cells and tracheal basal cells at E18.5. Data are mean +- s.e.m. **P < 0.01, as determined by a two-tailed t-test; n = 6 biological replicates for each experimental group. Scale bars, 100 um.
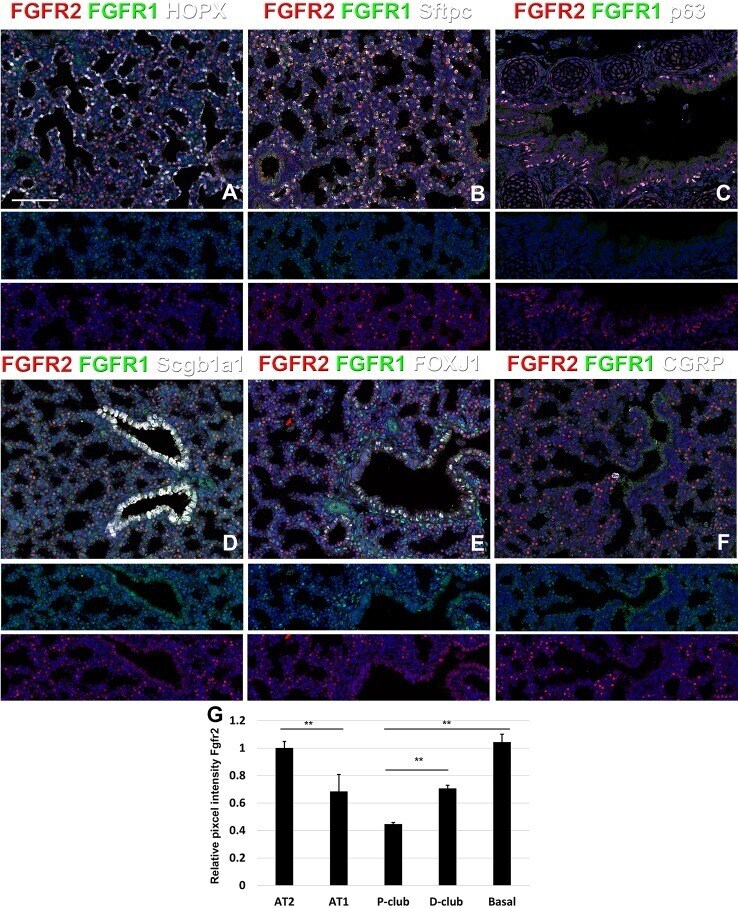
- Submitted by
- Invitrogen Antibodies (provider)
- Main image
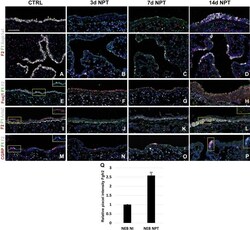
- Experimental details
- Figure 5 Fgfr1 and Fgfr2 expression in the adult lung after naphthalene injury. (A-P) Immunostaining on ctrl and naphthalene injured adult Fgfr1-Cerulean;Fgfr2-mCherry lungs for GFP (Fgfr1-Cerulean, green), RFP (Fgfr2-mCherry, red), Scgb1a1 (white), Foxj1 (white), Acta2 (white), or CGRP (white) (arrowheads indicate double labeled cells whereas frames show only GFP and RFP). (Q) Quantification of relative average pixel intensity for Fgfr2 in NEBs after naphthalene injury. Data are mean +- s.e.m. **P < 0.01, as determined by a two-tailed t-test; n >= 5 biological replicates for each experimental group. Scale bars, 100 um.