 Explore
 Validate
 Learn
Learn ELISA
ELISA Other assay
Antibody data
- Antibody Data
- Antigen structure
- References [17]
- Comments [0]
- Validations
- Other assay [13]
Submit
Validation data
Reference
Comment
Report error
- Product number
- 14-7049-81 - Provider product page

- Provider
- Invitrogen Antibodies
- Product name
- IL-4 Monoclonal Antibody (8D4-8), eBioscience™
- Antibody type
- Monoclonal
- Antigen
- Other
- Description
- Description: The 8D4-8 antibody reacts with human interleukin-4 (IL-4), a 15-19 kDa cytokine secreted by Th2 cells. Applications Reported:The 8D4-8 antibody has been reported for use in capture of human IL-4 by ELISA and in intracellular staining for flow cytometric analysis. Applications Tested: The 8D4-8 antibody has been tested as the capture antibody in a sandwich ELISA for analysis of human Interleukin-4 (IL-4) in combination with the biotinylated MP4-25D2 (Product # 13-7048-81) antibody for detection and recombinant human IL-4 (Product # 14-8049-80) as the standard. A suitable range of concentrations of this antibody for ELISA capture is 1-4 µg/mL. A standard curve consisting of doubling dilutions of the recombinant standard over the range of 500 pg/mL - 4 pg/mL should be included in each ELISA plate. The fluorochrome-conjugated 8D4-8 antibody has been tested by intracellular staining for flow cytometric analysis. This can be used at less than or equal to 0.5 µg per test. A test is defined as the amount (µg) of antibody that will stain a cell sample in a final volume of 100 µL. Cell number should be determined empirically but can range from 10^5 to 10^8 cells/test. It is recommended that the antibody be carefully titrated for optimal performance in the assay of interest. Purity: Greater than 90%, as determined by SDS-PAGE. Aggregation:Less than 10%, as determined by HPLC. Filtration: 0.2 µm post-manufacturing filtered.
- Reactivity
- Human
- Host
- Mouse
- Isotype
- IgG
- Antibody clone number
- 8D4-8
- Vial size
- 50 µg
- Concentration
- 0.5 mg/mL
- Storage
- 4° C
Submitted references Cord Blood T Cells Expressing High and Low PKCζ Levels Develop into Cells with a Propensity to Display Th1 and Th9 Cytokine Profiles, Respectively.
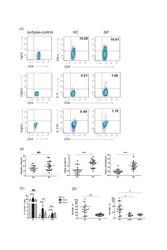
Th2 Biased Immunity With Altered B Cell Profiles in Circulation of Patients With Sporotrichosis Caused by Sporothrix globosa.
Serum Amyloid A Proteins Induce Pathogenic Th17 Cells and Promote Inflammatory Disease.
Platelet-Derived GARP Induces Peripheral Regulatory T Cells-Potential Impact on T Cell Suppression in Patients with Melanoma-Associated Thrombocytosis.
Neutrophils express pro- and anti-inflammatory cytokines in granulomas from Mycobacterium tuberculosis-infected cynomolgus macaques.
CD4 T cell loss and Th2 and Th17 bias are associated with the severity of severe fever with thrombocytopenia syndrome (SFTS).
A molecular signature of preclinical rheumatoid arthritis triggered by dysregulated PTPN22.
Brief Report: IFIH1 Mutation Causes Systemic Lupus Erythematosus With Selective IgA Deficiency.
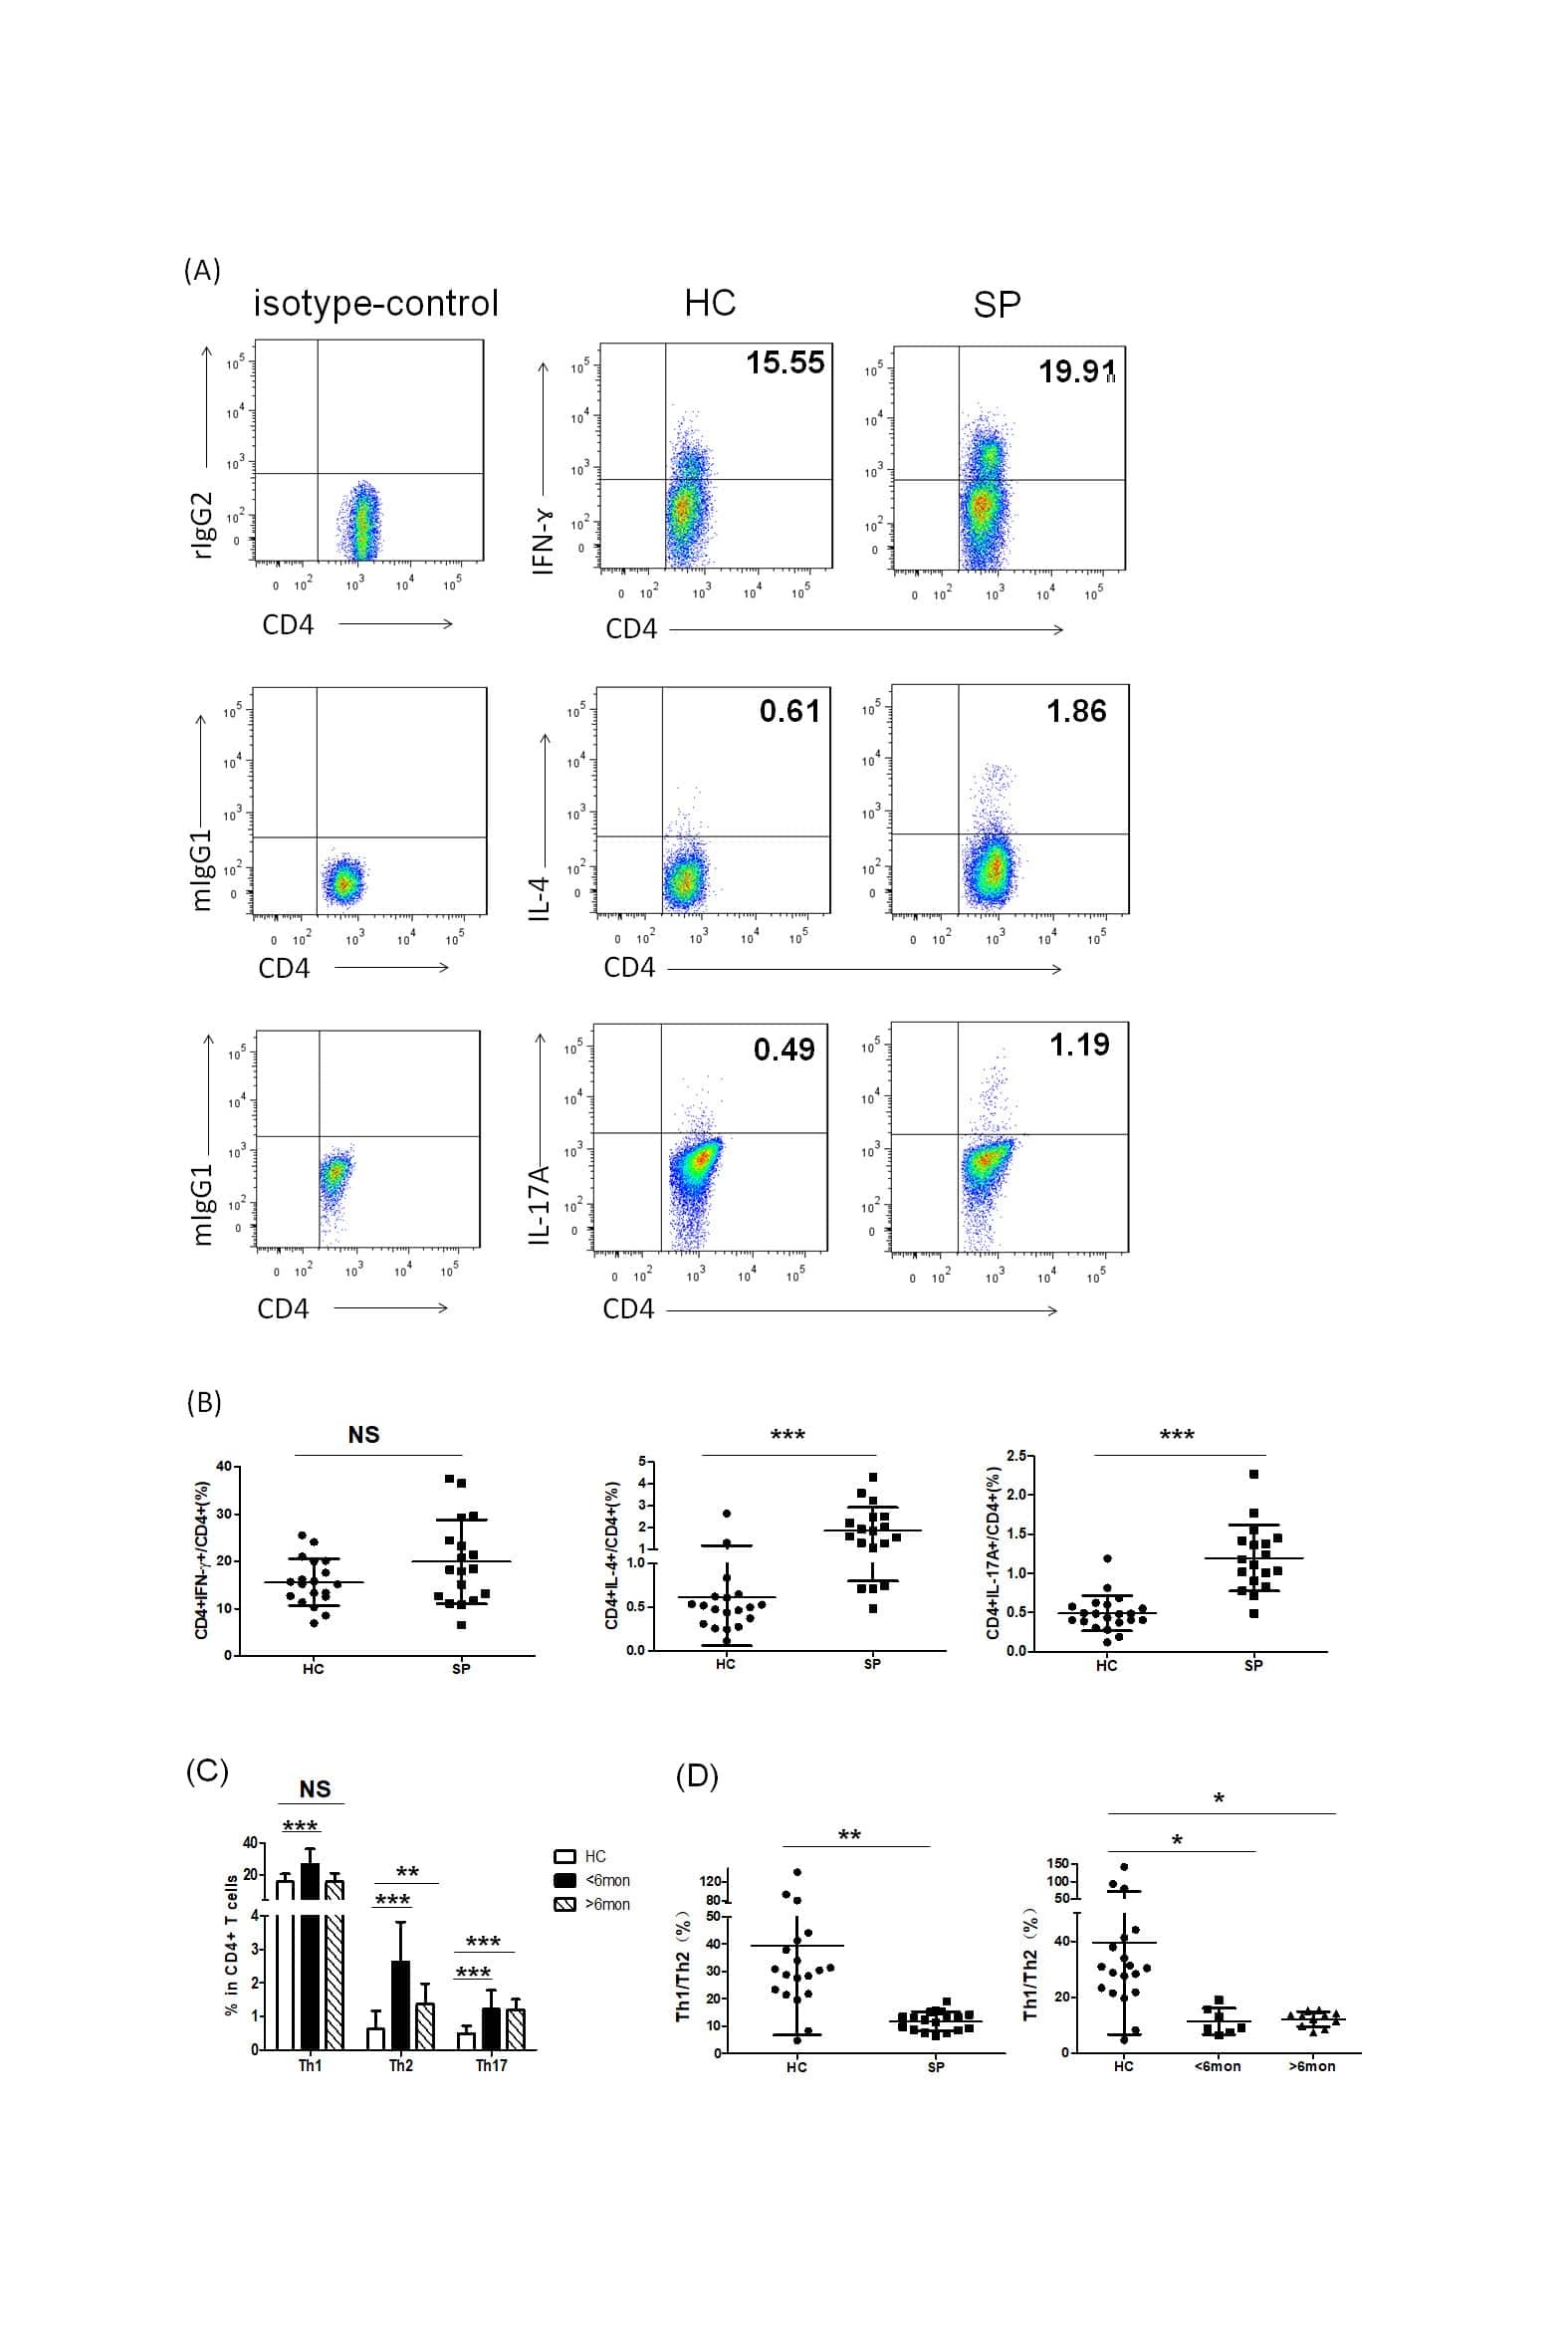
A SnoRNA-derived piRNA interacts with human interleukin-4 pre-mRNA and induces its decay in nuclear exosomes.
Potential role of IL-17-producing iNKT cells in type 1 diabetes.
Akt-dependent enhanced migratory capacity of Th17 cells from children with lupus nephritis.
Autosomal dominant immune dysregulation syndrome in humans with CTLA4 mutations.
B cells in T follicular helper cell development and function: separable roles in delivery of ICOS ligand and antigen.
Simian immunodeficiency virus-induced changes in T cell cytokine responses in cynomolgus macaques with latent Mycobacterium tuberculosis infection are associated with timing of reactivation.
Anticardiac myosin immunity and chronic allograft vasculopathy in heart transplant recipients.
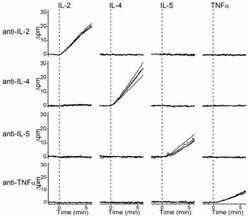
Rapid, multiparameter profiling of cellular secretion using silicon photonic microring resonator arrays.
Development of immunoassays for human interleukin 3 and interleukin 4, some of which discriminate between different recombinant DNA-derived molecules.
Perveen K, Quach A, McPhee A, Prescott SL, Barry SC, Hii CS, Ferrante A
International journal of molecular sciences 2021 May 5;22(9)
International journal of molecular sciences 2021 May 5;22(9)
Th2 Biased Immunity With Altered B Cell Profiles in Circulation of Patients With Sporotrichosis Caused by Sporothrix globosa.
Zu J, Yao L, Song Y, Cui Y, Guan M, Chen R, Zhen Y, Li S
Frontiers in immunology 2020;11:570888
Frontiers in immunology 2020;11:570888
Serum Amyloid A Proteins Induce Pathogenic Th17 Cells and Promote Inflammatory Disease.
Lee JY, Hall JA, Kroehling L, Wu L, Najar T, Nguyen HH, Lin WY, Yeung ST, Silva HM, Li D, Hine A, Loke P, Hudesman D, Martin JC, Kenigsberg E, Merad M, Khanna KM, Littman DR
Cell 2020 Jan 9;180(1):79-91.e16
Cell 2020 Jan 9;180(1):79-91.e16
Platelet-Derived GARP Induces Peripheral Regulatory T Cells-Potential Impact on T Cell Suppression in Patients with Melanoma-Associated Thrombocytosis.
Zimmer N, Krebs FK, Zimmer S, Mitzel-Rink H, Kumm EJ, Jurk K, Grabbe S, Loquai C, Tuettenberg A
Cancers 2020 Dec 5;12(12)
Cancers 2020 Dec 5;12(12)
Neutrophils express pro- and anti-inflammatory cytokines in granulomas from Mycobacterium tuberculosis-infected cynomolgus macaques.
Gideon HP, Phuah J, Junecko BA, Mattila JT
Mucosal immunology 2019 Nov;12(6):1370-1381
Mucosal immunology 2019 Nov;12(6):1370-1381
CD4 T cell loss and Th2 and Th17 bias are associated with the severity of severe fever with thrombocytopenia syndrome (SFTS).
Li MM, Zhang WJ, Weng XF, Li MY, Liu J, Xiong Y, Xiong SE, Zou CC, Wang H, Lu MJ, Yang DL, Peng C, Zheng X
Clinical immunology (Orlando, Fla.) 2018 Oct;195:8-17
Clinical immunology (Orlando, Fla.) 2018 Oct;195:8-17
A molecular signature of preclinical rheumatoid arthritis triggered by dysregulated PTPN22.
Chang HH, Liu GY, Dwivedi N, Sun B, Okamoto Y, Kinslow JD, Deane KD, Demoruelle MK, Norris JM, Thompson PR, Sparks JA, Rao DA, Karlson EW, Hung HC, Holers VM, Ho IC
JCI insight 2016 Oct 20;1(17):e90045
JCI insight 2016 Oct 20;1(17):e90045
Brief Report: IFIH1 Mutation Causes Systemic Lupus Erythematosus With Selective IgA Deficiency.
Van Eyck L, De Somer L, Pombal D, Bornschein S, Frans G, Humblet-Baron S, Moens L, de Zegher F, Bossuyt X, Wouters C, Liston A
Arthritis & rheumatology (Hoboken, N.J.) 2015 Jun;67(6):1592-7
Arthritis & rheumatology (Hoboken, N.J.) 2015 Jun;67(6):1592-7
A SnoRNA-derived piRNA interacts with human interleukin-4 pre-mRNA and induces its decay in nuclear exosomes.
Zhong F, Zhou N, Wu K, Guo Y, Tan W, Zhang H, Zhang X, Geng G, Pan T, Luo H, Zhang Y, Xu Z, Liu J, Liu B, Gao W, Liu C, Ren L, Li J, Zhou J, Zhang H
Nucleic acids research 2015 Dec 2;43(21):10474-91
Nucleic acids research 2015 Dec 2;43(21):10474-91
Potential role of IL-17-producing iNKT cells in type 1 diabetes.
Li S, Joseph C, Becourt C, Klibi J, Luce S, Dubois-Laforgue D, Larger E, Boitard C, Benlagha K
PloS one 2014;9(4):e96151
PloS one 2014;9(4):e96151
Akt-dependent enhanced migratory capacity of Th17 cells from children with lupus nephritis.
Kshirsagar S, Riedl M, Billing H, Tönshoff B, Thangavadivel S, Steuber C, Staude H, Wechselberger G, Edelbauer M
Journal of immunology (Baltimore, Md. : 1950) 2014 Nov 15;193(10):4895-903
Journal of immunology (Baltimore, Md. : 1950) 2014 Nov 15;193(10):4895-903
Autosomal dominant immune dysregulation syndrome in humans with CTLA4 mutations.
Schubert D, Bode C, Kenefeck R, Hou TZ, Wing JB, Kennedy A, Bulashevska A, Petersen BS, Schäffer AA, Grüning BA, Unger S, Frede N, Baumann U, Witte T, Schmidt RE, Dueckers G, Niehues T, Seneviratne S, Kanariou M, Speckmann C, Ehl S, Rensing-Ehl A, Warnatz K, Rakhmanov M, Thimme R, Hasselblatt P, Emmerich F, Cathomen T, Backofen R, Fisch P, Seidl M, May A, Schmitt-Graeff A, Ikemizu S, Salzer U, Franke A, Sakaguchi S, Walker LSK, Sansom DM, Grimbacher B
Nature medicine 2014 Dec;20(12):1410-1416
Nature medicine 2014 Dec;20(12):1410-1416
B cells in T follicular helper cell development and function: separable roles in delivery of ICOS ligand and antigen.
Weinstein JS, Bertino SA, Hernandez SG, Poholek AC, Teplitzky TB, Nowyhed HN, Craft J
Journal of immunology (Baltimore, Md. : 1950) 2014 Apr 1;192(7):3166-79
Journal of immunology (Baltimore, Md. : 1950) 2014 Apr 1;192(7):3166-79
Simian immunodeficiency virus-induced changes in T cell cytokine responses in cynomolgus macaques with latent Mycobacterium tuberculosis infection are associated with timing of reactivation.
Mattila JT, Diedrich CR, Lin PL, Phuah J, Flynn JL
Journal of immunology (Baltimore, Md. : 1950) 2011 Mar 15;186(6):3527-37
Journal of immunology (Baltimore, Md. : 1950) 2011 Mar 15;186(6):3527-37
Anticardiac myosin immunity and chronic allograft vasculopathy in heart transplant recipients.
Kalache S, Dinavahi R, Pinney S, Mehrotra A, Cunningham MW, Heeger PS
Journal of immunology (Baltimore, Md. : 1950) 2011 Jul 15;187(2):1023-30
Journal of immunology (Baltimore, Md. : 1950) 2011 Jul 15;187(2):1023-30
Rapid, multiparameter profiling of cellular secretion using silicon photonic microring resonator arrays.
Luchansky MS, Bailey RC
Journal of the American Chemical Society 2011 Dec 21;133(50):20500-6
Journal of the American Chemical Society 2011 Dec 21;133(50):20500-6
Development of immunoassays for human interleukin 3 and interleukin 4, some of which discriminate between different recombinant DNA-derived molecules.
Bird C, Wadhwa M, Thorpe R
Cytokine 1991 Nov;3(6):562-7
Cytokine 1991 Nov;3(6):562-7
No comments: Submit comment
Supportive validation
- Submitted by
- Invitrogen Antibodies (provider)
- Main image
- Experimental details
- NULL

- Submitted by
- Invitrogen Antibodies (provider)
- Main image
- Experimental details
- NULL
- Submitted by
- Invitrogen Antibodies (provider)
- Main image
- Experimental details
- Figure 6. piR30840 regulates the development of Th2 lymphocytes. ( A and B ) Human CD4 naive cells were cultured in a conditioned medium for Th2 development and then transfected with an s30840 (A) or piR30840 inhibitor (B). IL-4 expression was detected by qRT-PCR and western blotting analyses. P < 0.01. The data represents three independent experiments. ( C ) Detection of IL-4 expression in human PBMCs isolated from humanized NOG mice. IL-4 expression was detected by qRT-PCR analysis. The data was expressed as the mean of three independent experiments. Wilcoxon test was used to calculate the P -value. P < 0.05. ( D ) CD4 naive cells were cultured in the conditioned medium for Th2 development and transfected with s30840 or control. After 7 days, the Th2 T-lymphocytes (intracellular stained as IL-4 + IFN-gamma - ) were detected with FACS analysis. The data was shown as a mean of six independent experiments. P < 0.01. ( E ) The CD4 naive cells were cultured in a conditioned medium for Th2 development with or without the transfection of inhibitor. We adoptively transferred the naive cells into the irradiated NOG mice which were first humanized. After 7 days, Th2 T-lymphocytes (intracellularly stained as IL-4 + IFNgamma - ) were detected by using FACS analysis. The data were expressed as the mean of six independent experiments. Statistical significance between two samples was determined by using the student's t -test. P < 0.01.

- Submitted by
- Invitrogen Antibodies (provider)
- Main image

- Experimental details
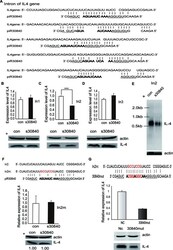
- Figure 2. piR30840 significantly decreases IL-4 expression. ( A and B ) s30840 decreases IL-4 expression in purified CD4 T lymphocytes from PBMCs. IL-4 expression was detected by qRT-PCR (left panel), northern blotting (right panel) (A) and western blotting (B). The data represents three independent experiments. Con represents the synthesized random sequence for control. s30840 represents the synthesized piR30840. P < 0.05. ( C ) s30840 decreases IL-4 expression in activated CD4 T lymphocytes. IL-4 expression was detected by qRT-PCR (upper panel) and western blotting (lower panel) analyses. The data represents three independent trials. P < 0.05. ( D ) Antisense inhibitor piR30840 antisense upregulates IL-4 in purified CD4 T lymphocytes from PBMCs. IL-4 expression was detected by qRT-PCR (left panel) and western blot (right panel) analyses. The data represents three independent trials. P < 0.05. ( E and F ) The construct containing all the IL-4 exons and introns (construct pIL4) was co-transfected with s30840 into 293T cells. IL-4 expression was detected by qRT-PCR (left panel) and western blotting (right panel) (E), as well as by northern blotting (F) analyses. The data represents three independent experiments. P < 0.01.

- Submitted by
- Invitrogen Antibodies (provider)
- Main image
- Experimental details
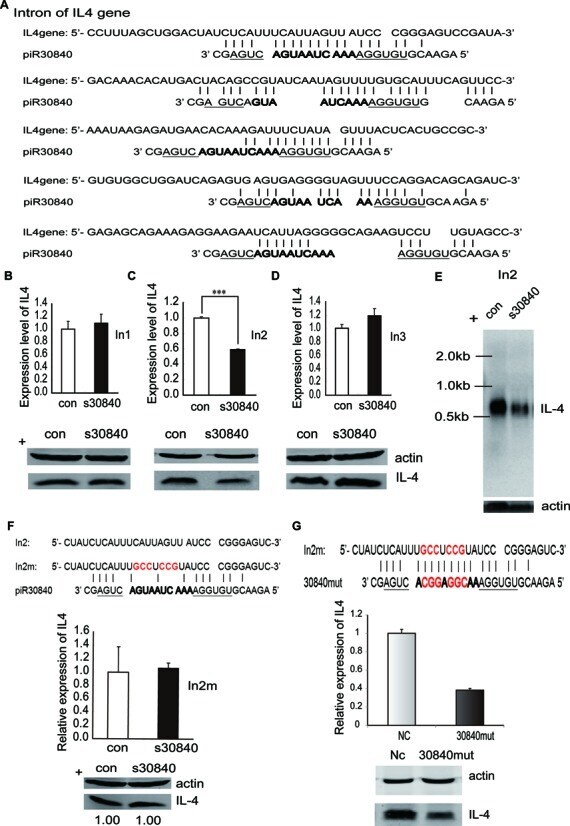
- Figure 3. piR30840 downregulates IL-4 pre-mRNA via binding to its intron region. ( A ) The putative binding sites of piR30840 in the introns of IL-4 pre-mRNA. ( B - D ) IL-4 constructs containing the first (In1) (B), second (In2) (C) or third intron (In3) (D) were co-transfected with s30840 into 293T cells respectively. IL-4 expression was then analyzed by qRT-PCR (upper panel) and western blotting (lower panel). Statistical significance between two samples was determined by using t -test. P < 0.01. ( E ) The construct In2 was co-transfected with s30840 or control. The RNA expression of IL-4 was analyzed by northern blotting. ( F ) The construct In2m was co-transfected with s30840. IL-4 expression was examined by qRT-PCR and western blotting analyses. ( G ) The construct In2m was co-transfected with the piR30840 mutation (30840mut). IL-4 expression was determined by qRT-PCR and western blotting analyses.
- Submitted by
- Invitrogen Antibodies (provider)
- Main image

- Experimental details
- Figure 5. TRAMP complex and exosome are involved in the decay of IL-4 pre-mRNA in the nucleus. ( A ) s30840 was co-transfected with siRNAs specific for trf4, air or mtr4 into CD4 T lymphocytes, respectively. The IL-4 expression was analyzed by western blotting. The data represents three independent experiments. ( B ) The interaction between Piwil4 and Mtr4 in 293T cells was detected by co-immunoprecipitation. Actin was used as loading control. ( C ) Piwil4 interacting with Prp4 was detected by co-immunoprecipitation in 293T cells. ( D ) s30840 was co-transfected with siRNA specific for rrp6, rrp44 and rrp42 into primary CD4 T-lymphocytes. The expression of IL-4 was detected by western blotting. The data represents three independent trials.

- Submitted by
- Invitrogen Antibodies (provider)
- Main image

- Experimental details
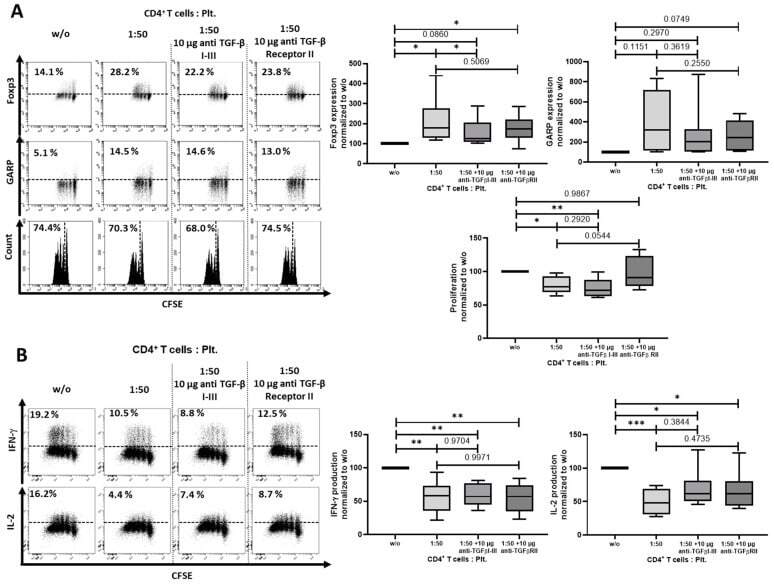
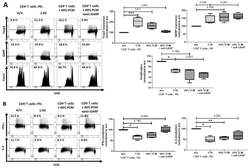
- Figure 5 Blockade of transforming growth factor (TGF)-beta I-III did in part prevent regulatory T cells (Treg) induction. ( A ) CFSE-labeled CD4 + CD25 - T cells were cocultured with platelets in the ratio of 1:50 and were stimulated with anti-CD3 mAb (0.5 ug/mL) and anti-CD28 mAb (1.0 ug/mL) in the presence of either anti-TGF-beta I-III (10 ug/mL) or anti-TGF-beta receptor II (10 ug/mL) antibodies. Antibodies were added at day 0. The expression of Foxp3 and GARP and cell proliferation were determined on day 3 via flow cytometry. ( B ) Production of IL-2 and IFN-gamma was assessed by intracellular flow cytometry on day 6. The graphs show cells cultured in the presence of platelets normalized to CD4 + CD25 - T cells without platelets. Dot plots show one representative result of 10 independent experiments ( n = 10, box and whiskers, medians +- min/max, * p < 0.05, ** p
- Submitted by
- Invitrogen Antibodies (provider)
- Main image

- Experimental details
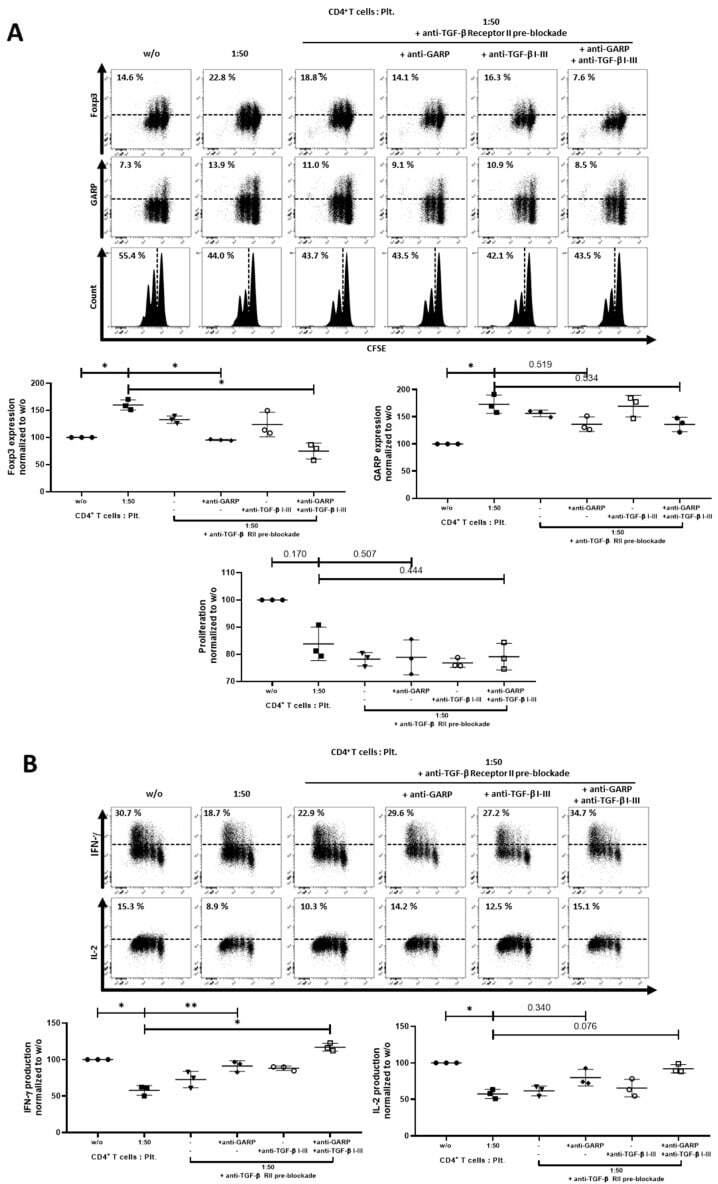
- Figure 6 Combining blockade of TGF-beta signaling and GARP led to a complete inhibition of platelet effects. ( A ) CFSE-labeled CD4 + CD25 - T cells were cocultured with platelets in the ratio of 1:50 and were stimulated with anti-CD3 mAb (0.5 ug/mL) and anti-CD28 mAb (1.0 ug/mL). CD4 + CD25 - T cells were incubated for 15 min with TGF-beta receptor II (10 ug/mL) antibody prior to coculture, as indicated. Excess antibody was removed. Pre-treated CD4 + CD25 - T cells were cultured in the presence of either anti-TGF-beta I-III (10 ug/mL) and/or anti-GARP Ab (10 ug/mL) antibodies. Antibodies were added at day 0. The expression of Foxp3, GARP and cell proliferation were determined on day 3 via flow cytometry. ( B ) Production of IL-2 and IFN-gamma was assessed by intracellular flow cytometry on day 6. The graphs show cells cultured in the presence of platelets normalized to CD4 + CD25 - T cells without platelets. Dot plots show 1 representative result of 10 independent experiments ( n = 3, means +- SD, * p < 0.05, ** p
- Submitted by
- Invitrogen Antibodies (provider)
- Main image
- Experimental details
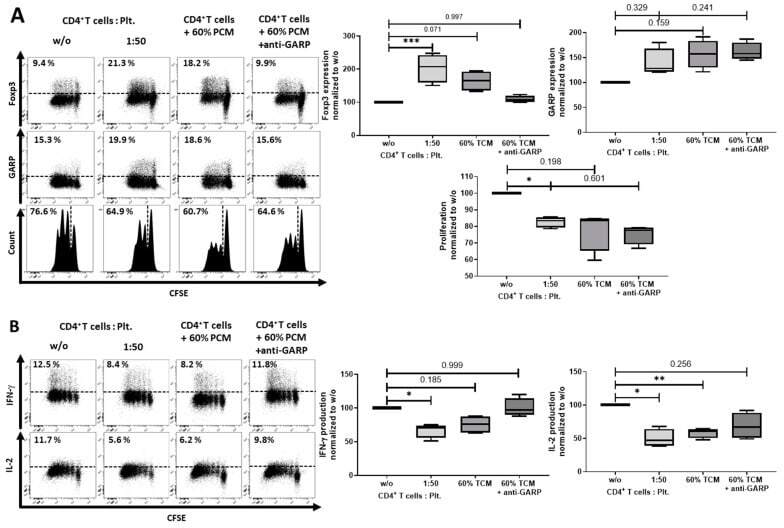
- Figure 7 Platelet-conditioned medium (PCM) inhibited IFN-gamma production, but failed to induce a Treg phenotype. ( A ) CD4 + CD25 - T cells were cultured in X-Vivo 15 (Lonza, Basel, Switzerland) with 60% PCM content, with or without 10 ug/mL anti-GARP Ab and stimulated with 0.5 ug/mL anti-CD3 mAb and 1.0 ug/mL anti-CD28 mAb. Antibodies were added at day 0. The expression of Foxp3, GARP and cell proliferation were determined at day 3 with flow cytometry. ( B ) Cytokine production of IL-2 and IFN-gamma was measured by intracellular flow cytometry on day 6. Dot plots show one representative result of five independent experiments ( n = 5, box and whiskers, medians +- min/max, * p < 0.05, ** p
- Submitted by
- Invitrogen Antibodies (provider)
- Main image

- Experimental details
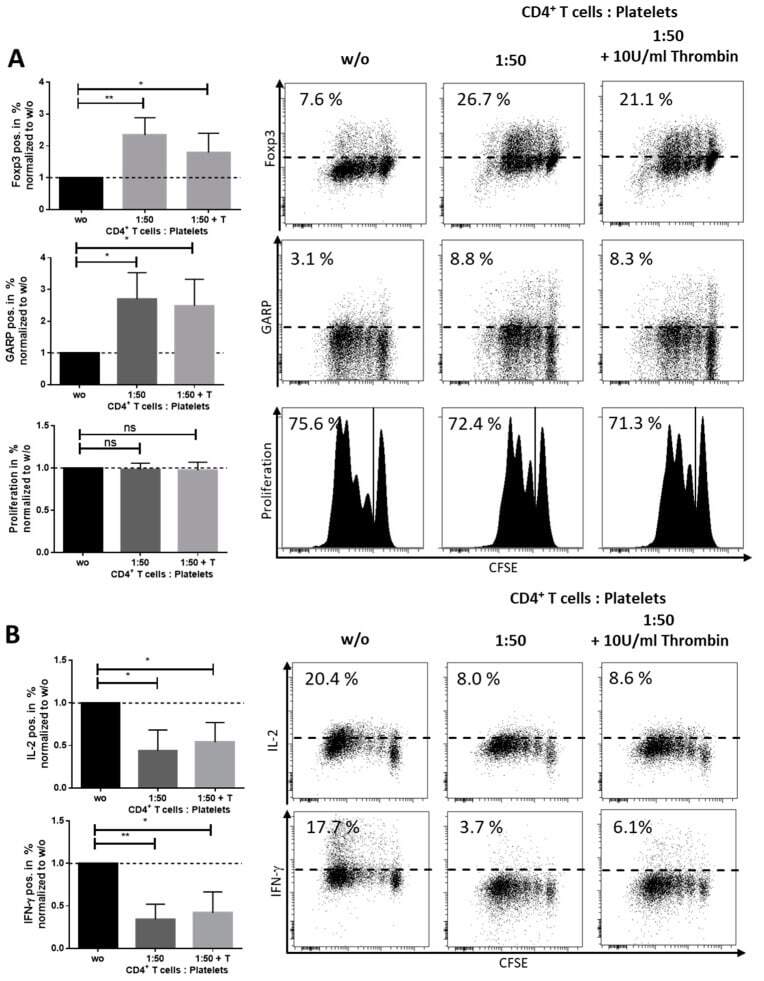
- Figure A4 Thrombin-activated platelets induced a regulatory phenotype in CD4 + CD25 - T cells. 1 x 10 6 CD4 + CD25 - T cells were stimulated with 0.5 ug/mL anti-CD3 mAb and 1.0 ug/mL anti-CD28 mAb with or without 50 x 10 6 platelets for 6 days and treated with or without 10 U/mL thrombin. ( A ) Foxp3 and GARP expression and proliferation were determined at day 3 via flow cytometry. ( B ) Using intracellular flow cytometry, we analyzed cytokine production of IL-2 and IFN-gamma on day 6. Dot plots show one representative result of five independent experiments ( n = 5, box and whiskers, medians +- min/max, * p < 0.05, ** p
- Submitted by
- Invitrogen Antibodies (provider)
- Main image

- Experimental details
- Figure A5 TRAP-6-activated platelets induced a regulatory phenotype in CD4 + CD25 - T cells. 1 x 10 6 CD4 + CD25 - T cells were stimulated with 0.5 ug/mL anti-CD3 mAb and 1.0 ug/mL anti-CD28 mAb with or without 50 x 10 6 platelets for 6 days and treated with or without 5 uM TRAP-6. ( A ) Foxp3 and GARP expression and proliferation were determined at day 3 via flow cytometry. ( B ) Using intracellular flow cytometry, we analyzed cytokine production of IL-2 and IFN-gamma on day 6. Dot plots show one representative result of five independent experiments ( n = 5, box and whiskers, medians +- min/max, * p < 0.05, ** p

- Submitted by
- Invitrogen Antibodies (provider)
- Main image
- Experimental details
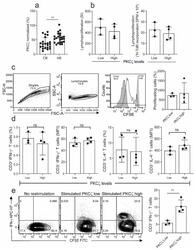
- Figure 1 Comparison of proliferation and cytokine production in naive cord blood T cells (CBTC) in Protein Kinase C zeta (PKCzeta) low or high group. ( a ) Comparison of PKCzeta between cord blood (CB) and adult blood (AB) T cells, n = 24 for each AB or CB. ( b ) Shows lymphoproliferation as a Stimulation index (SI) and disintegrations per minute (DPM) in 3 H-thymidine pulsed cultures stimulated with Phytohaemagglutinin (PHA) and Phorbol myristate acetate (PMA) ( c ) Purified CBCTs were stained with Carboxyfluorescein succinimidyl ester (CFSE) dye and stimulated with immobilized anti-CD3/-CD28 antibodies for 3 days. Gating and representative histogram for CFSE dilution after exclusion of doublets and dead cells. Overlaid histograms for stained unstimulated and unstained stimulated samples were used as control and for gating the non-proliferating cells and for auto-fluorescence, respectively. ( d ) Naive CB CD3 + T cells were stimulated with PHA/PMA (18 h) and percentage of CD3 + T cells producing interleukin-4 (IL-4) and Interferon-gamma (IFN-gamma) and median fluorescent intensity (MFI) were examined by flow cytometry assays. ( e ) On day 5 of CFSE stained culture (anti-CD3/-CD28), cells were re-stimulated with PHA/PMA (18 h) for detection of intracellular cytokine. Representative flow dot plots and data for CFSE dye dilution and IFN-gamma producing cells in high and low PKCzeta group. Data mean +- SD of n = 3 for of low and n = 4 high PKCzeta group. ** p < 0.01. ns: not sig

- Submitted by
- Invitrogen Antibodies (provider)
- Main image
- Experimental details
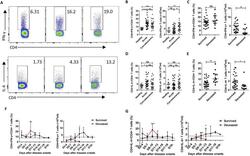
- Fig. 3 Changes in the percentages and absolute numbers of Th1 and Th2 cells in SFTS patients. (A): Th1 cells (CD4 + IFN-gamma+) and Th2 cells (CD4 + IL-4+) by flow cytometry in the healthy controls, surviving SFTS patients, and deceased SFTS patients, as defined by flow cytometry. The cells were gated on the CD3 + CD4+ population within the single-cell lymphocyte gate. (B), (D): The percentages and numbers of Th1 and Th2 cells in the healthy controls (n = 11) and the surviving patients with SFTS in the acute phase (n = 30) and SFTS in the recovery phase (n = 30). (C), (E): The percentages and numbers of Th1 and Th2 cells at admission in the surviving patients (n = 30) and the deceased patients (n = 12). (F), (G): Dynamic changes in the percentages and numbers of Th1 and Th2 cells in the surviving patients (n = 30) and the deceased patients (n = 12). These parameters were monitored at indicated time points for the entire hospital stay of the patients, and the dashed line represents the median of the uninfected controls. The data are shown as the median +- 95% CI. Statistical analysis was performed using the Mann-Whitney U test or the Wilcoxon matched pair test. The level of significance is indicated as follows: ns, not significant; *p < .05; **p < .01; ***p < .001; ****p < .0001; Fig. 3
