Explore
 Validate
 Learn
Learn Western blot
 Immunohistochemistry
Antibody data
- Antibody Data
- Antigen structure
- References [8]
- Comments [0]
- Validations
- Immunohistochemistry [1]
- Flow cytometry [2]
- Other assay [9]
Submit
Validation data
Reference
Comment
Report error
- Product number
- PA5-25165 - Provider product page

- Provider
- Invitrogen Antibodies
- Product name
- IL-4 Polyclonal Antibody
- Antibody type
- Polyclonal
- Antigen
- Synthetic peptide
- Description
- This antibody is predicted to react with non-human primate based on sequence homology.
- Reactivity
- Human, Mouse
- Host
- Rabbit
- Isotype
- IgG
- Vial size
- 400 μL
- Concentration
- 1.3 mg/mL
- Storage
- Store at 4°C short term. For long term storage, store at -20°C, avoiding freeze/thaw cycles.
Submitted references Therapeutic Benefit of Galectin-1: Beyond Membrane Repair, a Multifaceted Approach to LGMD2B.
Brain-derived CCR5 Contributes to Neuroprotection and Brain Repair after Experimental Stroke.
Mast Cells in Alveolar Septa of COVID-19 Patients: A Pathogenic Pathway That May Link Interstitial Edema to Immunothrombosis.
IL-4/IL-13 remodeling pathway of COVID-19 lung injury.
Renal expression of cytokines and chemokines in diabetic nephropathy.
Reparative Effects of Stem Cell Factor and Granulocyte Colony-Stimulating Factor in Aged APP/PS1 Mice.
STAT6 deficiency ameliorates Graves' disease severity by suppressing thyroid epithelial cell hyperplasia.
Sequential delivery of immunomodulatory cytokines to facilitate the M1-to-M2 transition of macrophages and enhance vascularization of bone scaffolds.
Vallecillo-Zúniga ML, Poulson PD, Luddington JS, Arnold CJ, Rathgeber M, Kartchner BC, Hayes S, Gill H, Valdoz JC, Spallino JL, Garfield S, Dodson EL, Arthur CM, Stowell SR, Van Ry PM
Cells 2021 Nov 17;10(11)
Cells 2021 Nov 17;10(11)
Brain-derived CCR5 Contributes to Neuroprotection and Brain Repair after Experimental Stroke.
Ping S, Qiu X, Kyle M, Zhao LR
Aging and disease 2021 Feb;12(1):72-92
Aging and disease 2021 Feb;12(1):72-92
Mast Cells in Alveolar Septa of COVID-19 Patients: A Pathogenic Pathway That May Link Interstitial Edema to Immunothrombosis.
Motta Junior JDS, Miggiolaro AFRDS, Nagashima S, de Paula CBV, Baena CP, Scharfstein J, de Noronha L
Frontiers in immunology 2020;11:574862
Frontiers in immunology 2020;11:574862
IL-4/IL-13 remodeling pathway of COVID-19 lung injury.
Vaz de Paula CB, de Azevedo MLV, Nagashima S, Martins APC, Malaquias MAS, Miggiolaro AFRDS, da Silva Motta Júnior J, Avelino G, do Carmo LAP, Carstens LB, de Noronha L
Scientific reports 2020 Oct 29;10(1):18689
Scientific reports 2020 Oct 29;10(1):18689
Renal expression of cytokines and chemokines in diabetic nephropathy.
Araújo LS, Torquato BGS, da Silva CA, Dos Reis Monteiro MLG, Dos Santos Martins ALM, da Silva MV, Dos Reis MA, Machado JR
BMC nephrology 2020 Jul 28;21(1):308
BMC nephrology 2020 Jul 28;21(1):308
Reparative Effects of Stem Cell Factor and Granulocyte Colony-Stimulating Factor in Aged APP/PS1 Mice.
Guo X, Liu Y, Morgan D, Zhao LR
Aging and disease 2020 Dec;11(6):1423-1443
Aging and disease 2020 Dec;11(6):1423-1443
STAT6 deficiency ameliorates Graves' disease severity by suppressing thyroid epithelial cell hyperplasia.
Jiang X, Zha B, Liu X, Liu R, Liu J, Huang E, Qian T, Liu J, Wang Z, Zhang D, Wang L, Chu Y
Cell death & disease 2016 Dec 1;7(12):e2506
Cell death & disease 2016 Dec 1;7(12):e2506
Sequential delivery of immunomodulatory cytokines to facilitate the M1-to-M2 transition of macrophages and enhance vascularization of bone scaffolds.
Spiller KL, Nassiri S, Witherel CE, Anfang RR, Ng J, Nakazawa KR, Yu T, Vunjak-Novakovic G
Biomaterials 2015 Jan;37:194-207
Biomaterials 2015 Jan;37:194-207
No comments: Submit comment
Supportive validation
- Submitted by
- Invitrogen Antibodies (provider)
- Main image
- Experimental details
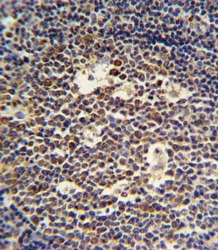
- Immunohistochemistry analysis of IL-4 in formalin fixed and paraffin embedded tonsil. Samples were incubated with IL-4 polyclonal antibody (Product # PA5-25165) followed by peroxidase conjugation of the secondary antibody and DAB staining. This data demonstrates the use of this antibody for immunohistochemistry. Clinical relevance has not been evaluated.

Supportive validation
- Submitted by
- Invitrogen Antibodies (provider)
- Main image
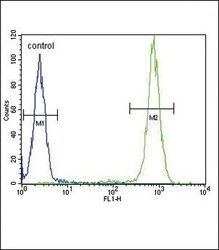
- Experimental details
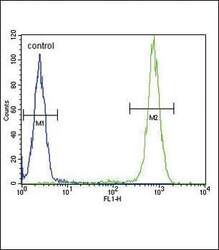
- Flow cytometry analysis of WiDr cells using an IL4 polyclonal antibody (Product # PA5-25165) (right) compared to a negative control cell (left) at a dilution of 1:10-50, followed by a FITC-conjugated goat anti-rabbit antibody
- Submitted by
- Invitrogen Antibodies (provider)
- Main image
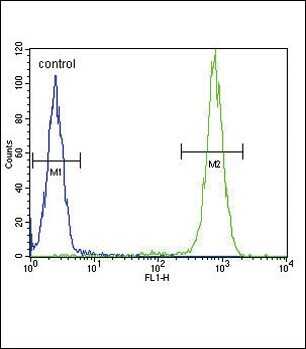
- Experimental details
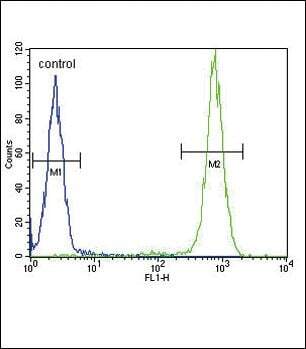
- Flow cytometry of IL-4 in WiDr cells (right histogram). Samples were incubated with IL-4 polyclonal antibody (Product # PA5-25165) followed by FITC-conjugated goat-anti-rabbit secondary antibody. Negative control cell (left histogram).
Supportive validation
- Submitted by
- Invitrogen Antibodies (provider)
- Main image
- Experimental details
- NULL
- Submitted by
- Invitrogen Antibodies (provider)
- Main image
- Experimental details
- NULL
- Submitted by
- Invitrogen Antibodies (provider)
- Main image

- Experimental details
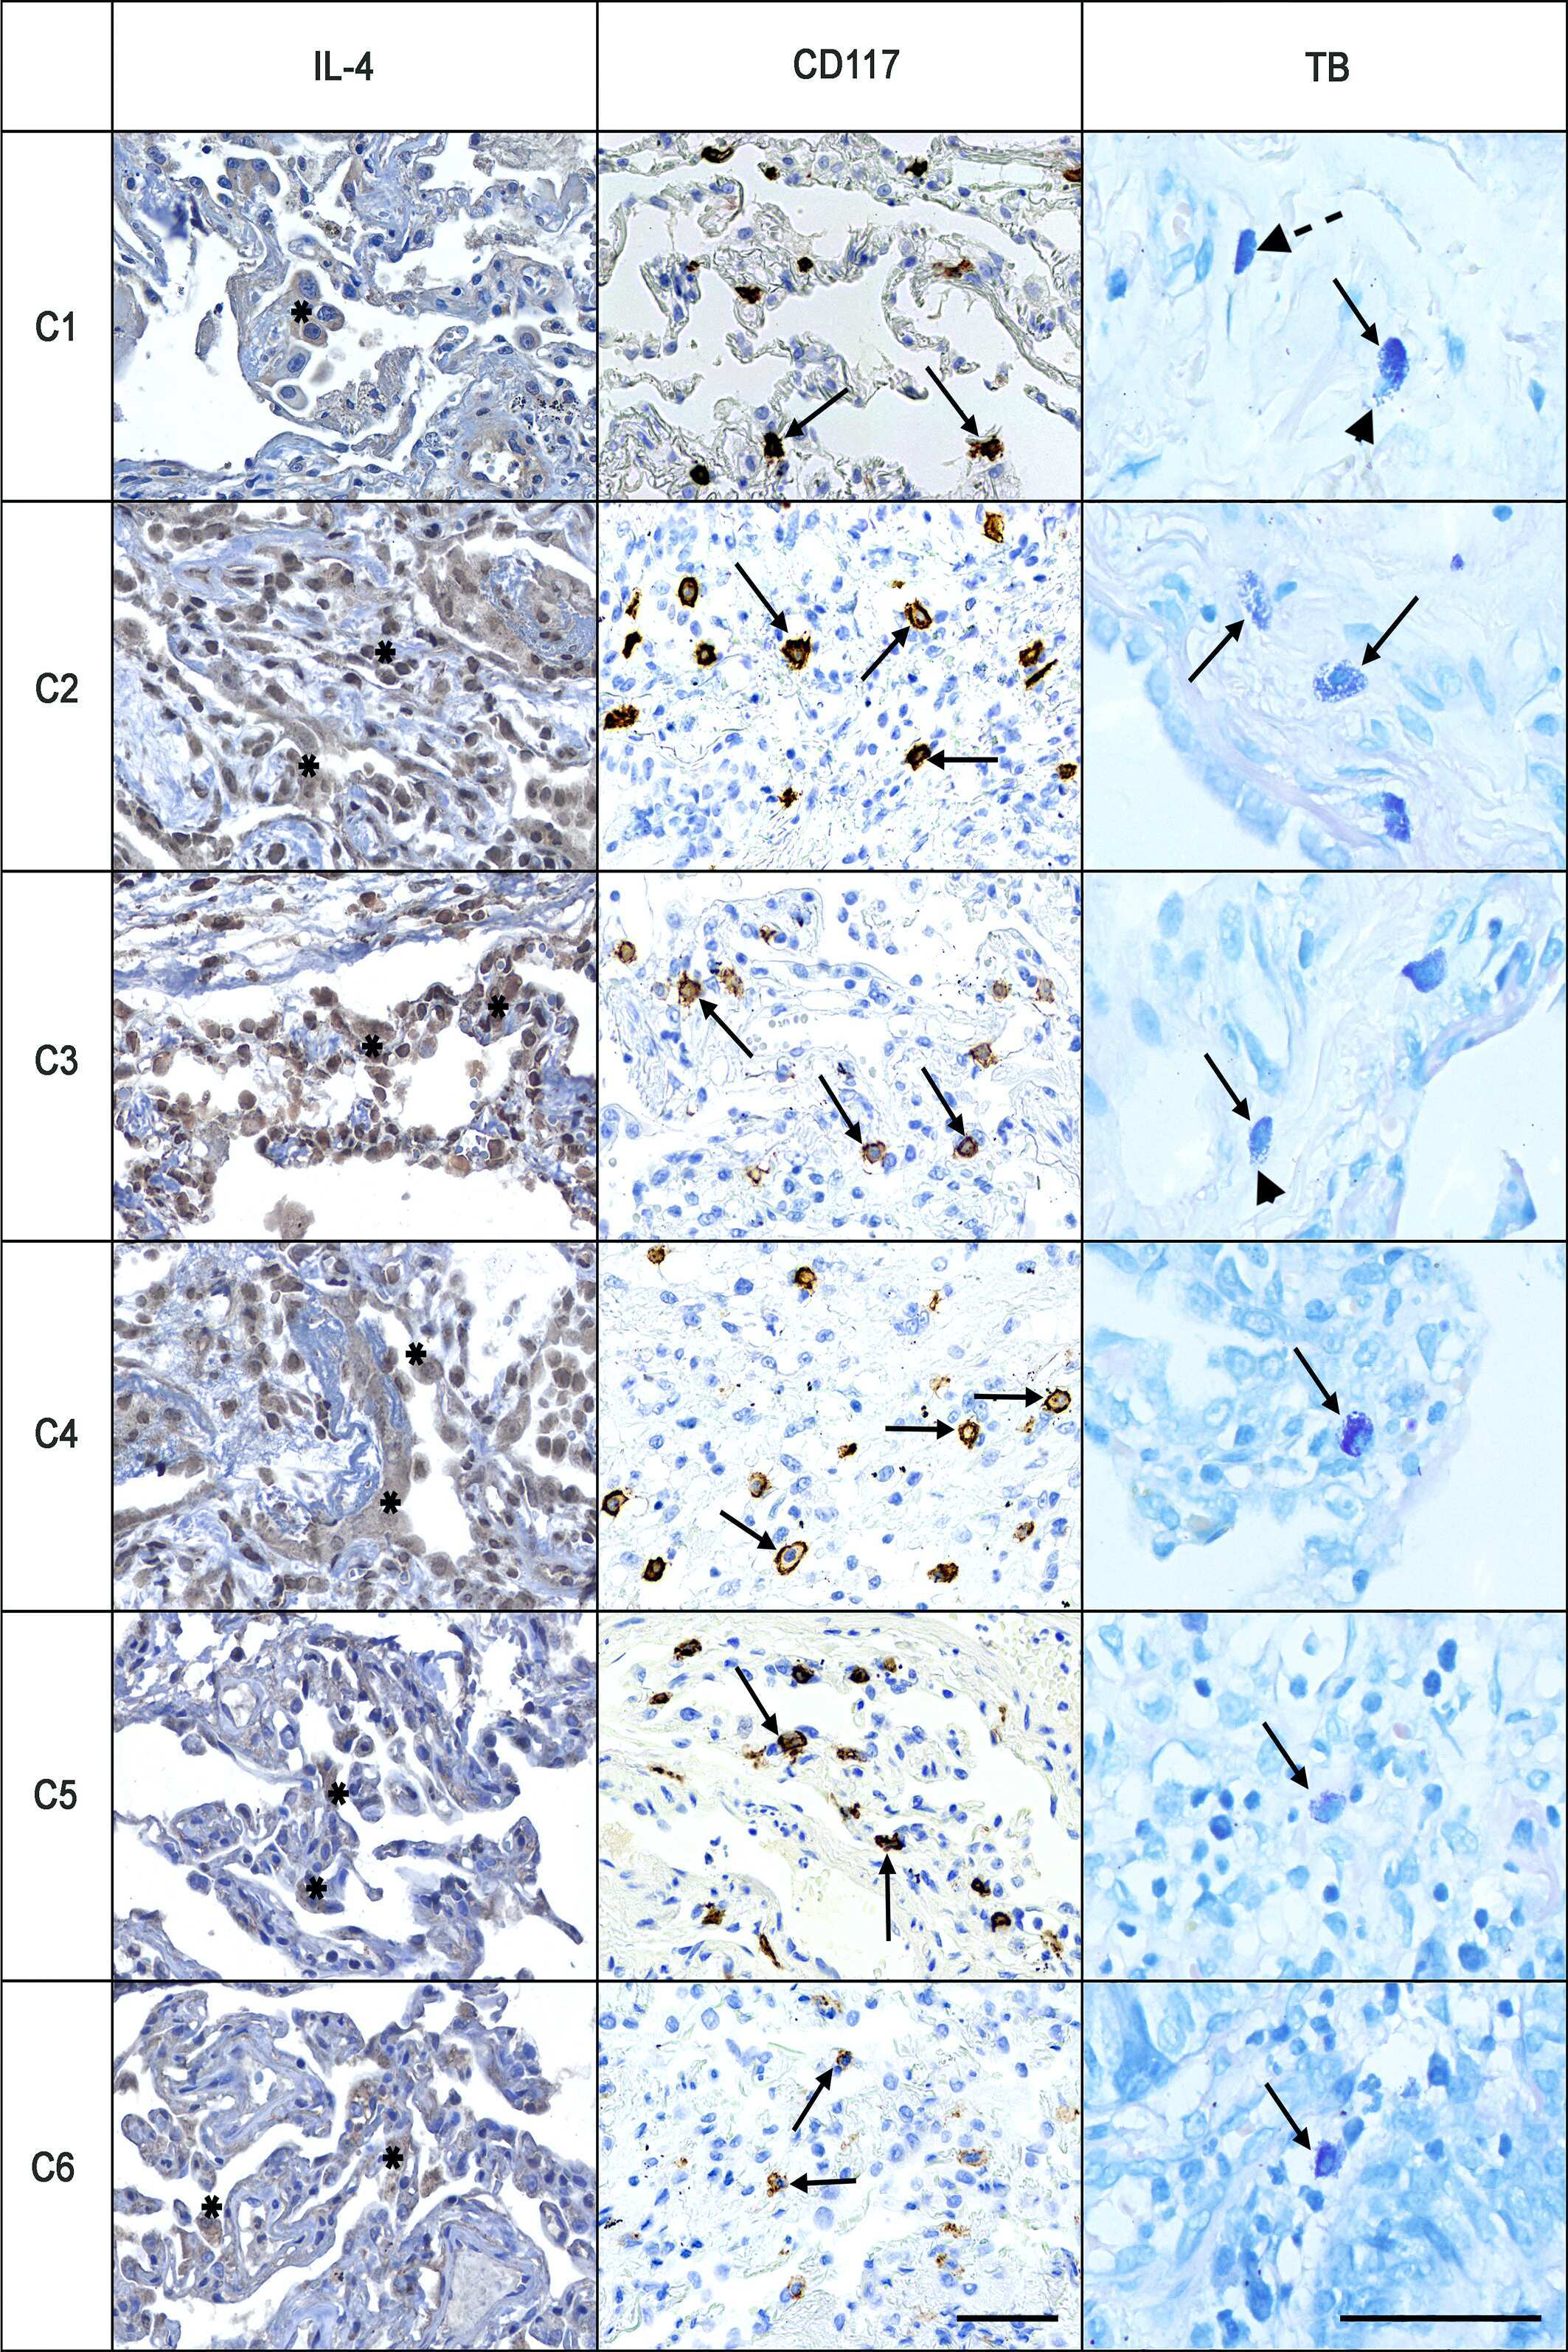
- Figure 4 The expression of IL-4 and IL-4 receptors in the thyroid of control and EAGD mice. Thyroid glands were obtained from control and EAGD mice 4 weeks after three injections. Quantitative real-time PCR analysis of IL-4 ( a ), IL-4 R alpha ( b ) and IL-13R alpha 1 ( c ) in fresh thyroid glands. ( d ) IL-4 protein was measured in 10 control mice and 10 EAGD mice by IHC straining. Representative IL-4 staining in control mice and EAGD mice. The arrow points to IL-4-positive thyroid follicular epithelial cells. Magnification: x 100; x 400 (left panel). IHC was blindly scored by counting positive cells in 10 HPFs, and individual thyroid gland scores are shown (right panel). ( e ) IL-4 R protein was measured in 10 control mice and 10 EAGD mice by IHC straining. Representative IL-4 R staining in control mice and EAGD mice. The arrow points to IL-4 R-positive thyroid follicular epithelial cells. Magnification: x 100; x 400 (left panel). IHC was blindly scored by counting positive cells in 10 HPFs, and individual thyroid gland scores are shown, with each point representing one mouse (right panel). Three repetitions showed similar results. Scale bars (x 100): 200 mum; scale bars (x 400): 50 mum. ( f ) Gating strategy for the identification of IL-4 + and IL-4 R + TECs (left panel), and percentages of IL-4 + and IL-4 R + TECs are shown (right panel). * P
- Submitted by
- Invitrogen Antibodies (provider)
- Main image
- Experimental details
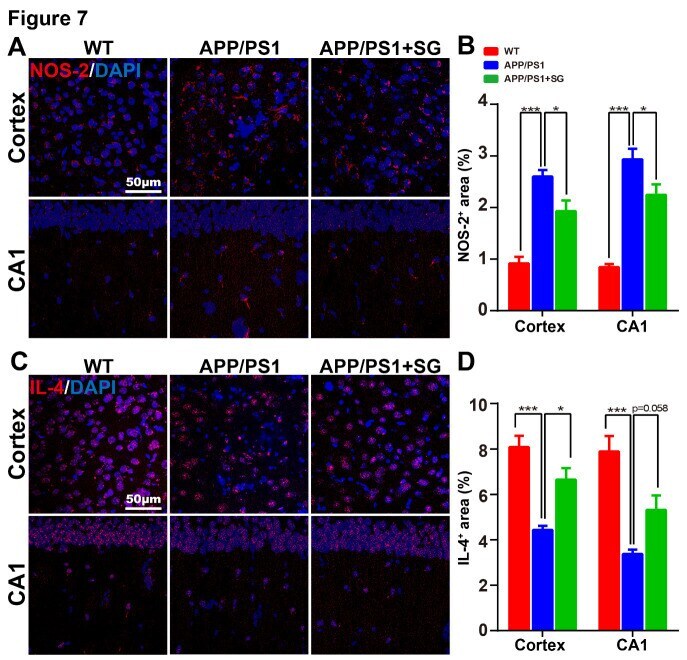
- Figure 7. SCF+G-CSF treatment decreases NOS-2 expression and increases IL-4 expression in the brains of aged APP/PS1 mice. (A) Representative confocal images illustrate the NOS-2 immunopositive staining (red) in the cortex and hippocampal CA1 of aged APP/PS1 mice treated with or without SCF+G-CSF and age-matched wild type (WT) mice. (B) Quantification data show the percentage of NOS-2 + area in the cortex and CA1 region of aged APP/PS1mice (with or without SCF+G-CSF treatment) and age-matched WT mice. (C) Representative confocal images illustrate the IL-4 immunopositive staining (red) in the cortex and CA1 region of aged APP/PS1 mice treated with or without SCF+G-CSF and age-matched WT mice. (D) Quantification data show the percentage of IL-4 + area in the cortex and CA1 of aged APP/PS1 mice treated with or without SCF+G-CSF and age-matched WT control mice. Blue: Nuclear counterstaining by DAPI. N=4-5. Mean +- SEM. *p
- Submitted by
- Invitrogen Antibodies (provider)
- Main image
- Experimental details
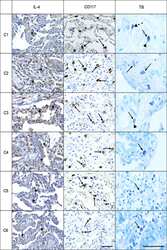
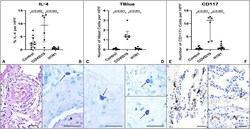
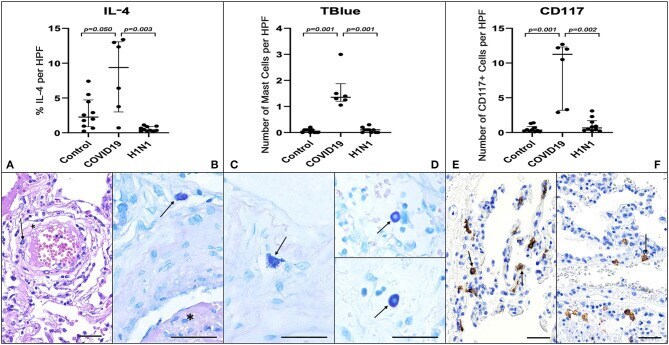
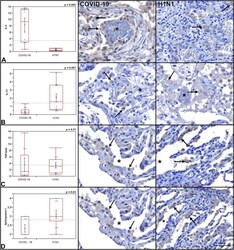
- Figure 1 Graphs demonstrate the IL-4 tissue expression (percentage per HPF), the number of MCs (TB), and the number of CD117 + cells (IHQ) in the alveolar septa of the COVID-19 group compared to the H1N1 and Control groups. Non-parametric Kruskal Wallis test. Values of p < 0.05 indicated statistical significance. Histological section (H&E- A ) shows evidence of microvascular involvement through endothelial activation (black arrow) and increased vascular permeability manifested by the formation of perivascular edema (asterisk). (B) (TB) shows thrombosis (asterisk) and perivascular MC (black arrow). (C,D) (TB) show evidence of degranulating ( C -black arrow) and intact MCs ( D -black arrows) and in the alveolar septa and perivascular spaces, in patients of COVID-19 (C) , H1N1 ( D -upper) and Control ( D -under) groups. (E) Of the COVID-19 group sample shows the massive presence of CD117 + nucleated cells (black arrows) compared to photomicrograph (F) of the H1N1 group sample (black arrow). Scale bar -50 mum. Scanned by the Axio Scan Scanner. Z1 (Carl Zeiss, Germany) with 40x (A-D) and 20x (E,F) objectives.
- Submitted by
- Invitrogen Antibodies (provider)
- Main image
- Experimental details
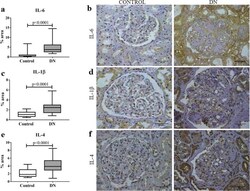
- Fig. 1 In situ expression of IL-6, IL-1beta, and IL-4 in glomerular and tubulointerstitial compartments in patients with diabetic nephropathy (DN) and control group. a IL-6 expression in control and DN groups. b IL-6 immunostaining in control and DN groups. c IL-1beta expression in control and DN groups. d IL-1beta immunostaining in control and DN groups. e IL-4 expression in control group and DN groups. f IL-4 immunostaining in control and DN groups. Results are expressed as median (min-max). Horizontal lines represent the medians, the bars represent the 25-75% percentiles and the vertical lines represent the percentiles 10-90%

- Submitted by
- Invitrogen Antibodies (provider)
- Main image
- Experimental details
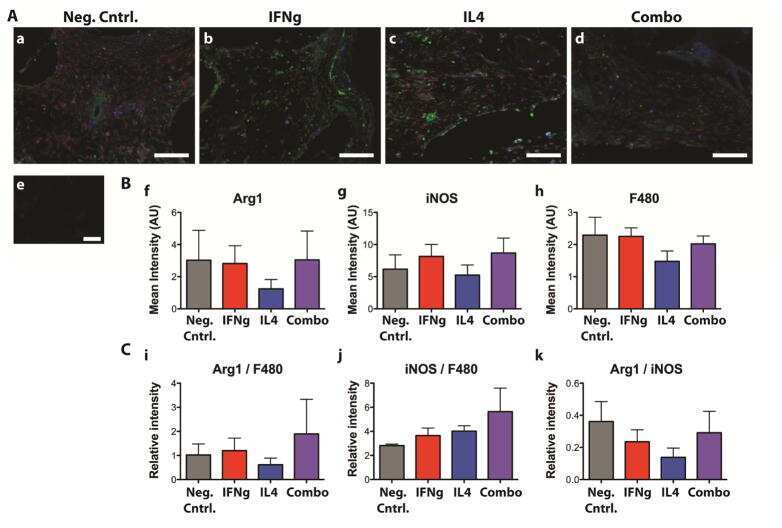
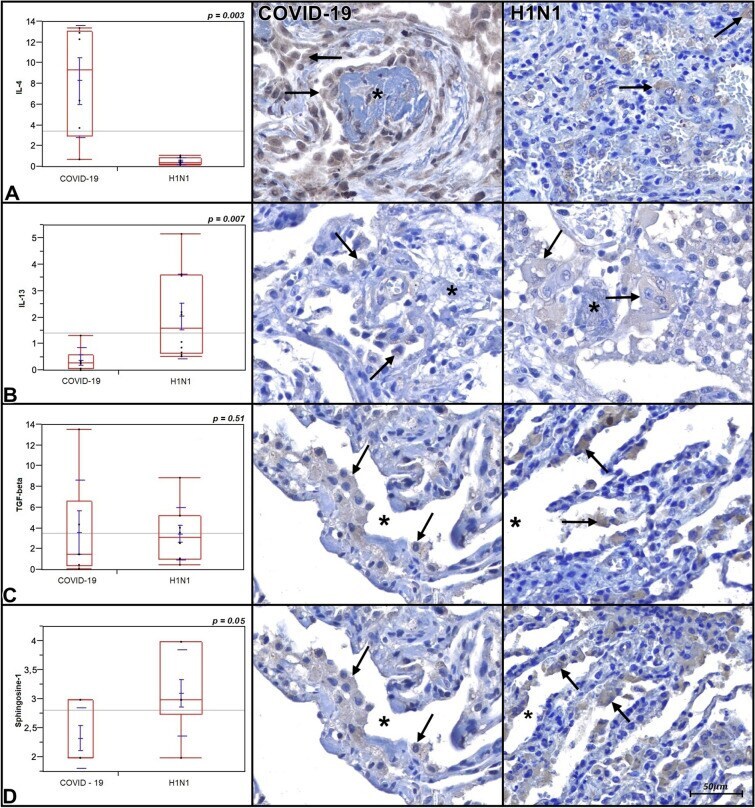
- Figure 1 Graphics are showing tissue expression of IL-4, IL-13, TGF-beta (percentage per HPF) and M2 macrophages Allred score of COVID-19 and H1N1 groups. Photomicrography is showing alveolar macrophages (arrows) expressing IL-4, IL-13, TGF-beta, and Sphingosine-1 (M2 macrophages phenotype) in both groups. Asterisks are showing rests of hyaline membrane forming fibrin plugs (IL-4 and IL-13) and alveolar lumens (TGF-beta and Sphingosine-1).
- Submitted by
- Invitrogen Antibodies (provider)
- Main image
- Experimental details
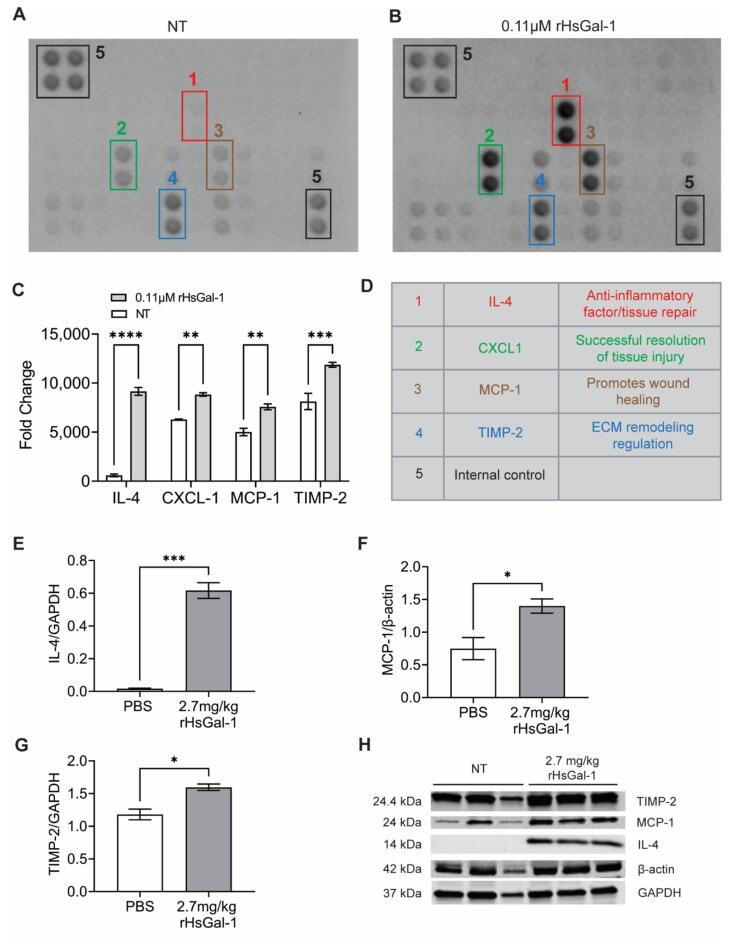
- Figure 5 rHsGal-1 treatment upregulates anti-inflammatory cytokines. ( A ) Cytokine array expression from NT A/J -/- myotubes cultured in differentiation media for 48 h. ( B ) Cytokine array expression from A/J -/- myotubes after 48 h in differentiation media supplemented with 0.11 muM rHsGal-1. ( C ) Mean pixel density of relative cytokine expression from A and B. ( D ) Schematic reference of the significantly upregulated cytokines after 48 h treatment with 0.11 muM rHsGal-1. ( E ) Quantification of Western blot probing for IL-4. ( F ) Quantification of Western blot of MCP-1 levels normalized to beta-actin in cells treated with PBS (control) or 2.7 mg/kg rHsGal-1. ( G ) Quantification of Western blot of TIMP-2 normalized to GAPDH levels in cells treated with PBS (control) or 2.7 mg/kg rHsGal-1. Tissues taken from mice treated for 1 month. ( H ) Images of Western blot for TIMP-2, MCP-1, beta-actin, and GAPDH on tissues from Bla/J mice treated with PBS (control) or 2.7 mg/kg rHsGal-1 for one month. n = 4 for each group. * p < 0.05, ** p < 0.01, *** p < 0.001, **** p < 0.0001 NT vs. rHsGal-1. Bars are represented as SEM.
- Submitted by
- Invitrogen Antibodies (provider)
- Main image
- Experimental details
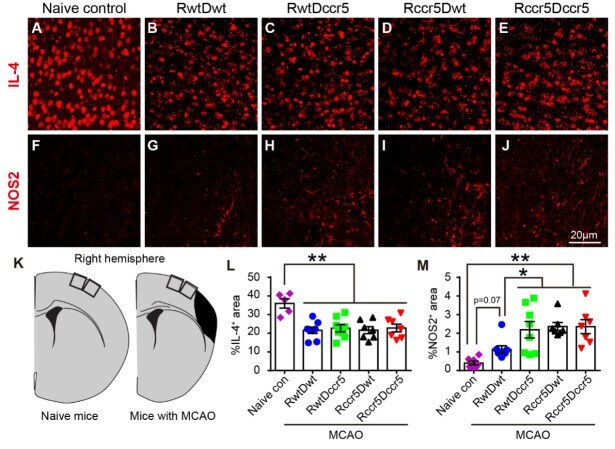
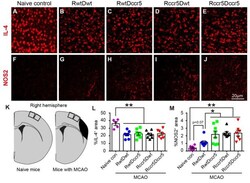
- Figure 6. Neuroinflammatory molecule expression in the peri-infarct cortex 2 months after cerebral cortical ischemia. Note that stroke mice show reduced IL-4 expression and increased NOS2 expression in the peri-infarct cortex as compared to the naive control mice. Stroke mice lacking CCR5 in both the brain and bone marrow show increased NOS2 expression in the peri-infarct cortex (RwtDccr5, Rccr5Dwt, and Rccr5Dccr5 vs. RwtDwt). (A-E) Representative images of immunofluorescence staining for IL-4 in the peri-infarct cortex. (F to J) Representative images of immunofluorescence staining for NOS2 in the peri-infarct cortex. (K) Schematic diagrams indicate the imaging areas in the cortex. (L and M) Quantification data of IL-4 and NOS2 positive area in the peri-infarct cortex. Mean+- S.E.M. N=7-8/group. *p