 Explore
 Validate
 Learn
Learn Western blot
 Immunocytochemistry
Antibody data
- Antibody Data
- Antigen structure
- References [5]
- Comments [0]
- Validations
- Immunocytochemistry [3]
- Immunoprecipitation [1]
- Immunohistochemistry [1]
- Other assay [7]
Submit
Validation data
Reference
Comment
Report error
- Product number
- MA1-157 - Provider product page

- Provider
- Invitrogen Antibodies
- Product name
- PKC alpha Monoclonal Antibody (MC5)
- Antibody type
- Monoclonal
- Antigen
- Purifed from natural sources
- Description
- Western blot analysis of MA1-157 detects an ~80 kDa protein in human, bovine, non-human primate, mouse, rat, dog and rabbit cells. In Jurkat, rat brain and MDCK cell lysates, a weak unknown band at ~140 kDa is also detected. MA1-157 shows specificity to PKC alpha and is non-reactive to other PKC family members.
- Reactivity
- Human, Mouse, Rat, Bovine, Canine, Rabbit
- Host
- Mouse
- Isotype
- IgG
- Antibody clone number
- MC5
- Vial size
- 100 µg
- Concentration
- 1 mg/mL
- Storage
- -20°C
Submitted references Large-Area Photoreceptor Degeneration Model in Rabbits by Photocoagulation and Oxidative Stress in the Retina.
Prion-induced photoreceptor degeneration begins with misfolded prion protein accumulation in cones at two distinct sites: cilia and ribbon synapses.
A dual role for Ca(v)1.4 Ca(2+) channels in the molecular and structural organization of the rod photoreceptor synapse.
Tmem30a deficiency leads to retinal rod bipolar cell degeneration.
Localization of Rod Bipolar Cells in the Mammalian Retina Using an Antibody Against the α1c L-type Ca(2+) Channel.
Wang Z, Feng C, Yang R, Liu T, Chen Y, Chen A, Yan B, Yuan Y, Zhang J
Frontiers in neuroscience 2021;15:617175
Frontiers in neuroscience 2021;15:617175
Prion-induced photoreceptor degeneration begins with misfolded prion protein accumulation in cones at two distinct sites: cilia and ribbon synapses.
Striebel JF, Race B, Leung JM, Schwartz C, Chesebro B
Acta neuropathologica communications 2021 Jan 29;9(1):17
Acta neuropathologica communications 2021 Jan 29;9(1):17
A dual role for Ca(v)1.4 Ca(2+) channels in the molecular and structural organization of the rod photoreceptor synapse.
Maddox JW, Randall KL, Yadav RP, Williams B, Hagen J, Derr PJ, Kerov V, Della Santina L, Baker SA, Artemyev N, Hoon M, Lee A
eLife 2020 Sep 17;9
eLife 2020 Sep 17;9
Tmem30a deficiency leads to retinal rod bipolar cell degeneration.
Yang Y, Liu W, Sun K, Jiang L, Zhu X
Journal of neurochemistry 2019 Feb;148(3):400-412
Journal of neurochemistry 2019 Feb;148(3):400-412
Localization of Rod Bipolar Cells in the Mammalian Retina Using an Antibody Against the α1c L-type Ca(2+) Channel.
Huh YJ, Choi JS, Jeon CJ
Acta histochemica et cytochemica 2015 Apr 28;48(2):47-52
Acta histochemica et cytochemica 2015 Apr 28;48(2):47-52
No comments: Submit comment
Supportive validation
- Submitted by
- Invitrogen Antibodies (provider)
- Main image
- Experimental details
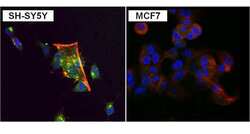
- Immunofluorescent analysis of PKC alpha (green) in SH-SY5Y and MCF7 cells. Formalin fixed cells were permeabilized with 0.1% Triton X-100 in TBS for 10 minutes at room temperature. Cells were blocked with 1% Blocker BSA (Product # 37525) for 15 minutes at room temperature. Cells were probed with a PKC alpha monoclonal antibody (Product # MA1-157) at a dilution of 1:100 for at least 1 hour at room temperature, washed with PBS, and incubated with a DyLight 488-conjugated goat anti-mouse IgG secondary antibody (Product # 35502). F-Actin (red) was stained with DyLight-554 Phalloidin (Product # 21834) and nuclei (blue) were stained with Hoechst 33342 dye (Product # 62249). Images were taken on a Thermo Scientific ToxInsight Instrument at 20X magnification.
- Submitted by
- Invitrogen Antibodies (provider)
- Main image
- Experimental details
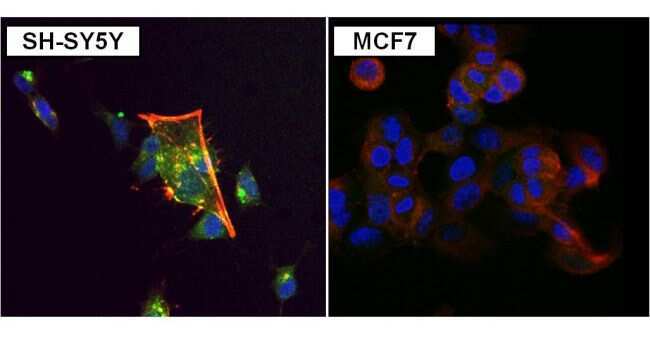
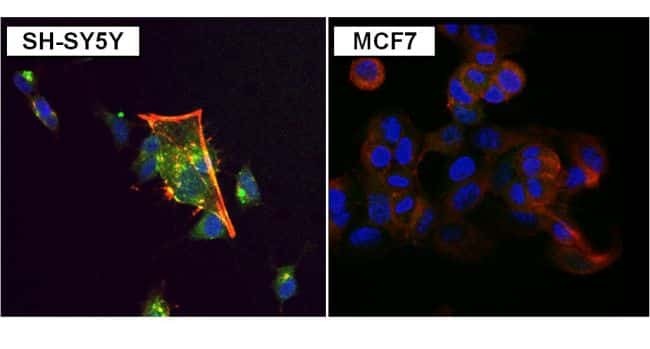
- Immunofluorescent analysis of PKC alpha (green) in SH-SY5Y and MCF7 cells. Formalin fixed cells were permeabilized with 0.1% Triton X-100 in TBS for 10 minutes at room temperature. Cells were blocked with 1% Blocker BSA (Product # 37525) for 15 minutes at room temperature. Cells were probed with a PKC alpha monoclonal antibody (Product # MA1-157) at a dilution of 1:100 for at least 1 hour at room temperature, washed with PBS, and incubated with a DyLight 488-conjugated goat anti-mouse IgG secondary antibody (Product # 35502). F-Actin (red) was stained with DyLight-554 Phalloidin (Product # 21834) and nuclei (blue) were stained with Hoechst 33342 dye (Product # 62249). Images were taken on a Thermo Scientific ToxInsight Instrument at 20X magnification.
- Submitted by
- Invitrogen Antibodies (provider)
- Main image

- Experimental details
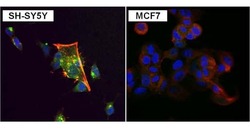
- Immunofluorescent analysis of PKC alpha (green) in SH-SY5Y and MCF7 cells. Formalin fixed cells were permeabilized with 0.1% Triton X-100 in TBS for 10 minutes at room temperature. Cells were blocked with 1% Blocker BSA (Product # 37525) for 15 minutes at room temperature. Cells were probed with a PKC alpha monoclonal antibody (Product # MA1-157) at a dilution of 1:100 for at least 1 hour at room temperature, washed with PBS, and incubated with a DyLight 488-conjugated goat anti-mouse IgG secondary antibody (Product # 35502). F-Actin (red) was stained with DyLight-554 Phalloidin (Product # 21834) and nuclei (blue) were stained with Hoechst 33342 dye (Product # 62249). Images were taken on a Thermo Scientific ToxInsight Instrument at 20X magnification.

Supportive validation
- Submitted by
- Invitrogen Antibodies (provider)
- Main image

- Experimental details
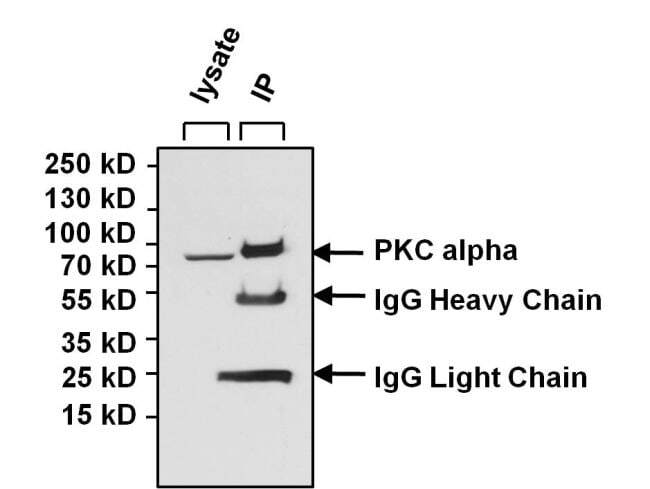
- Immunoprecipitation of PKC alpha was performed using Jurkat whole cell lysate. Antigen-antibody complexes were formed by incubating 400 µg of lysate with 5 µg of a PKC alpha monoclonal antibody (Product # MA1-157) overnight on a rocking platform at 4°C. The immune complexes were captured on 50 µL Protein A/G Agarose (Product # 20421), washed extensively, and eluted with 5X Lane Marker Reducing Sample Buffer (Product # 39000). Jurkat cell lysate (40 µg) was loaded as a positive control (left lane). The sample was resolved on a 4-20% Tris-HCl polyacrylamide gel, transferred to a PVDF membrane, and blocked with 5% BSA/TBS-0.1%Tween for 1 hour. The membrane was probed with a PKC alpha monoclonal antibody (Product # MA1-157) at a dilution of 1:1000 overnight rotating at 4°C, washed in TBST, and probed with a goat anti-mouse IgG-HRP secondary antibody (Product # 31430) at a dilution of 1:20,000 for least 1 hour. Chemiluminescent detection was performed using SuperSignal West Pico (Product # 34080).
Supportive validation
- Submitted by
- Invitrogen Antibodies (provider)
- Main image

- Experimental details
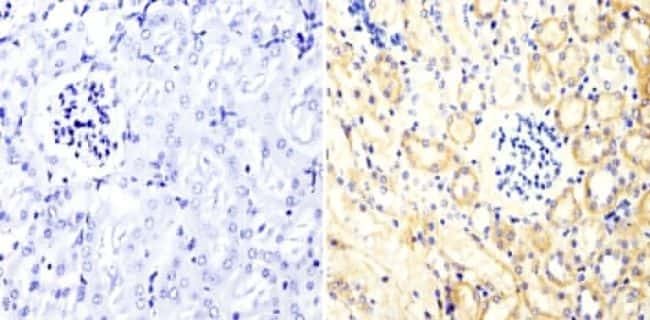
- Immunohistochemistry analysis of PKC alpha showing staining in the cytoplasm of paraffin-embedded mouse kidney tissue (right) compared with a negative control without primary antibody (left). To expose target proteins, antigen retrieval was performed using 10mM sodium citrate (pH 6.0), microwaved for 8-15 min. Following antigen retrieval, tissues were blocked in 3% H2O2-methanol for 15 min at room temperature, washed with ddH2O and PBS, and then probed with a PKC alpha monoclonal antibody (Product # MA1-157) diluted in 3% BSA-PBS at a dilution of 1:20 overnight at 4°C in a humidified chamber. Tissues were washed extensively in PBST and detection was performed using an HRP-conjugated secondary antibody followed by colorimetric detection using a DAB kit. Tissues were counterstained with hematoxylin and dehydrated with ethanol and xylene to prep for mounting.
Supportive validation
- Submitted by
- Invitrogen Antibodies (provider)
- Main image
- Experimental details
- NULL
- Submitted by
- Invitrogen Antibodies (provider)
- Main image

- Experimental details
- Immunoprecipitation of PKC alpha was performed using Jurkat whole cell lysate. Antigen-antibody complexes were formed by incubating 400 µg of lysate with 5 µg of a PKC alpha monoclonal antibody (Product # MA1-157) overnight on a rocking platform at 4øC. The immune complexes were captured on 50 µL Protein A/G Agarose (Product # 20421), washed extensively, and eluted with 5X Lane Marker Reducing Sample Buffer (Product # 39000). Jurkat cell lysate (40 µg) was loaded as a positive control (left lane). The sample was resolved on a 4-20% Tris-HCl polyacrylamide gel, transferred to a PVDF membrane, and blocked with 5% BSA/TBS-0.1%Tween for 1 hour. The membrane was probed with a PKC alpha monoclonal antibody (Product # MA1-157) at a dilution of 1:1000 overnight rotating at 4øC, washed in TBST, and probed with a goat anti-mouse IgG-HRP secondary antibody (Product # 31430) at a dilution of 1:20,000 for least 1 hour. Chemiluminescent detection was performed using SuperSignal West Pico (Product # 34080).

- Submitted by
- Invitrogen Antibodies (provider)
- Main image
- Experimental details
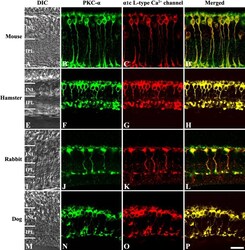
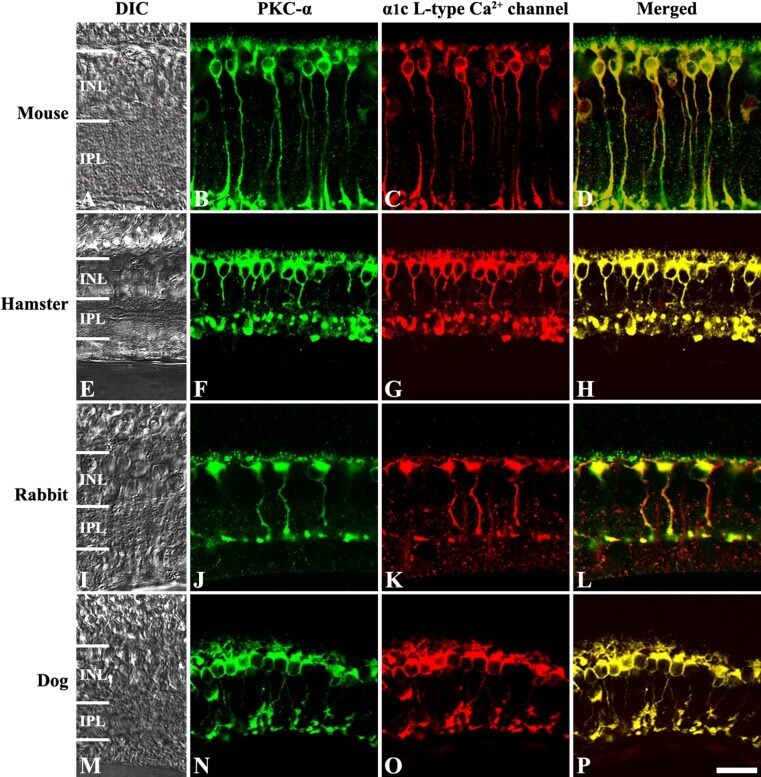
- Fig. 2. Confocal micrographs of vertical sections from the mouse, hamster, rabbit, and dog retinas. ( A, E, I, M ) DIC images were used to reveal the layers of retina. ( B, F, J, N ) Retinal sections were immunostained for PKC-alpha. ( C, G, K, O ) Retinal sections were immunostained for alpha 1 c L-type Ca 2+ channel. In both labelings, the immunoreactive cells displayed the morphology of rod bipolar cells as their cell bodies in the INL extended long axonal process throughout the IPL. ( D, H, L, P ) Superimposed images of PKC-alpha and alpha 1 c L-type Ca 2+ channel immunolabeling revealed an almost complete of colocalization. DIC, differential interference contrast; INL, inner nuclear layer; IPL, inner plexiform layer. Bar=20 mum.
- Submitted by
- Invitrogen Antibodies (provider)
- Main image
- Experimental details
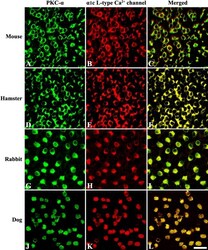
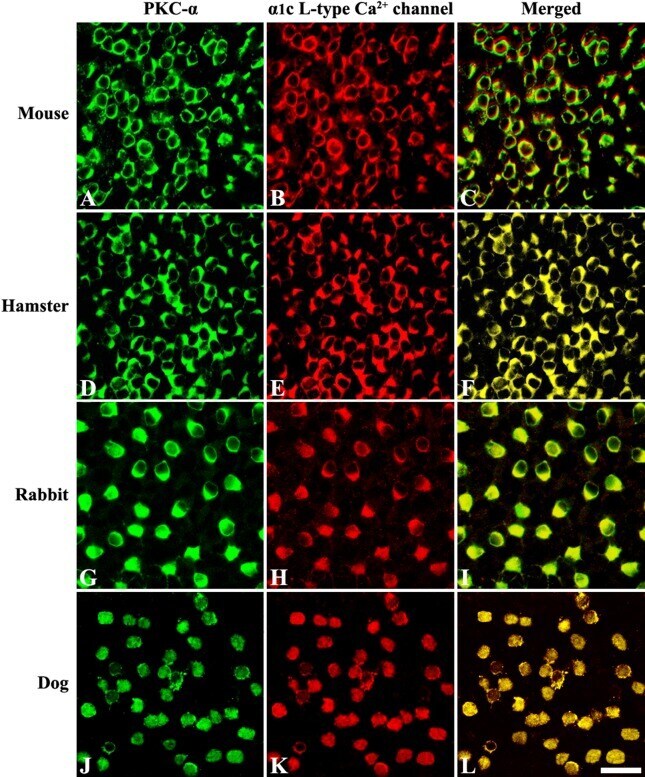
- Fig. 3. Confocal micrographs of whole mounts from the mouse, hamster, rabbit, and dog retinas. ( A, D, G, J ) Whole mounts were immunostained for PKC-alpha. ( B, E, H, K ) Whole mounts were immunostained for alpha 1 c L-type Ca 2+ channel. Immunolabeling was visible within the cytoplasm of rod bipolar cells. The immunoreactive cells in the mouse and hamster formed a tight mosaic compared to those in the rabbit and dog. ( C, F, I, L ) Superimposed images of PKC-alpha and alpha 1 c L-type Ca 2+ channel immunostaining revealed that these proteins were colocalized. Bar=20 mum.
- Submitted by
- Invitrogen Antibodies (provider)
- Main image
- Experimental details
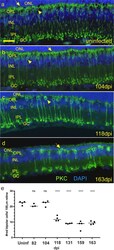
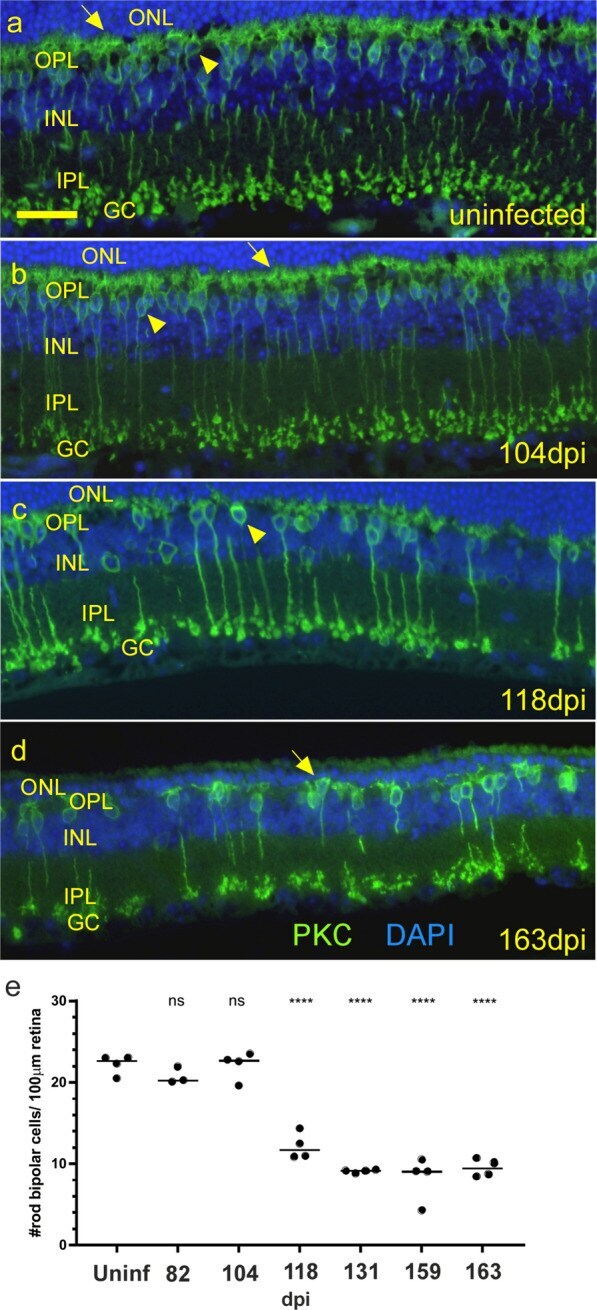
- Fig. 10 Changes in rod bipolar cells during infection. a anti-PKCalpha staining (green) in an uninfected mouse shows normal distribution and morphology of rod bipolar cells. Numerous dendrites (arrow) reach upward to synapse with photoreceptors in ONL from each cell body (arrowhead). b At 104 dpi rod bipolar cells appear similar to uninfected mouse. c By 118 dpi the number of bipolar cells has dropped to about half vs uninfected and some cell bodies have few if any associated dendrites (arrowhead). d Late in disease, at 163 dpi, rod bipolar cell number is significantly reduced compared to uninfected retina, and few dendrites reach into OPL (arrow). e The number of rod bipolar cells per 100 um of retina over time. Each dot represents counts from one field of view, line is median, ns = not significant, * p < 0.05, ** p < 0.01, *** p < 0.001, **** p 0.0001 statistics by one-way ANOVA with multiple comparisons test. Scale bar in a = 20 um
- Submitted by
- Invitrogen Antibodies (provider)
- Main image
- Experimental details
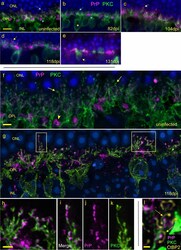
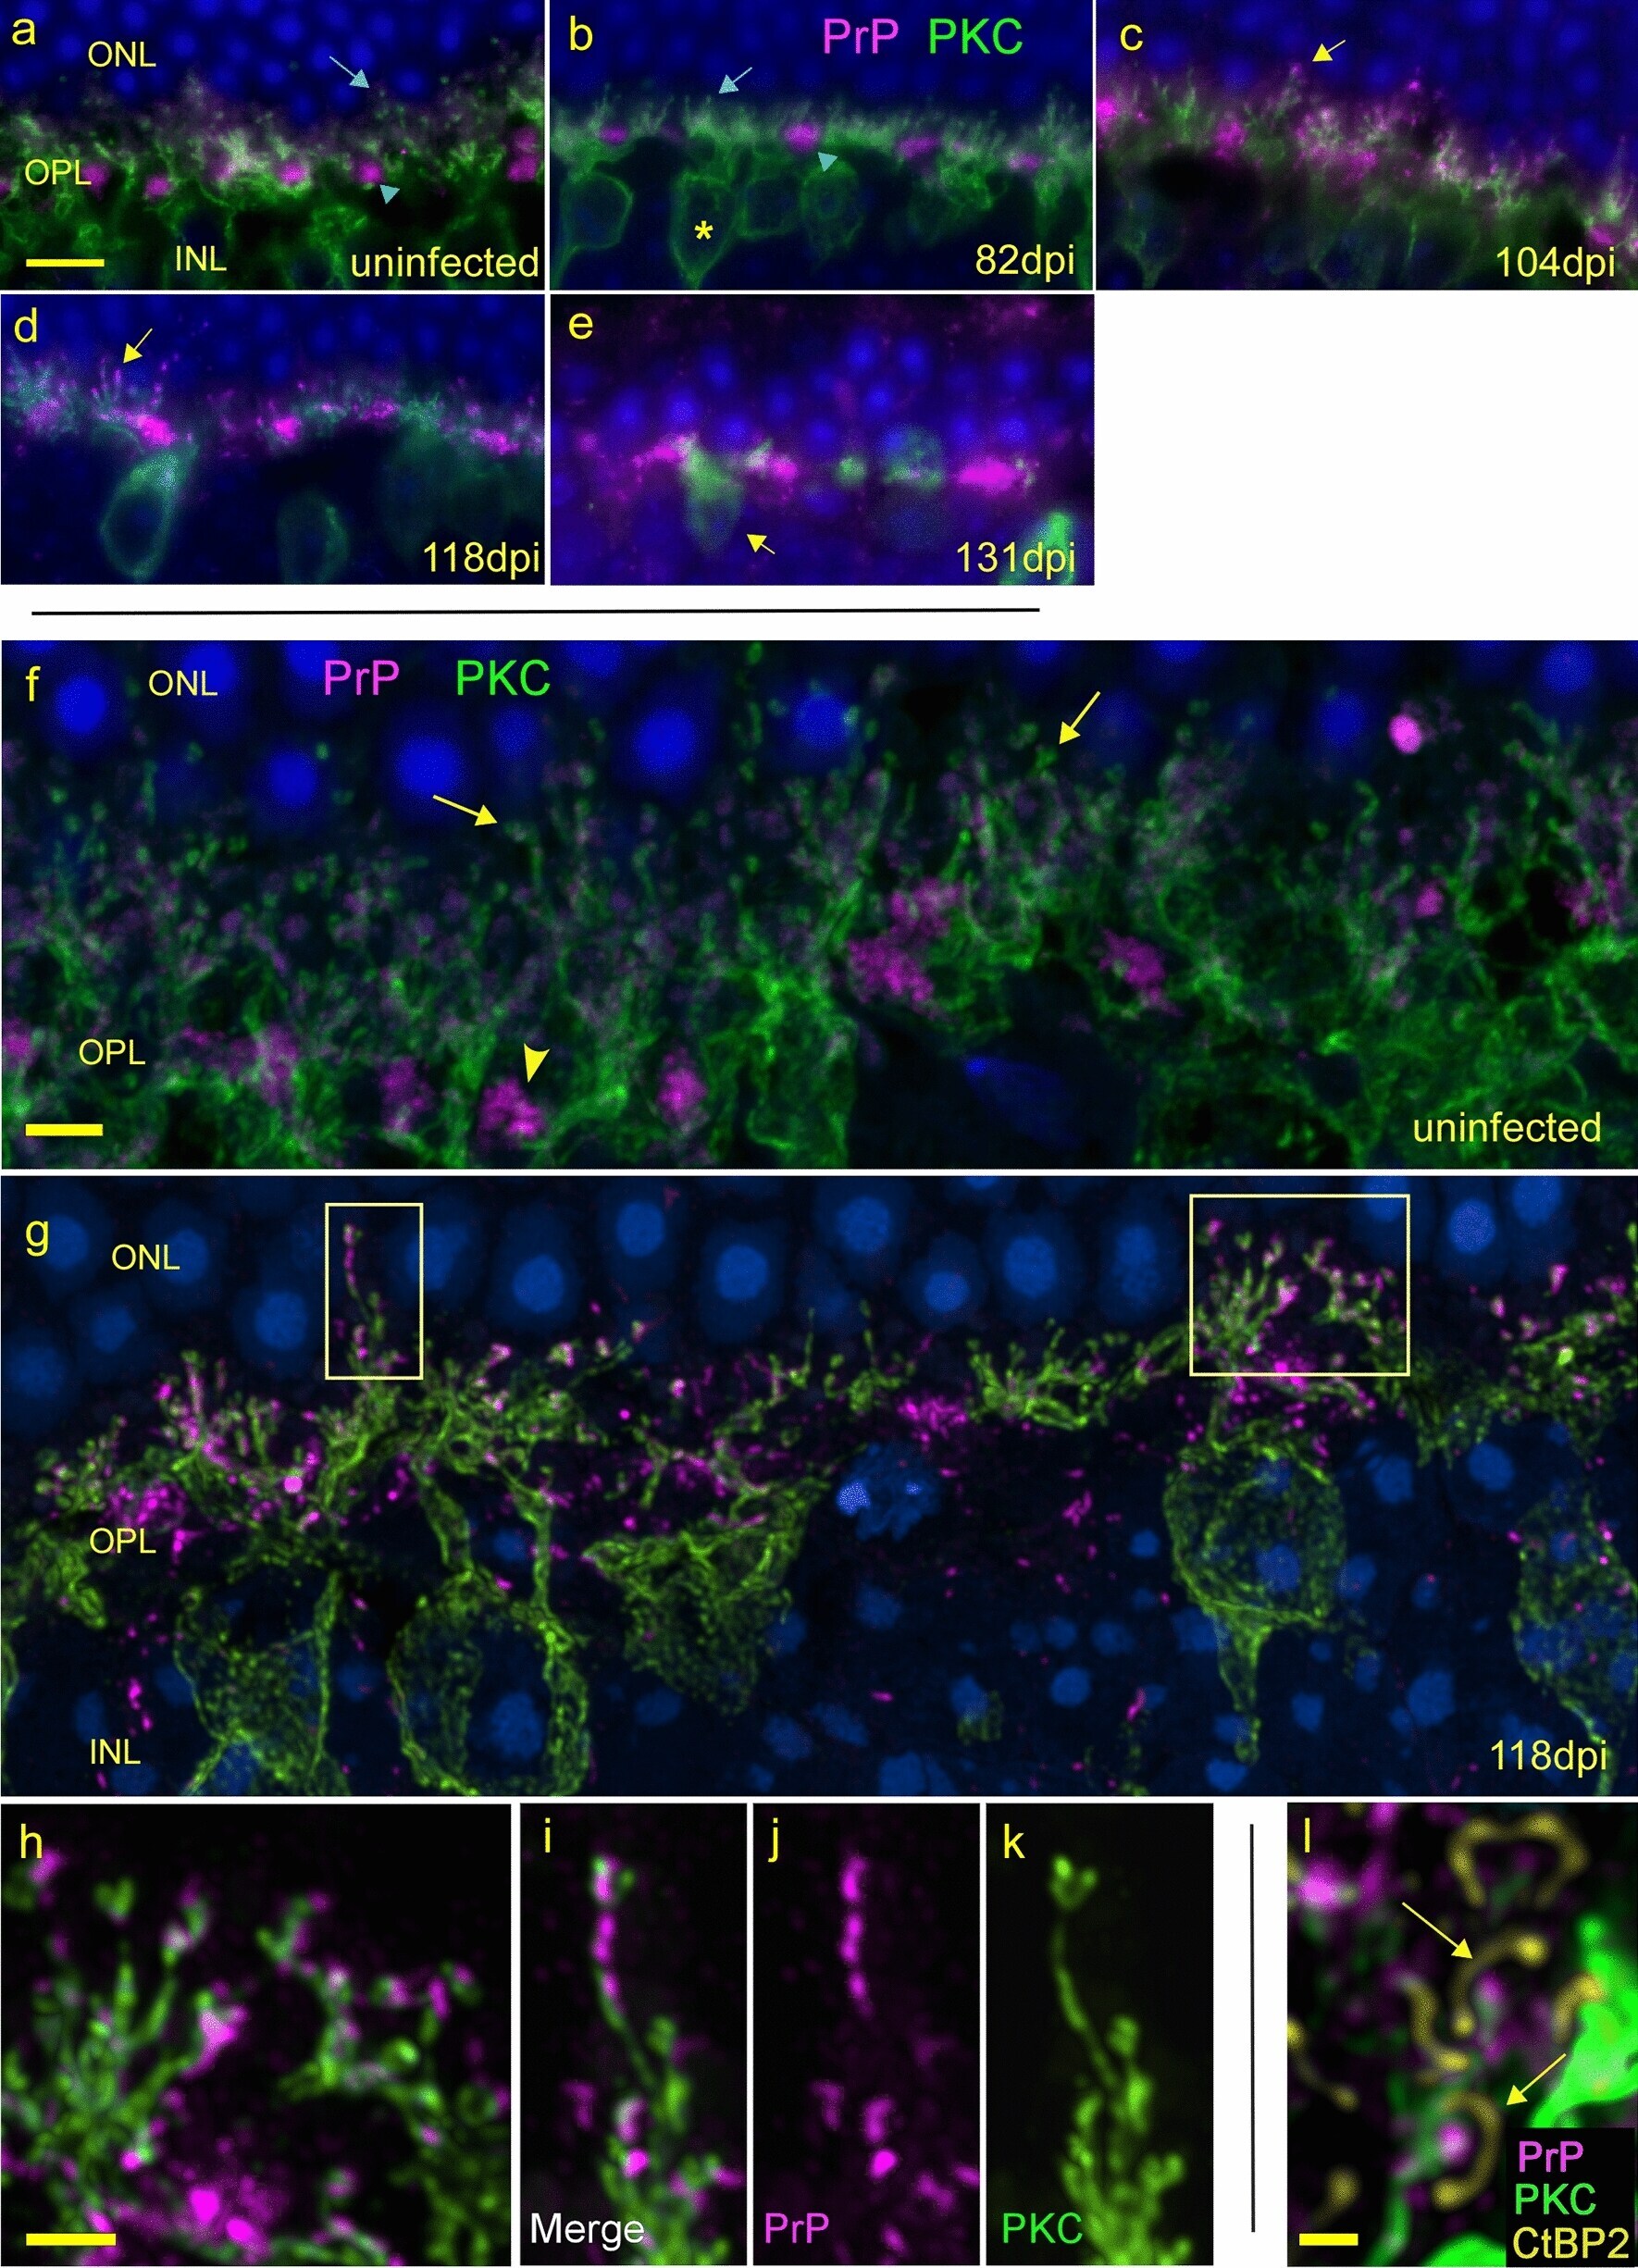
- Fig. 9 PrPSc accumulation at tips of rod bipolar cell dendrites and disappearance of dendrites. Epifluorescent microscopy analysis. a In uninfected retina, PrP (magenta) (blue arrowhead) and PKCalpha-positive rod bipolar cells (green) are seen near each other in the OPL. Many boutons (blue arrow) are present at dendritic tips of rod bipolar cells. b At 82 dpi, OPL appears similar to uninfected. Asterisk marks a rod bipolar cell body in INL. c At 104 dpi, PrP staining appears at dendritic tips. d At 118 dpi, most PKCalpha-positive dendrites display PrP at tips of processes (boutons) (arrow). e By 131 dpi most dendrites and dendritic boutons have disappeared, bipolar cell bodies remain (arrow), and PrPSc is distributed in large aggregates. Confocal analysis. f Maximum intensity projection shows PKCalpha and PrP staining of uninfected retina. Arrows indicate PKCalpha-positive rod bipolar cells with obvious boutons at the ends of dendrites. g A 118 dpi retina shows PrPSc arranged in bead-like deposits on dendrites, often replacing boutons. Magnification of boxes on left and right are shown below in panels h - k . h Confocal image shows association of PrPSc with dendrites and dendritic tips in area of right box from g . i-k Confocal images show merged, PrP and PKC staining of left box area in g . l In a high magnification of confocal image, anti-CtBP2 antibody marks ribbons (arrows) and confirms PrPSc deposits (magenta) on tips of dendrites (green) invaginating, but not touching,
- Submitted by
- Invitrogen Antibodies (provider)
- Main image
- Experimental details
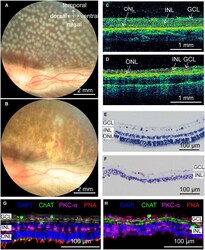
- FIGURE 5 Rabbit retinal photoreceptors across the entire retina were damaged by photocoagulation with 100 mW laser power, 50 ms pulse duration, and 500 mum laser spot size. (A,B) Fundus photographs of extensive damage of retinal photoreceptors at 1 h and 7 days after photocoagulation. Scale bar = 2 mm. (C) Control OCT image of rabbit retina. Scale bar = 1 mm. (D) Example of OCT image of rabbit retina at 7 days after photocoagulation. Scale bar = 1 mm. Red lines in (C,D) mark retina stratification. (E,F) Histomorphology of control rabbit retina (E) and rabbit retina 7 days after photocoagulation (F) . Scale bar = 100 mum. (G,H) Immunofluorescence staining of control rabbit retina (G) and rabbit retina 7 days after photocoagulation (H) with cone outer segments marker PNA, bipolar cell marker PKC-alpha and amacrine cell marker ChAT 7 days after photocoagulation. Scale bar = 100 mum. GCL, ganglion cell layer; INL, inner nuclear layer; ONL, outer nuclear layer.
