Explore
 Validate
 Learn
Learn Western blot
 ELISA
ELISA Immunocytochemistry
Antibody data
- Antibody Data
- Antigen structure
- References [22]
- Comments [0]
- Validations
- Immunocytochemistry [2]
- Immunohistochemistry [4]
- Flow cytometry [1]
- Other assay [20]
Submit
Validation data
Reference
Comment
Report error
- Product number
- AHB0261 - Provider product page

- Provider
- Invitrogen Antibodies
- Product name
- alpha Synuclein Monoclonal Antibody (Syn 211)
- Antibody type
- Monoclonal
- Antigen
- Recombinant full-length protein
- Description
- A suggested positive control for this product is SHSY-5Y cells. It will not cross-react with mouse or rat.
- Reactivity
- Human
- Host
- Mouse
- Isotype
- IgG
- Antibody clone number
- Syn 211
- Vial size
- 100 μg
- Concentration
- 0.5 mg/mL
- Storage
- Maintain refrigerated at 2-8°C for up to 1 month. For long term storage store at -20°C
Submitted references Vocal changes in a zebra finch model of Parkinson's disease characterized by alpha-synuclein overexpression in the song-dedicated anterior forebrain pathway.
Inhibition of Ubiquitin-Specific Protease-13 Improves Behavioral Performance in Alpha-Synuclein Expressing Mice.
Aberrant Expression of Circulating MicroRNA Leads to the Dysregulation of Alpha-Synuclein and Other Pathogenic Genes in Parkinson's Disease.
Novel Ubiquitin Specific Protease-13 Inhibitors Alleviate Neurodegenerative Pathology.
Cell type-specific lipid storage changes in Parkinson's disease patient brains are recapitulated by experimental glycolipid disturbance.
Skd3 (human ClpB) is a potent mitochondrial protein disaggregase that is inactivated by 3-methylglutaconic aciduria-linked mutations.
Amido-bridged nucleic acid (AmNA)-modified antisense oligonucleotides targeting α-synuclein as a novel therapy for Parkinson's disease.
Replication of multiple system atrophy prions in primary astrocyte cultures from transgenic mice expressing human α-synuclein.
A protocol for precise comparisons of small vessel disease lesions between ex vivo magnetic resonance imaging and histopathology.
A53T-α-synuclein overexpression in murine locus coeruleus induces Parkinson's disease-like pathology in neurons and glia.
Bimolecular Fluorescence Complementation of Alpha-synuclein Demonstrates its Oligomerization with Dopaminergic Phenotype in Mice.
DJ-1 Inhibits α-Synuclein Aggregation by Regulating Chaperone-Mediated Autophagy.
Subthalamic Nucleus Deep Brain Stimulation Does Not Modify the Functional Deficits or Axonopathy Induced by Nigrostriatal α-Synuclein Overexpression.
Structural basis for the dissociation of α-synuclein fibrils triggered by pressure perturbation of the hydrophobic core.
Salivary total α-synuclein, oligomeric α-synuclein and SNCA variants in Parkinson's disease patients.
Cortical phosphorylated α-Synuclein levels correlate with brain wave spectra in Parkinson's disease.
A brain-targeted, modified neurosin (kallikrein-6) reduces α-synuclein accumulation in a mouse model of multiple system atrophy.
Lack of additive role of ageing in nigrostriatal neurodegeneration triggered by α-synuclein overexpression.
Hypoestoxide reduces neuroinflammation and α-synuclein accumulation in a mouse model of Parkinson's disease.
Using gastrocnemius sEMG and plasma α-synuclein for the prediction of freezing of gait in Parkinson's disease patients.
Morphological and behavioral impact of AAV2/5-mediated overexpression of human wildtype alpha-synuclein in the rat nigrostriatal system.
Neuropathology in mice expressing mouse alpha-synuclein.
Medina CA, Vargas E, Munger SJ, Miller JE
PloS one 2022;17(5):e0265604
PloS one 2022;17(5):e0265604
Inhibition of Ubiquitin-Specific Protease-13 Improves Behavioral Performance in Alpha-Synuclein Expressing Mice.
Liu X, Balaraman K, Lynch CC, Hebron M, Shah PK, Hu S, Stevenson M, Wolf C, Moussa C
International journal of molecular sciences 2022 Jul 23;23(15)
International journal of molecular sciences 2022 Jul 23;23(15)
Aberrant Expression of Circulating MicroRNA Leads to the Dysregulation of Alpha-Synuclein and Other Pathogenic Genes in Parkinson's Disease.
Cai M, Chai S, Xiong T, Wei J, Mao W, Zhu Y, Li X, Wei W, Dai X, Yang B, Liu W, Shu B, Wang M, Lu T, Cai Y, Zheng Z, Mei Z, Zhou Y, Yang J, Zhao J, Shen L, Ho JWK, Chen J, Xiong N
Frontiers in cell and developmental biology 2021;9:695007
Frontiers in cell and developmental biology 2021;9:695007
Novel Ubiquitin Specific Protease-13 Inhibitors Alleviate Neurodegenerative Pathology.
Liu X, Balaraman K, Lynch CC, Hebron M, Wolf C, Moussa C
Metabolites 2021 Sep 15;11(9)
Metabolites 2021 Sep 15;11(9)
Cell type-specific lipid storage changes in Parkinson's disease patient brains are recapitulated by experimental glycolipid disturbance.
Brekk OR, Honey JR, Lee S, Hallett PJ, Isacson O
Proceedings of the National Academy of Sciences of the United States of America 2020 Nov 3;117(44):27646-27654
Proceedings of the National Academy of Sciences of the United States of America 2020 Nov 3;117(44):27646-27654
Skd3 (human ClpB) is a potent mitochondrial protein disaggregase that is inactivated by 3-methylglutaconic aciduria-linked mutations.
Cupo RR, Shorter J
eLife 2020 Jun 23;9
eLife 2020 Jun 23;9
Amido-bridged nucleic acid (AmNA)-modified antisense oligonucleotides targeting α-synuclein as a novel therapy for Parkinson's disease.
Uehara T, Choong CJ, Nakamori M, Hayakawa H, Nishiyama K, Kasahara Y, Baba K, Nagata T, Yokota T, Tsuda H, Obika S, Mochizuki H
Scientific reports 2019 May 21;9(1):7567
Scientific reports 2019 May 21;9(1):7567
Replication of multiple system atrophy prions in primary astrocyte cultures from transgenic mice expressing human α-synuclein.
Krejciova Z, Carlson GA, Giles K, Prusiner SB
Acta neuropathologica communications 2019 May 20;7(1):81
Acta neuropathologica communications 2019 May 20;7(1):81
A protocol for precise comparisons of small vessel disease lesions between ex vivo magnetic resonance imaging and histopathology.
Humphreys CA, Jansen MA, Muñoz Maniega S, González-Castro V, Pernet C, Deary IJ, Al-Shahi Salman R, Wardlaw JM, Smith C
International journal of stroke : official journal of the International Stroke Society 2019 Apr;14(3):310-320
International journal of stroke : official journal of the International Stroke Society 2019 Apr;14(3):310-320
A53T-α-synuclein overexpression in murine locus coeruleus induces Parkinson's disease-like pathology in neurons and glia.
Henrich MT, Geibl FF, Lee B, Chiu WH, Koprich JB, Brotchie JM, Timmermann L, Decher N, Matschke LA, Oertel WH
Acta neuropathologica communications 2018 May 10;6(1):39
Acta neuropathologica communications 2018 May 10;6(1):39
Bimolecular Fluorescence Complementation of Alpha-synuclein Demonstrates its Oligomerization with Dopaminergic Phenotype in Mice.
Cai W, Feng D, Schwarzschild MA, McLean PJ, Chen X
EBioMedicine 2018 Mar;29:13-22
EBioMedicine 2018 Mar;29:13-22
DJ-1 Inhibits α-Synuclein Aggregation by Regulating Chaperone-Mediated Autophagy.
Xu CY, Kang WY, Chen YM, Jiang TF, Zhang J, Zhang LN, Ding JQ, Liu J, Chen SD
Frontiers in aging neuroscience 2017;9:308
Frontiers in aging neuroscience 2017;9:308
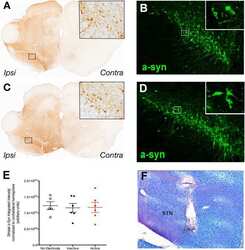
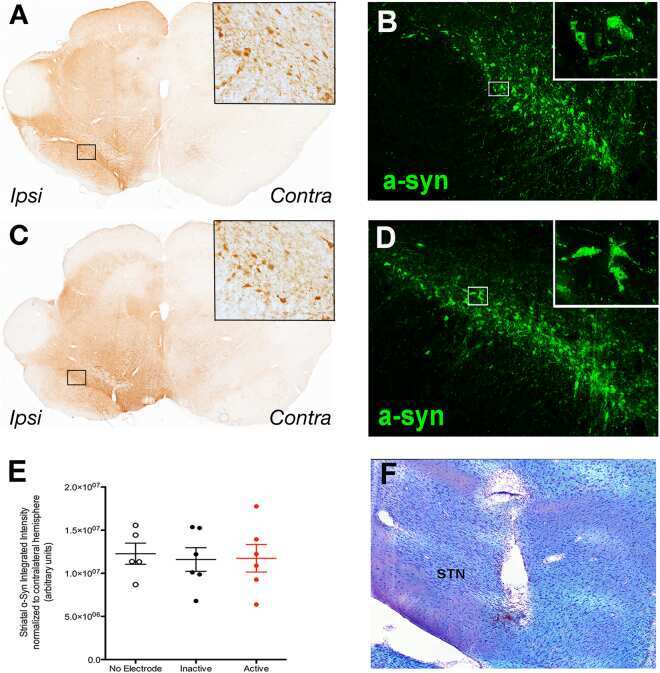
Subthalamic Nucleus Deep Brain Stimulation Does Not Modify the Functional Deficits or Axonopathy Induced by Nigrostriatal α-Synuclein Overexpression.
Fischer DL, Manfredsson FP, Kemp CJ, Cole-Strauss A, Lipton JW, Duffy MF, Polinski NK, Steece-Collier K, Collier TJ, Gombash SE, Buhlinger DJ, Sortwell CE
Scientific reports 2017 Nov 27;7(1):16356
Scientific reports 2017 Nov 27;7(1):16356
Structural basis for the dissociation of α-synuclein fibrils triggered by pressure perturbation of the hydrophobic core.
de Oliveira GA, Marques MA, Cruzeiro-Silva C, Cordeiro Y, Schuabb C, Moraes AH, Winter R, Oschkinat H, Foguel D, Freitas MS, Silva JL
Scientific reports 2016 Nov 30;6:37990
Scientific reports 2016 Nov 30;6:37990
Salivary total α-synuclein, oligomeric α-synuclein and SNCA variants in Parkinson's disease patients.
Kang W, Chen W, Yang Q, Zhang L, Zhang L, Wang X, Dong F, Zhao Y, Chen S, Quinn TJ, Zhang J, Chen S, Liu J
Scientific reports 2016 Jun 23;6:28143
Scientific reports 2016 Jun 23;6:28143
Cortical phosphorylated α-Synuclein levels correlate with brain wave spectra in Parkinson's disease.
Caviness JN, Lue LF, Hentz JG, Schmitz CT, Adler CH, Shill HA, Sabbagh MN, Beach TG, Walker DG
Movement disorders : official journal of the Movement Disorder Society 2016 Jul;31(7):1012-9
Movement disorders : official journal of the Movement Disorder Society 2016 Jul;31(7):1012-9
A brain-targeted, modified neurosin (kallikrein-6) reduces α-synuclein accumulation in a mouse model of multiple system atrophy.
Spencer B, Valera E, Rockenstein E, Trejo-Morales M, Adame A, Masliah E
Molecular neurodegeneration 2015 Sep 23;10:48
Molecular neurodegeneration 2015 Sep 23;10:48
Lack of additive role of ageing in nigrostriatal neurodegeneration triggered by α-synuclein overexpression.
Bourdenx M, Dovero S, Engeln M, Bido S, Bastide MF, Dutheil N, Vollenweider I, Baud L, Piron C, Grouthier V, Boraud T, Porras G, Li Q, Baekelandt V, Scheller D, Michel A, Fernagut PO, Georges F, Courtine G, Bezard E, Dehay B
Acta neuropathologica communications 2015 Jul 25;3:46
Acta neuropathologica communications 2015 Jul 25;3:46
Hypoestoxide reduces neuroinflammation and α-synuclein accumulation in a mouse model of Parkinson's disease.
Kim C, Ojo-Amaize E, Spencer B, Rockenstein E, Mante M, Desplats P, Wrasidlo W, Adame A, Nchekwube E, Oyemade O, Okogun J, Chan M, Cottam H, Masliah E
Journal of neuroinflammation 2015 Dec 18;12:236
Journal of neuroinflammation 2015 Dec 18;12:236
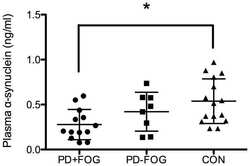
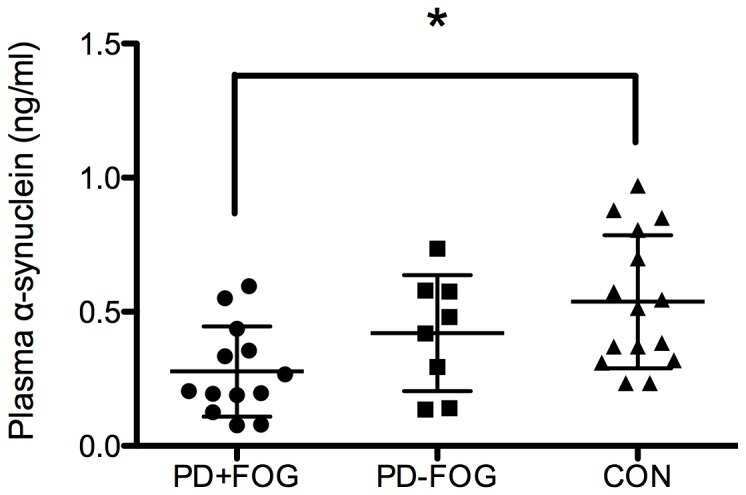
Using gastrocnemius sEMG and plasma α-synuclein for the prediction of freezing of gait in Parkinson's disease patients.
Wang XY, Kang WY, Yang Q, Zhang LY, Chen SD, Liu J
PloS one 2014;9(2):e89353
PloS one 2014;9(2):e89353
Morphological and behavioral impact of AAV2/5-mediated overexpression of human wildtype alpha-synuclein in the rat nigrostriatal system.
Gombash SE, Manfredsson FP, Kemp CJ, Kuhn NC, Fleming SM, Egan AE, Grant LM, Ciucci MR, MacKeigan JP, Sortwell CE
PloS one 2013;8(11):e81426
PloS one 2013;8(11):e81426
Neuropathology in mice expressing mouse alpha-synuclein.
Rieker C, Dev KK, Lehnhoff K, Barbieri S, Ksiazek I, Kauffmann S, Danner S, Schell H, Boden C, Ruegg MA, Kahle PJ, van der Putten H, Shimshek DR
PloS one 2011;6(9):e24834
PloS one 2011;6(9):e24834
No comments: Submit comment
Supportive validation
- Submitted by
- Invitrogen Antibodies (provider)
- Main image

- Experimental details
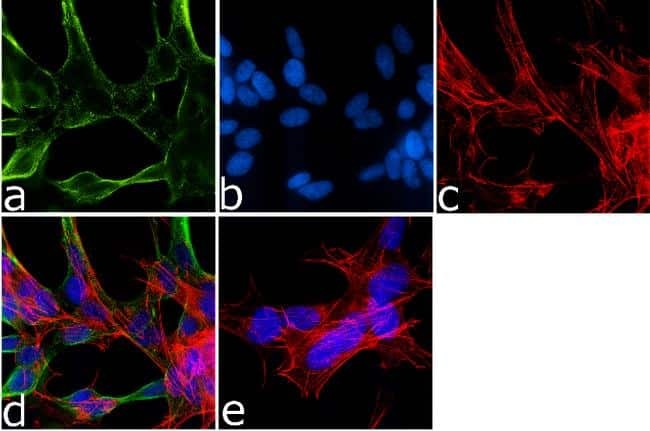
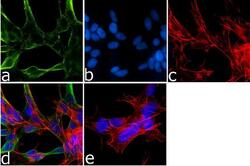
- Immunofluorescence analysis of Synuclein-alpha was done on 70% confluent log phase SH-SY5Y cells. The cells were fixed with 4% paraformaldehyde for 15 minutes, permeabilized with 0.25% Triton™ X-100 for 10 minutes, and blocked with 5% BSA for 1 hour at room temperature. The cells were labeled with Synuclein-alpha Mouse Monoclonal Antibody (Product # AHB0261) at 1 µg/mL in 1% BSA and incubated for 3 hours at room temperature and then labeled with Goat anti-Mouse IgG (H+L) Superclonal™ Secondary Antibody, Alexa Fluor® 488 conjugate (Product # A28175) at a dilution of 1:2000 for 45 minutes at room temperature (Panel a: green). Nuclei (Panel b: blue) were stained with SlowFade® Gold Antifade Mountant with DAPI (Product # S36938). F-actin (Panel c: red) was stained with Alexa Fluor® 555 Rhodamine Phalloidin (Product # R415, 1:300). Panel d is a merged image showing cytoplasmic localization. Panel e is a no primary antibody control. The images were captured at 60X magnification.
- Submitted by
- Invitrogen Antibodies (provider)
- Main image
- Experimental details
- Immunofluorescence analysis of Synuclein-alpha was done on 70% confluent log phase SH-SY5Y cells. The cells were fixed with 4% paraformaldehyde for 15 minutes, permeabilized with 0.25% Triton™ X-100 for 10 minutes, and blocked with 5% BSA for 1 hour at room temperature. The cells were labeled with Synuclein-alpha Mouse Monoclonal Antibody (Product # AHB0261) at 1 µg/mL in 1% BSA and incubated for 3 hours at room temperature and then labeled with Goat anti-Mouse IgG (H+L) Superclonal™ Secondary Antibody, Alexa Fluor® 488 conjugate (Product # A28175) at a dilution of 1:2000 for 45 minutes at room temperature (Panel a: green). Nuclei (Panel b: blue) were stained with SlowFade® Gold Antifade Mountant with DAPI (Product # S36938). F-actin (Panel c: red) was stained with Alexa Fluor® 555 Rhodamine Phalloidin (Product # R415, 1:300). Panel d is a merged image showing cytoplasmic localization. Panel e is a no primary antibody control. The images were captured at 60X magnification.

Supportive validation
- Submitted by
- Invitrogen Antibodies (provider)
- Main image
- Experimental details
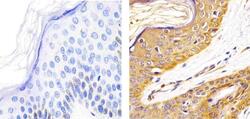
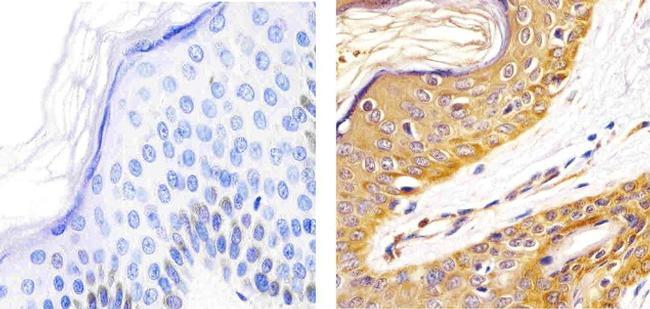
- IImmunohistochemistry analysis of ALPHA SYNUCLEIN showing staining in the cytoplasm and nucleus of paraffin-embedded human skin tissue (right) compared to a negative control without primary antibody (left). To expose target proteins, antigen retrieval was performed using 10mM sodium citrate (pH 6.0), microwaved for 8-15 min. Following antigen retrieval, tissues were blocked in 3% H2O2-methanol for 15 min at room temperature, washed with ddH2O and PBS, and then probed with a ALPHA SYNUCLEIN Mouse monoclonal antibody (Product # AHB0261) diluted in 3% BSA-PBS at a dilution of 1:20 overnight at 4ºC in a humidified chamber. Tissues were washed extensively in PBST and detection was performed using an HRP-conjugated secondary antibody followed by colorimetric detection using a DAB kit. Tissues were counterstained with hematoxylin and dehydrated with ethanol and xylene to prep for mounting.
- Submitted by
- Invitrogen Antibodies (provider)
- Main image
- Experimental details
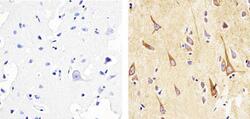
- Immunohistochemistry analysis of ALPHA SYNUCLEIN showing staining in the cytoplasm of paraffin-embedded human brain tissue (right) compared to a negative control without primary antibody (left). To expose target proteins, antigen retrieval was performed using 10mM sodium citrate (pH 6.0), microwaved for 8-15 min. Following antigen retrieval, tissues were blocked in 3% H2O2-methanol for 15 min at room temperature, washed with ddH2O and PBS, and then probed with a ALPHA SYNUCLEIN Mouse monoclonal antibody (Product # AHB0261) diluted in 3% BSA-PBS at a dilution of 1:100 overnight at 4ºC in a humidified chamber. Tissues were washed extensively in PBST and detection was performed using an HRP-conjugated secondary antibody followed by colorimetric detection using a DAB kit. Tissues were counterstained with hematoxylin and dehydrated with ethanol and xylene to prep for mounting.
- Submitted by
- Invitrogen Antibodies (provider)
- Main image
- Experimental details
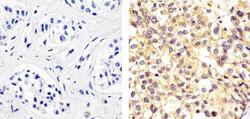
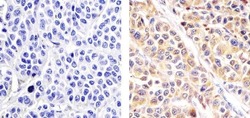
- Immunohistochemistry analysis of ALPHA SYNUCLEIN showing staining in the cytoplasm and nucleus of paraffin-embedded human breast carcinoma (right) compared to a negative control without primary antibody (left). To expose target proteins, antigen retrieval was performed using 10 mM sodium citrate (pH 6.0), microwaved for 8-15 min. Following antigen retrieval, tissues were blocked in 3% H2O2-methanol for 15 min at room temperature, washed with ddH2O and PBS, and then probed with a ALPHA SYNUCLEIN Mouse monoclonal antibody (Product # AHB0261) diluted in 3% BSA-PBS at a dilution of 1:20 overnight at 4°C in a humidified chamber. Tissues were washed extensively in PBST and detection was performed using an HRP-conjugated secondary antibody followed by colorimetric detection using a DAB kit. Tissues were counterstained with hematoxylin and dehydrated with ethanol and xylene to prep for mounting.

- Submitted by
- Invitrogen Antibodies (provider)
- Main image
- Experimental details
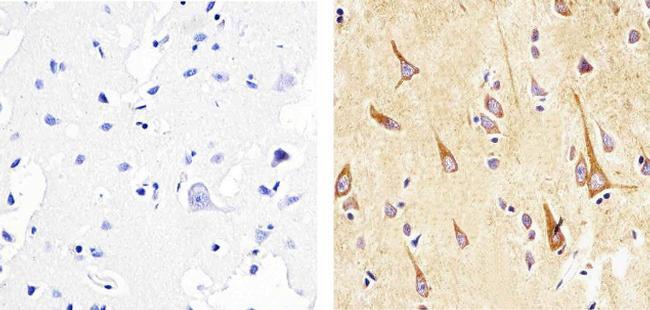
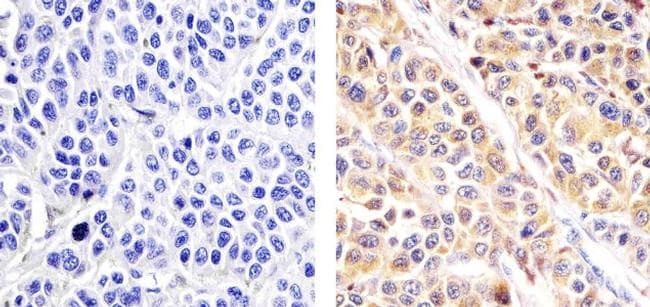
- Immunohistochemistry analysis of ALPHA SYNUCLEIN showing staining in the cytoplasm of paraffin-embedded human melanoma tissue (right) compared to a negative control without primary antibody (left). To expose target proteins, antigen retrieval was performed using 10mM sodium citrate (pH 6.0), microwaved for 8-15 min. Following antigen retrieval, tissues were blocked in 3% H2O2-methanol for 15 min at room temperature, washed with ddH2O and PBS, and then probed with a ALPHA SYNUCLEIN Mouse monoclonal antibody (Product # AHB0261) diluted in 3% BSA-PBS at a dilution of 1:100 overnight at 4ºC in a humidified chamber. Tissues were washed extensively in PBST and detection was performed using an HRP-conjugated secondary antibody followed by colorimetric detection using a DAB kit. Tissues were counterstained with hematoxylin and dehydrated with ethanol and xylene to prep for mounting.
Supportive validation
- Submitted by
- Invitrogen Antibodies (provider)
- Main image
- Experimental details
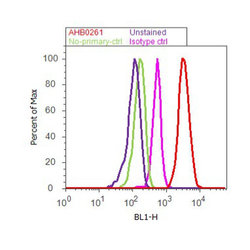
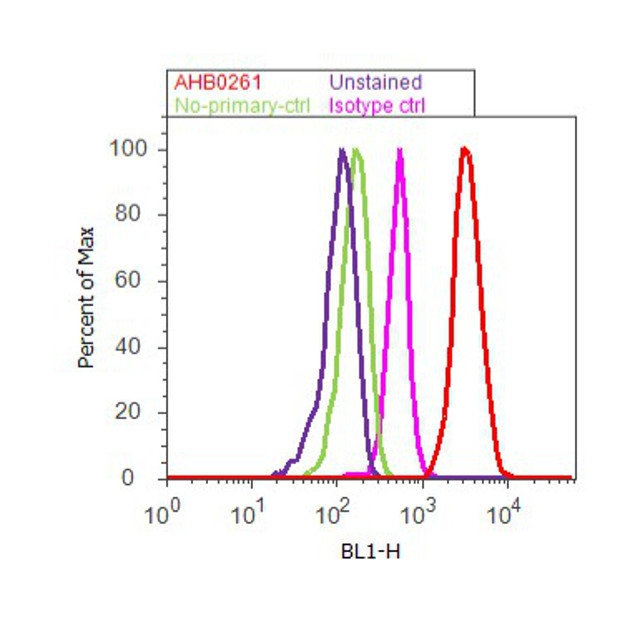
- Flow cytometry analysis of Synuclein-alpha was done on SH-SY5Y cells. Cells were fixed with 70% ethanol for 10 minutes, permeabilized with 0.25% Triton™ X-100 for 20 minutes, and blocked with 5% BSA for 30 minutes at room temperature. Cells were labeled with Synuclein-alpha Mouse Monoclonal Antibody (AHB0261, red histogram) or with mouse isotype control (pink histogram) at 3-5 ug/million cells in 2.5% BSA. After incubation at room temperature for 2 hours, the cells were labeled with Alexa Fluor® 488 Rabbit Anti-Mouse Secondary Antibody (A11059) at a dilution of 1:400 for 30 minutes at room temperature. The representative 10,000 cells were acquired and analyzed for each sample using an Attune® Acoustic Focusing Cytometer. The purple histogram represents unstained control cells and the green histogram represents no-primary-antibody control.
Supportive validation
- Submitted by
- Invitrogen Antibodies (provider)
- Main image
- Experimental details
- NULL
- Submitted by
- Invitrogen Antibodies (provider)
- Main image
- Experimental details
- NULL
- Submitted by
- Invitrogen Antibodies (provider)
- Main image
- Experimental details
- NULL
- Submitted by
- Invitrogen Antibodies (provider)
- Main image
- Experimental details
- NULL
- Submitted by
- Invitrogen Antibodies (provider)
- Main image
- Experimental details
- NULL
- Submitted by
- Invitrogen Antibodies (provider)
- Main image
- Experimental details
- NULL

- Submitted by
- Invitrogen Antibodies (provider)
- Main image
- Experimental details
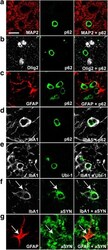
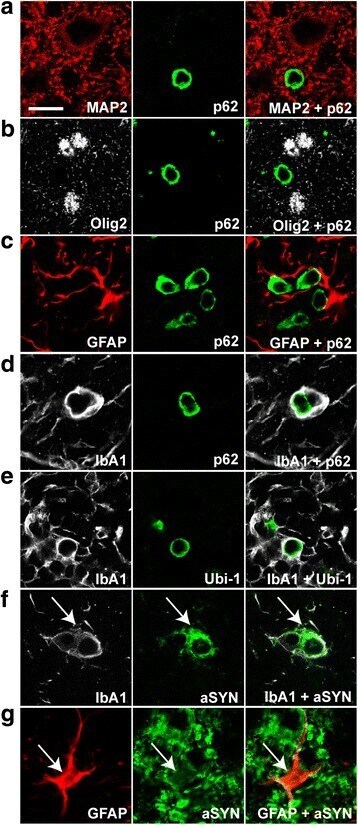
- Fig. 5 p62- and Ubi-1 positive aggregates co-localize with IbA1-positive microglia. a - c Representative confocal microscopy images of p62 (green, second column ) and MAP2 ( a , red, first row ), Olig2 ( b , gray, second row ), or GFAP ( c , red, third row ) show no co-localization of p62 and the different cellular markers. In contrast, co-staining p62 (green) and IbA1 ( d , gray, fourth row ) or Ubi-1 (green) and IbA1 ( e , gray, fifth row ) revealed clear co-localization. IbA1 positive microglial cells ( f , gray, sixth row ) and GFAP-positive astroglia ( g , red, seventh row ) also co-stained for aSYN ( arrows in f , g ). Scale bar for a - g 25 mum
- Submitted by
- Invitrogen Antibodies (provider)
- Main image
- Experimental details
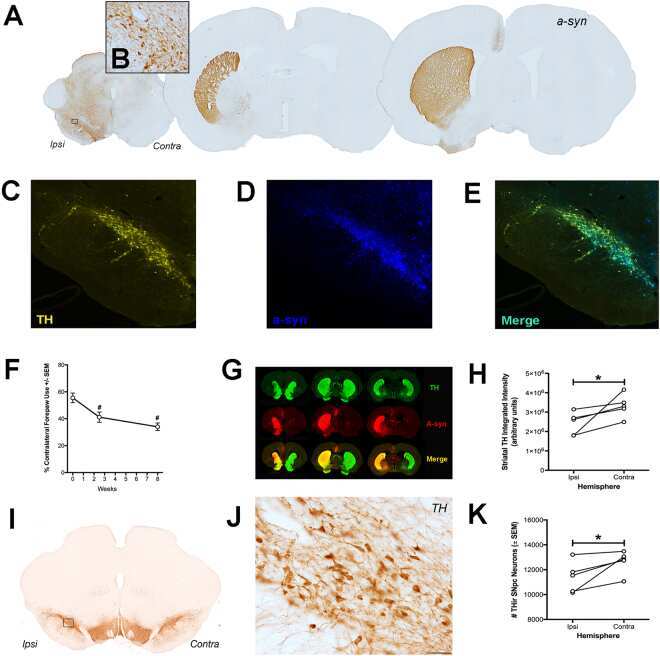
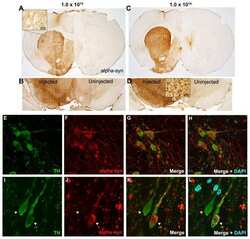
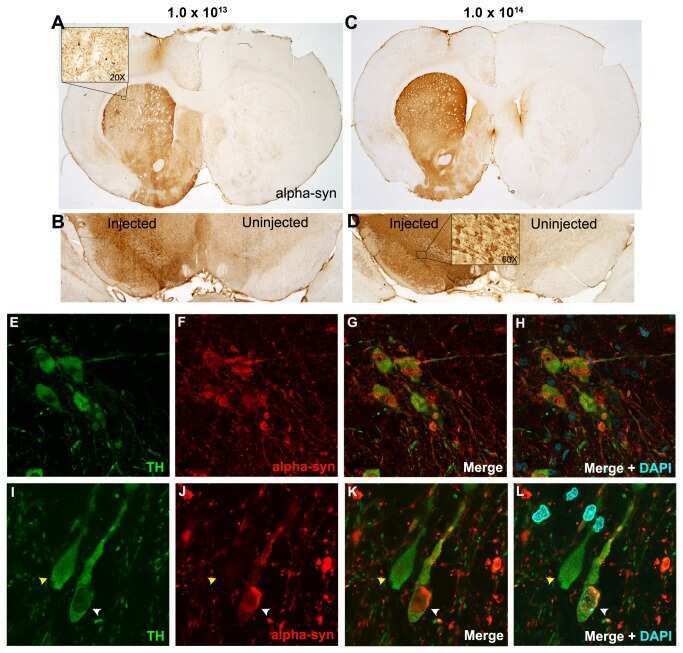
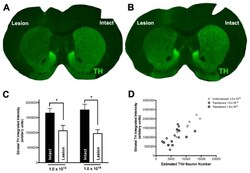
- Figure 4 alpha-syn overexpression decreased striatal TH expression. A - B . Pseudocolored near infrared TH immunofluorescence in the alpha-syn overexpressing (lesion) and intact striatum of 1.0 x 10 13 (vg/ml) titer ( A ) and 1.0 x 10 14 (vg/ml) titer ( B ) injected rats. C . TH expression was significantly reduced in the alpha-syn overexpressing striatum (*p < 0.001).

- Submitted by
- Invitrogen Antibodies (provider)
- Main image
- Experimental details
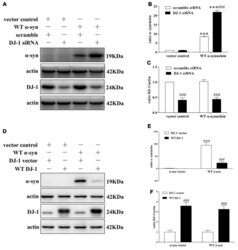
- Figure 1 DJ-1 inhibits alpha-synuclein accumulation in SH-SY5Y cells. (A-C) DJ-1 deficiency aggravated the accumulation of alpha-synuclein in SH-SY5Y cells. Wild-type (WT) alpha-synuclein plasmid and DJ-1 siRNA were co-transfected into SH-SY5Y cells for 48 h. Immunoblots for the indicated proteins are shown in (A) , and quantifications of changes in the levels of alpha-synuclein and DJ-1 are shown in (B,C) respectively (mean +- SEM, n = 3, *** p < 0.001 vs. alpha-synuclein vector control, ### p < 0.001 vs. scrambled control). (D-F) WT DJ-1 overexpression inhibited accumulation of alpha-synuclein in SH-SY5Y cells. WT alpha-synuclein plasmid and WT DJ-1 plasmid were co-transfected into SH-SY5Y cells for 48 h. Immunoblots for the indicated proteins are shown in (D) , and quantifications of changes in the levels of alpha-synuclein and DJ-1 are shown in (E,F) respectively (mean +- SEM, n = 6, *** p < 0.001 vs. alpha-synuclein vector control, ### p < 0.001 vs. DJ-1 vector control).

- Submitted by
- Invitrogen Antibodies (provider)
- Main image

- Experimental details
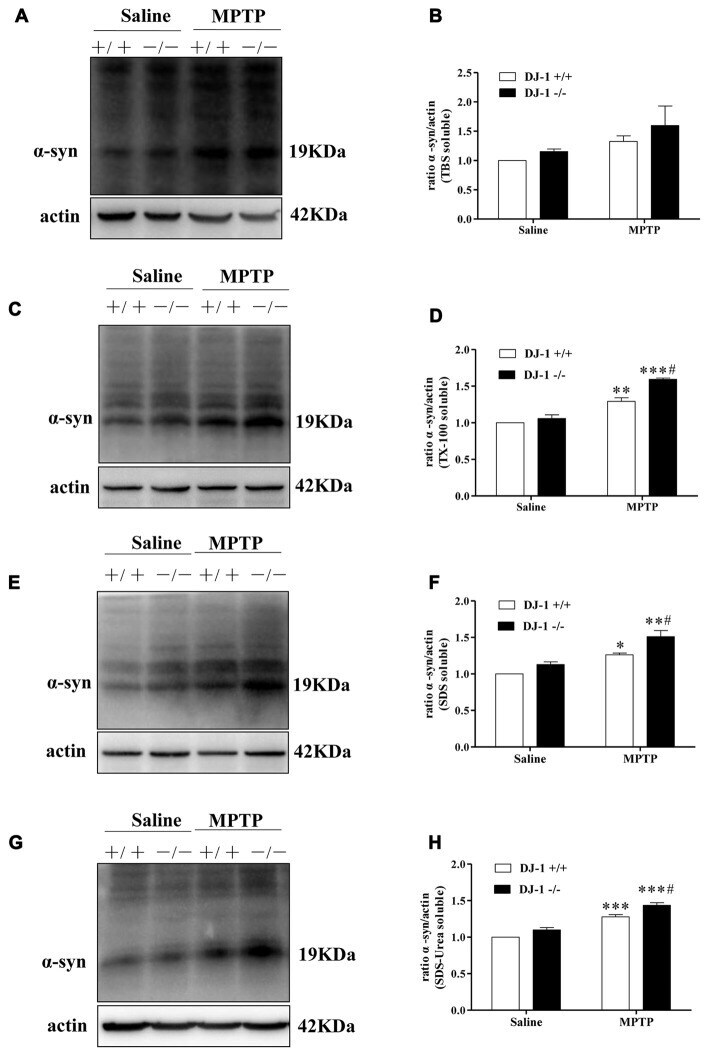
- Figure 2 DJ-1 inhibits the accumulation and aggregation of alpha-synuclein in Parkinson's disease (PD) animal models. (A-H) DJ-1 deficiency accelerates the accumulation and aggregation of alpha-synuclein in DJ-1-/- mouse ventral midbrain samples after Methyl-4-phenyl-1,2,3,6-tetrahydropyridine (MPTP) administration in the SDS-soluble and urea-soluble fraction compared with that of DJ-1+/+ mice. Immunoblots for alpha-synuclein are shown in (A) for TBS-soluble, (C) for TX-100-soluble, (E) for SDS-soluble and (G) for urea-soluble fractions. In addition, quantifications of changes in alpha-synuclein levels are shown in (B,D , F,H) (mean +- SEM, n = 3, * p < 0.05, ** p < 0.01, *** p < 0.001 vs. saline control; # p < 0.05 vs. DJ-1+/+).
- Submitted by
- Invitrogen Antibodies (provider)
- Main image
- Experimental details
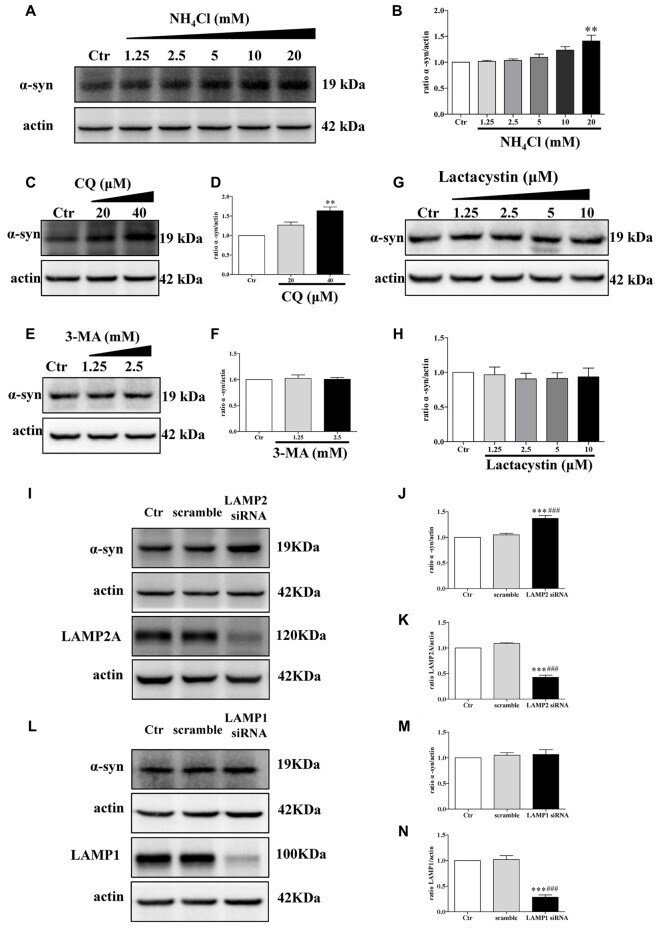
- Figure 3 Endogenous alpha-synuclein is degraded in lysosomes by chaperone-mediated autophagy (CMA) in SH-SY5Y cells. (A,B) Levels of endogenous alpha-synuclein were determined in SH-SY5Y cells treated with NH 4 Cl for 9.5 h. Immunoblots for the indicated proteins are shown in (A) and quantification of alpha-synuclein levels is shown in ( B ; mean +- SEM, n = 3, ** p < 0.01 vs. control). (C-H) Levels of endogenous alpha-synuclein were determined in SH-SY5Y cells treated with Chloroquine diphosphate (CQ), 3-methyladenine (3-MA) and lactacystin respectively for 24 h. Immunoblots for the indicated proteins are shown in (C , E,G) , and quantifications of alpha-synuclein levels are shown in (D , F , H) respectively (mean +- SEM, n = 3, ** p < 0.01 vs. control). (I-K) Levels of endogenous alpha-synuclein were determined in lysosome-associated membrane protein type-2 (LAMP2) knockdown SH-SY5Y cells. Immunoblots for the indicated proteins are shown in (I) , and the quantifications of alpha-synuclein and LAMP2A levels are shown in (J,K) respectively (mean +- SEM, n = 3, *** p < 0.001 vs. control, ### p < 0.001 vs. scramble). (L-N) Levels of endogenous alpha-synuclein were determined in LAMP1 knockdown SH-SY5Y cells. Immunoblots for the indicated proteins are shown in (L) , and the quantifications of alpha-synuclein and LAMP1 levels are shown in (M,N) respectively (mean +- SEM, n = 3, *** p < 0.001 vs. control, ### p < 0.001 vs. scramble).
- Submitted by
- Invitrogen Antibodies (provider)
- Main image
- Experimental details
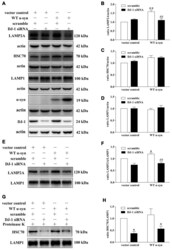
- Figure 4 Effects of DJ-1 deficiency on CMA and alpha-synuclein levels in SH-SY5Y cells. (A-D) Levels of LAMP2A, HSC70, LAMP1, alpha-synuclein and DJ-1 were determined in homogenates of SH-SY5Y cells co-transfected with WT alpha-synuclein plasmid and DJ-1 siRNA. Immunoblots for the indicated proteins are shown in (A) , and quantification of the levels of LAMP2A, HSC70 and LAMP-1 are shown in (B-D) respectively (mean +- SEM, n = 3, 3, 4, ** p < 0.01 vs. vector control, ## p < 0.01 vs. scramble). (E-H) Levels of LAMP2A, HSC70 and LAMP-1 in lysosome-enriched fractions isolated from SH-SY5Y cells co-transfected with WT alpha-synuclein plasmid and DJ-1 siRNA were determined. Immunoblots for the indicated proteins are shown in (E,G) , and quantifications of the levels of LAMP2A and HSC70 are shown in (F,H) respectively (mean +- SEM, n = 4, * p < 0.001 vs. vector control, ## p < 0.01 vs. scramble).

- Submitted by
- Invitrogen Antibodies (provider)
- Main image
- Experimental details
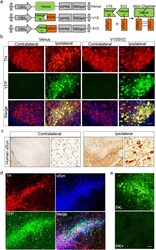
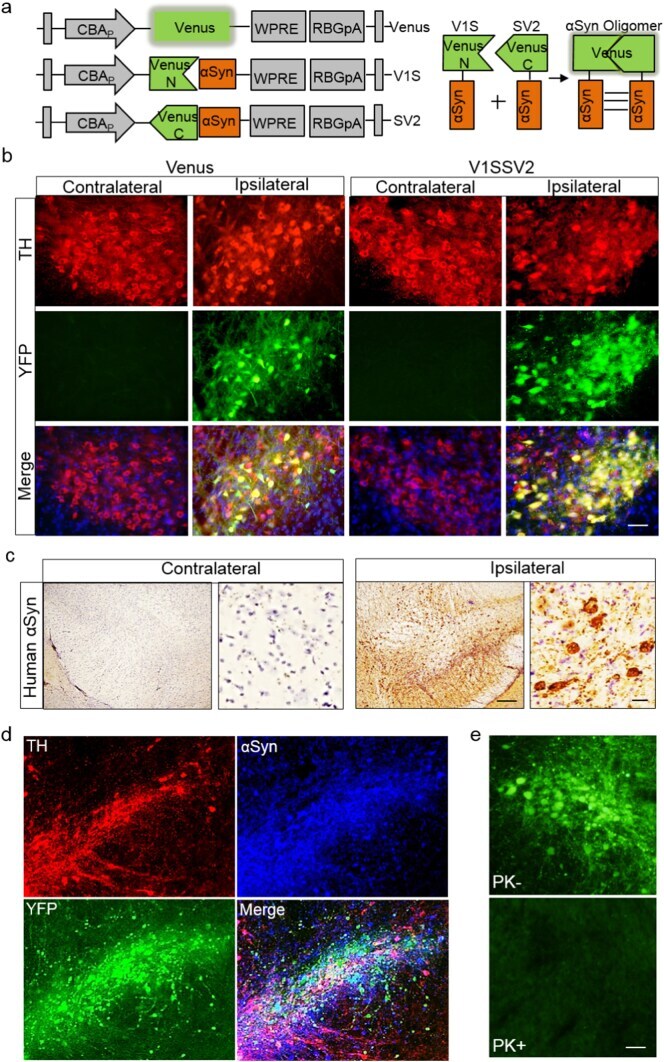
- Fig. 1 AAV8-mediated human WT alphaSyn expression in the SN and alphaSyn oligomerization detected by BiFC in mice at 4 weeks post-AAV injection. (a) Schematic structures of venus and alphaSyn-BiFCs (V1S and SV2). Upper right illustrates reconstitution of venusYFP fluorescence by alphasyn-alphasyn interactions. (b) TH immunofluorescence and venusYFP fluorescence in the SN. Tissue sections were counterstained with DAPI (blue). Scale bar: 30 mum. (c) Immunohistochemistry of human alphaSyn in the SN after V1SSV2 injection. Tissue sections were counterstained with hematoxylin (blue). Scale bars: 100 mum (left), 10 mum (right). (d) immunofluorescent double staining for TH and human alphaSyn and their colocalization with venusYFP in the SN after V1SSV2 injection. (e) VenusYFP before and after proteinase K treatment (PK- and PK+) in the SN following V1SSV2 injection. Scale bar: 30 mum. Fig. 1
- Submitted by
- Invitrogen Antibodies (provider)
- Main image
- Experimental details
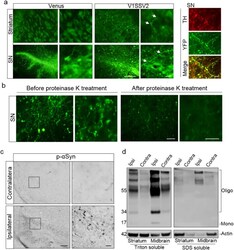
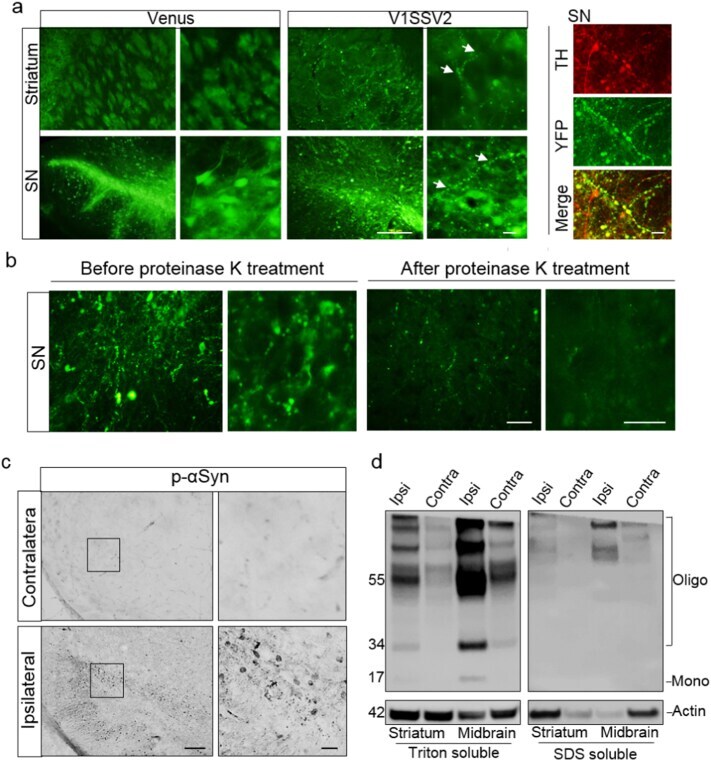
- Fig. 2 Human alphaSyn transduction induces synucleinopathies. (a) VenusYFP fluorescence in the striatum, venusYFP fluorescence and its colacalization with TH in the SN 8 weeks following venus or V1SSV2 injection. Arrows indicate beaded, dystrophic neurites. Scale bars: 100 mum (left), 10 mum (right). (b) VenusYFP before and after proteinase K treatment in the SN 12 weeks following V1SSV2 injection. Scale bars: 20 mum. (c) Immunohistochemistry for pSer129 alphaSyn in the SN 12 weeks following V1SSV2 injection. Scale bars: 50 mum (left), 10 mum (right). (d) Accumulation of high-molecular-weight-alphaSyn species in the ventral midbrain and the striatum 8 weeks following V1SSV2 injection by Western blot analysis using anti-human alphaSyn antibody. Tissue sequential extractions were prepared using Triton X-100 and SDS. Fig. 2
- Submitted by
- Invitrogen Antibodies (provider)
- Main image
- Experimental details
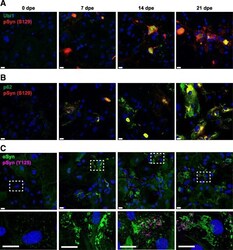
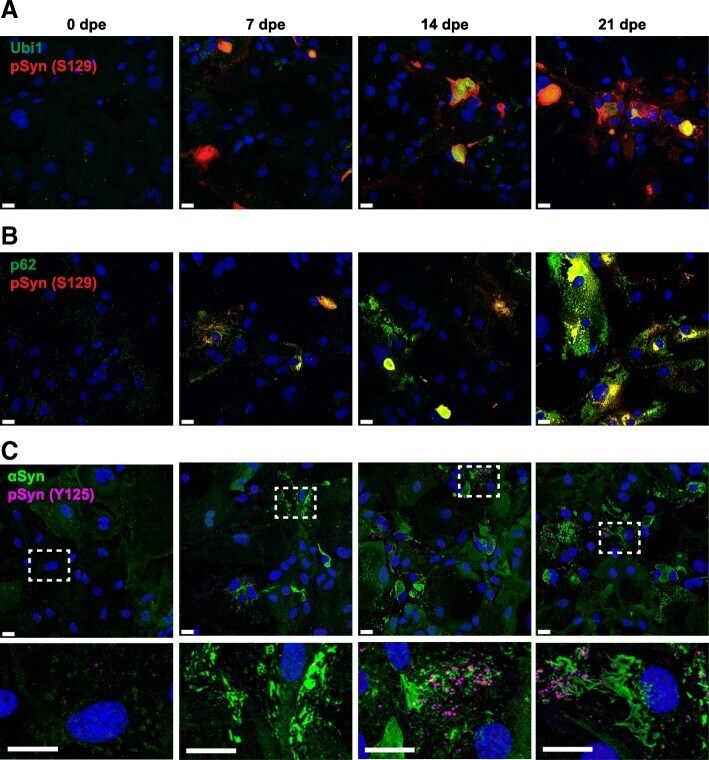
- Fig. 5 alpha-Synuclein inclusions in MSA-infected astrocytes are ubiquitinated and co-localized with p62 or contain alpha-synuclein phosphorylated at Y125. Representative immunographs of TgM83 +/+ primary astrocytes exposed to 0.5% secondary passaged MSA 2 brain homogenate for 48 h and immunostained at 0, 7, 14, and 21 days post-exposure (dpe) for a ubiquitin (green) and pSyn (S129) (red), b p62 (green) and pSyn (S129) (red), and c alphaSyn (green) and pSyn Y125 (magenta). Merge channels are shown, and c insets of dashed areas are shown in the bottom row. Nuclei were stained with DAPI (blue). Scale bars, 20 mum
- Submitted by
- Invitrogen Antibodies (provider)
- Main image
- Experimental details
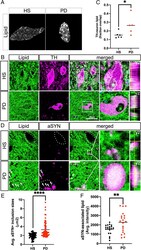
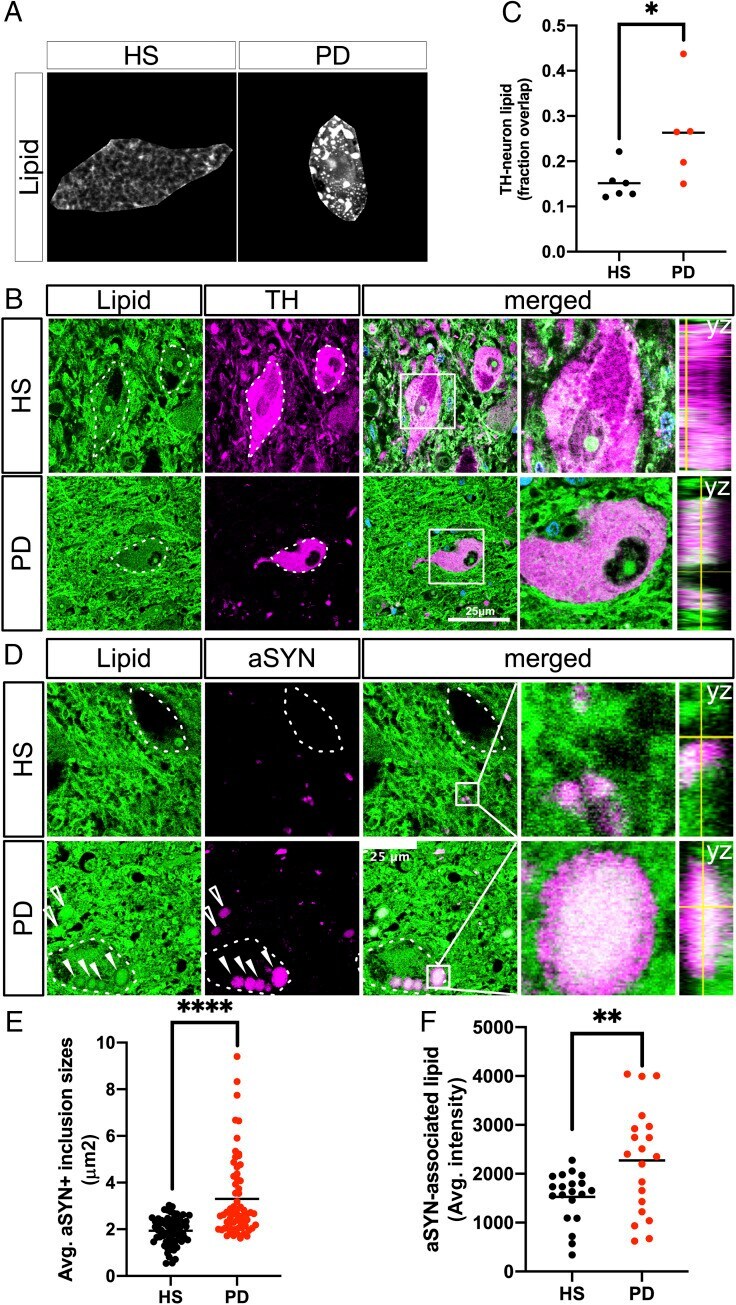
- Fig. 2. Neutral lipids accumulate in PD patient brains relative to age-matched healthy subjects and localize to aSYN-rich inclusion bodies within dopaminergic neurons of the SN. ( A ) Fluorescent micrographs labeled for neutral lipids (BODIPY) (gray-scale) in neuromelanized dopaminergic neurons of the HS SN and PD SN. Neuropigmented cell profiles were manually isolated from the surroundings for clarity. ( B ) Representative micrographs of neutral lipids (BODIPY; green) and TH (magenta) colabeled neurons in HS SN and PD SN. Nuclei (TO-PRO; blue) are shown merged. The dotted line represents TH + cell outlines. Boxed insets are shown in higher magnification with orthogonal views on the right (scale bar: 25 um). ( C ) Automated overlap coefficients of images colabeled as in B of the BODIPY + /TH + area over the total BODIPY + area, expressed as lipid (fraction overlap). * P < 0.05, n = 5 to 6 subject averages per group, n = 3 to 5 fields of view containing one or two cells per field (Z-stacks) per subject. The line indicates the mean, with individual values shown. ( D ) Representative micrograph of neutral lipid (green) and aSYN (magenta) in HS SN and PD SN. The dotted outline represents neuromelanin + cell profiles as identified by bright-field microscopy before confocal imaging. Boxed insets are shown in higher magnification with orthogonal views on the right. Filled arrowheads indicate intracellular Lewy bodies; empty arrowheads indicate Lewy body-like inclusions not associate
- Submitted by
- Invitrogen Antibodies (provider)
- Main image

- Experimental details
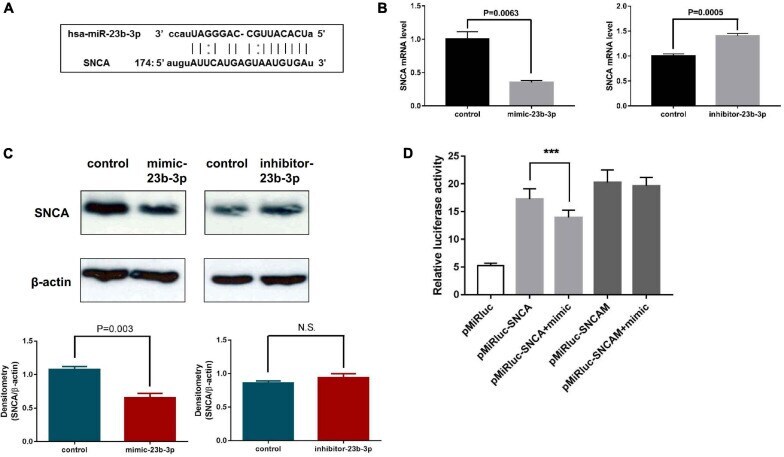
- FIGURE 5 miR-23b-3p, miR-30b-5p, and miR-195-3p coordinately regulate downstream PD-related target genes in NSCs. (A) Diagram showing the direct targeting of miR-23b-3p on the UTR of SNCA. (B) The mRNA levels of SNCA were examined in NSCs transfected with miR-23b-3p mimic (mimic-23b-3p) or inhibitor (inhibitor-23b-3p) by quantitative PCR. (C) The protein level of SNCA was examined in NSCs transfected with miR-23b-3p mimic (mimic-23b-3p) or miR-23b-3p inhibitor (inhibitor-23b-3p) by Western blotting using antibody against SNCA. (D) The luciferase activity of HEK293 cells transfected with pMiRluc-SNCA or pMiRluc-SNCAM (mutation in the miRNA targeting site) together with mimic-control (pMiRluc-SNCA) or mimic-23b-3p (pMiRluc-SNCA+mimic). After incubation overnight, the relative luciferase activity was measured and normalized to the Renilla activity. ***means statistically P
- Submitted by
- Invitrogen Antibodies (provider)
- Main image
- Experimental details
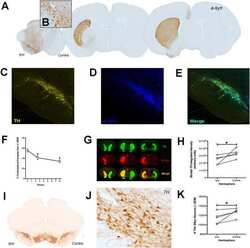
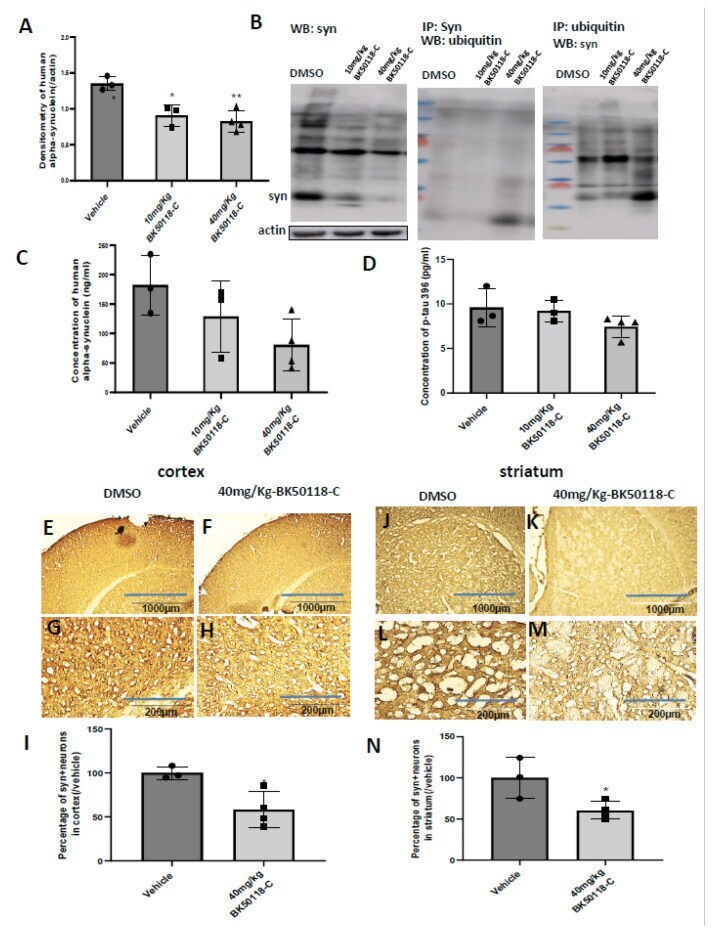
- Figure 4 BK50118-C significantly reduced alpha-synuclein but not p-tau levels in TgA53T mice. Male and female TgA53T mice were treated with intraperitoneal injection of vehicle or BK50118-C at the daily dosage of 10 mg/Kg or 40 mg/Kg for 7 days. WB of midbrain lysates showing ( A ) the levels of alpha-synuclein relative to actin on 4-12% SDS-NuPAGE gel in the above mice. ( B ) The first blot is the WB densitometry. The 2nd and 3rd blots are IP alpha-synuclein (syn) or ubiquitin. ELISA showing ( C ) the levels of alpha-synuclein and ( D ) ptau396 following BK50118-C treatment. Asterisks indicate statistic significant difference * p < 0.05 or ** p < 0.01 vs. corresponding vehicle. Ordinary one-way ANOVA was used for the analysis. N = 3-4 mice per group. DAB +Nissl staining. C significantly reduced alpha-synuclein levels in cortex ( F / H ) and striatum ( K / M ) compared to the corresponding vehicles ( E / G ) or ( J / L ) , verified by the quantification of alpha-synuclein positive cells in cortex ( I ) and striatum ( N ). Two-tailed student t test was used for analysis, and * indicates p < 0.05 vs. vehicle. N = 3-4 per group. All values presented as Mean +- SD. Scale bars: 100 um ( E , F , J , K ) or 200 um ( G , H , L , M ).
- Submitted by
- Invitrogen Antibodies (provider)
- Main image
- Experimental details
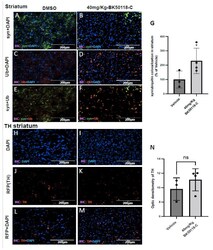
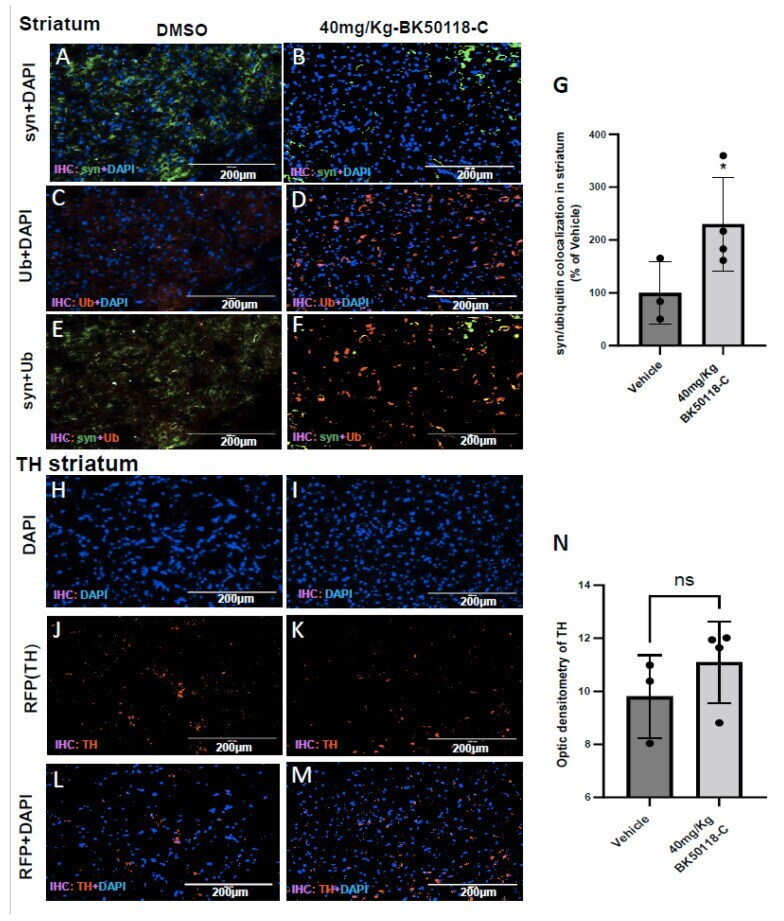
- Figure 5 BK50118-C significantly increased alpha-synuclein ubiquitination but had minimal effects on tyrosine hydroxylase (TH) levels in striatum of TgA53T mice. Male and female TgA53T mice were treated with intraperitoneal injection of vehicle or BK50118-C at the daily dosage of 40 mg/Kg for 7 days. Immunochemistry assay of 20 um thick brain sections showed alpha-synuclein (green), ubiquitination (red) and DAPI (blue) staining in the striatum of TgA53T mice treated with either DMSO ( A , C , E ) or BK50118-C ( B , D , F ). BK50118-C increased alpha-synuclein ubiquitination, verified by optic density of co-localization ( G ). Immunostaining showed TH (red) and DAPI (blue) staining in vehicle DMSO ( H , J , L ) and BK50118-C ( I , K , M ). BK50118-C had minimal effects on TH levels in striatum, verified by quantification of optic density ( N ). Asterisk indicates statistic significant difference * p < 0.05; two-tailed student's t test was used for analysis. N = 3-4 mice per group. All values presented as Mean +- SD. Scale bars: 200 um.
- Submitted by
- Invitrogen Antibodies (provider)
- Main image

- Experimental details
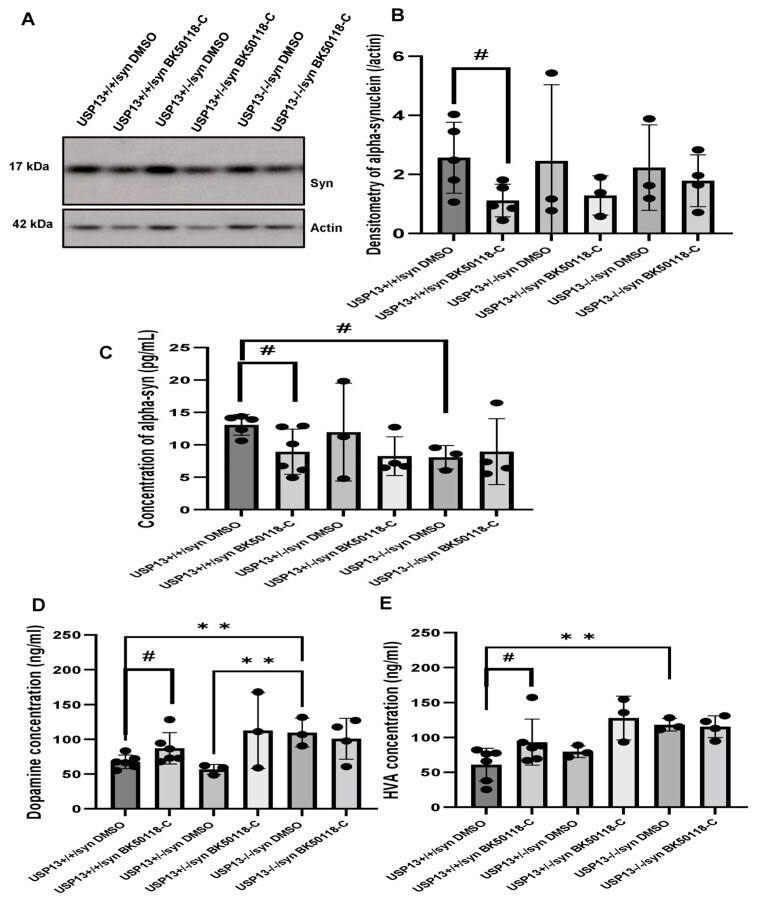
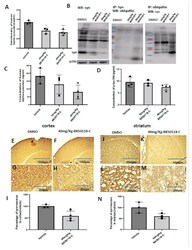
- Figure 5 BK50118-C reduces alpha-synuclein and protects against dopamine loss in USP13 +/+ , but not USP +/- or USP13 -/- brain. WB of STEN (soluble) midbrain extracts of ( A ) USP13 +/+ , USP +/- and USP13 -/- mice, which were injected with lentiviral alpha-synuclein into SN and treated with BK50118-C or DMSO showing alpha-synuclein (17 kD) level relative to actin (42 kD) on 4-12% Criterion(tm) XT Bis-Tris Protein Gel, and ( B ) alpha-synuclein densitometry. ELISA measuring levels of ( C ) human alpha-synuclein ( D ) dopamine, and ( E ) HVA in same brain extracts. The asterisk indicates statistically significant difference. One-way ANOVA ** p < 0.01. Two tailed Student's t test, and non parametric tests # p < 0.05. n = 3-6 per group. Mean +- SD. The black dot * represents each individual data.