Antibody data
- Antibody Data
- Antigen structure
- References [55]
- Comments [0]
- Validations
- Flow cytometry [2]
- Other assay [49]
Submit
Validation data
Reference
Comment
Report error
- Product number
- 11-0495-80 - Provider product page

- Provider
- Invitrogen Antibodies
- Product name
- CD49f (Integrin alpha 6) Monoclonal Antibody (eBioGoH3 (GoH3)), FITC, eBioscience™
- Antibody type
- Monoclonal
- Antigen
- Other
- Description
- Description: The eBioGoH3 monoclonal antibody reacts with mouse and human CD49f, also known as integrin alpha 6, very late activation antigen 6 (VLA-6 alpha chain), and platelet gpIc. CD49f is a 120 kD transmembrane protein. CD49f associates with CD29, the integrin beta 1 chain, to form the VLA-6 complex; CD49f also associates with CD104, the integrin beta 4 chain, to form the alpha 6 beta 4 complex. CD49f is expressed primarily on T cells, monocytes, platelets, epithelial and endothelial cells. CD49f expression has also been found on germinal center B cells. The eBioGoH3 antibody is cross-reactive to integrin alpha 6 on human, mouse and bovine cells. This antibody has also been reported to have functional activity in blocking the binding of integrin alpha 6 to laminin. Applications Reported: This GoH3 antibody has been reported for use in flow cytometric analysis. Applications Tested: This eBioGoH3 (GoH3) antibody has been tested by flow cytometric analysis of normal human peripheral blood cells. This can be used at less than or equal to 0.25 µg per test. A test is defined as the amount (µg) of antibody that will stain a cell sample in a final volume of 100 µL. Cell number should be determined empirically but can range from 10^5 to 10^8 cells/test. It is recommended that the antibody be carefully titrated for optimal performance in the assay of interest. Excitation: 488 nm; Emission: 520 nm; Laser: Blue Laser. Filtration: 0.2 µm post-manufacturing filtered.
- Reactivity
- Human, Mouse
- Host
- Rat
- Conjugate
- Green dye
- Isotype
- IgG
- Antibody clone number
- eBioGoH3 (GoH3)
- Vial size
- 25 μg
- Concentration
- 0.5 mg/mL
- Storage
- 4°C, store in dark, DO NOT FREEZE!
Submitted references Ablating Lgr5-expressing prostatic stromal cells activates the ERK-mediated mechanosensory signaling and disrupts prostate tissue homeostasis.
The Effect of Infant Gastric Digestion on Human Maternal Milk Cells.
Tumor suppressor DEAR1 regulates mammary epithelial cell fate and predicts early onset and metastasis in triple negative breast cancer.
Embigin is a fibronectin receptor that affects sebaceous gland differentiation and metabolism.
Isolation and characterization mesenchymal stem cells from red panda (Ailurus fulgens styani) endometrium.
ROR2 regulates self-renewal and maintenance of hair follicle stem cells.
Generation of human tonsil epithelial organoids as an ex vivo model for SARS-CoV-2 infection.
GRHL3 activates FSCN1 to relax cell-cell adhesions between migrating keratinocytes during wound reepithelialization.
Generation and functional characterization of murine mammary organoids.
Single-cell analyses unravel cell type-specific responses to a vitamin D analog in prostatic precancerous lesions.
Endogenous retroviruses promote homeostatic and inflammatory responses to the microbiota.
CBP-mediated Wnt3a/β-catenin signaling promotes cervical oncogenesis initiated by Piwil2.
Induced Pluripotent Stem Cells Derived From Two Idiopathic Azoospermia Patients Display Compromised Differentiation Potential for Primordial Germ Cell Fate.
Polyisocyanide Hydrogels as a Tunable Platform for Mammary Gland Organoid Formation.
Discrete populations of isotype-switched memory B lymphocytes are maintained in murine spleen and bone marrow.
Chronic expression of p16(INK4a) in the epidermis induces Wnt-mediated hyperplasia and promotes tumor initiation.
Evolutionarily conserved sequence motif analysis guides development of chemically defined hydrogels for therapeutic vascularization.
Chemotherapeutic Stress Influences Epithelial-Mesenchymal Transition and Stemness in Cancer Stem Cells of Triple-Negative Breast Cancer.
An IFT20 mechanotrafficking axis is required for integrin recycling, focal adhesion dynamics, and polarized cell migration.
Nov/CCN3 Enhances Cord Blood Engraftment by Rapidly Recruiting Latent Human Stem Cell Activity.
Regulatory T Cells Control the Switch From in situ to Invasive Breast Cancer.
Comprehensive Cell Surface Antigen Analysis Identifies Transferrin Receptor Protein-1 (CD71) as a Negative Selection Marker for Human Neuronal Cells.
The MMTV-Wnt1 murine model produces two phenotypically distinct subtypes of mammary tumors with unique therapeutic responses to an EGFR inhibitor.
A basal-enriched microRNA is required for prostate tumorigenesis in a Pten knockout mouse model.
Integrin-Rac signalling for mammary epithelial stem cell self-renewal.
Ubiquitin ligase RNF8 suppresses Notch signaling to regulate mammary development and tumorigenesis.
Profiling human breast epithelial cells using single cell RNA sequencing identifies cell diversity.
The hypoxic tumor microenvironment in vivo selects the cancer stem cell fate of breast cancer cells.
Single-Cell Analysis Identifies LY6D as a Marker Linking Castration-Resistant Prostate Luminal Cells to Prostate Progenitors and Cancer.
Inflammatory memory sensitizes skin epithelial stem cells to tissue damage.
Defining stem cell dynamics and migration during wound healing in mouse skin epidermis.
Regulatory T Cells in Skin Facilitate Epithelial Stem Cell Differentiation.
Hair follicle stem cell cultures reveal self-organizing plasticity of stem cells and their progeny.
Induced p53 loss in mouse luminal cells causes clonal expansion and development of mammary tumours.
Low Testosterone Alters the Activity of Mouse Prostate Stem Cells.
Autoreactive T Cells and Chronic Fungal Infection Drive Esophageal Carcinogenesis.
Llgl1 prevents metaplastic survival driven by epidermal growth factor dependent migration.
Yap1 promotes the survival and self-renewal of breast tumor initiating cells via inhibiting Smad3 signaling.
Characterization of the CD49f+/CD44+/CD24- single-cell derived stem cell population in basal-like DCIS cells.
Inhibition of the glucocorticoid receptor results in an enhanced miR-99a/100-mediated radiation response in stem-like cells from human prostate cancers.
Directed elimination of senescent cells by inhibition of BCL-W and BCL-XL.
Merlin Isoforms 1 and 2 Both Act as Tumour Suppressors and Are Required for Optimal Sperm Maturation.
The Transcriptional Repressor ZNF503/Zeppo2 Promotes Mammary Epithelial Cell Proliferation and Enhances Cell Invasion.
SF3B1 mutant MDS-initiating cells may arise from the haematopoietic stem cell compartment.
FGF ligands of the postnatal mammary stroma regulate distinct aspects of epithelial morphogenesis.
NDY1/KDM2B functions as a master regulator of polycomb complexes and controls self-renewal of breast cancer stem cells.
Highly upregulated Lhx2 in the Foxn1-/- nude mouse phenotype reflects a dysregulated and expanded epidermal stem cell niche.
Distinct effects of EGFR ligands on human mammary epithelial cell differentiation.
Evidence for a multipotent mammary progenitor with pregnancy-specific activity.
Generation of a novel germline stem cell line expressing a germline-specific reporter in the mouse.
GATA3 suppresses metastasis and modulates the tumour microenvironment by regulating microRNA-29b expression.
Stem-like epithelial cells are concentrated in the distal end of the fallopian tube: a site for injury and serous cancer initiation.
Alpha6-integrin is expressed on germinal centre B cells and modifies growth of a B-cell line.
Antibody to integrin alpha 6 subunit specifically inhibits cell-binding to laminin fragment 8.
Development of mouse mammary gland: identification of stages in differentiation of luminal and myoepithelial cells using monoclonal antibodies and polyvalent antiserum against keratin.
Wei X, Zhang L, Zhang Y, Cooper C, Brewer C, Tsai CF, Wang YT, Glaz M, Wessells HB, Que J, Titus MA, Cirulli V, Glaser A, Liu T, Reder NP, Creighton CJ, Xin L
Cell reports 2022 Sep 6;40(10):111313
Cell reports 2022 Sep 6;40(10):111313
The Effect of Infant Gastric Digestion on Human Maternal Milk Cells.
Doerfler R, Melamed JR, Whitehead KA
Molecular nutrition & food research 2022 Oct;66(19):e2200090
Molecular nutrition & food research 2022 Oct;66(19):e2200090
Tumor suppressor DEAR1 regulates mammary epithelial cell fate and predicts early onset and metastasis in triple negative breast cancer.
Le UQ, Chen N, Balasenthil S, Lurie E, Yang F, Liu S, Rubin L, Solis Soto LM, Raso MG, Batra H, Sahin AA, Wistuba II, Killary AM
Scientific reports 2022 Nov 14;12(1):19504
Scientific reports 2022 Nov 14;12(1):19504
Embigin is a fibronectin receptor that affects sebaceous gland differentiation and metabolism.
Sipilä K, Rognoni E, Jokinen J, Tewary M, Vietri Rudan M, Talvi S, Jokinen V, Dahlström KM, Liakath-Ali K, Mobasseri A, Du-Harpur X, Käpylä J, Nutt SL, Salminen TA, Heino J, Watt FM
Developmental cell 2022 Jun 20;57(12):1453-1465.e7
Developmental cell 2022 Jun 20;57(12):1453-1465.e7
Isolation and characterization mesenchymal stem cells from red panda (Ailurus fulgens styani) endometrium.
Wang DH, Wu XM, Chen JS, Cai ZG, An JH, Zhang MY, Li Y, Li FP, Hou R, Liu YL
Conservation physiology 2022 Jan 1;10(1):coac004
Conservation physiology 2022 Jan 1;10(1):coac004
ROR2 regulates self-renewal and maintenance of hair follicle stem cells.
Veltri A, Lang CMR, Cangiotti G, Chan CK, Lien WH
Nature communications 2022 Aug 1;13(1):4449
Nature communications 2022 Aug 1;13(1):4449
Generation of human tonsil epithelial organoids as an ex vivo model for SARS-CoV-2 infection.
Kim HK, Kim H, Lee MK, Choi WH, Jang Y, Shin JS, Park JY, Bae DH, Hyun SI, Kim KH, Han HW, Lim B, Choi G, Kim M, Chang Lim Y, Yoo J
Biomaterials 2022 Apr;283:121460
Biomaterials 2022 Apr;283:121460
GRHL3 activates FSCN1 to relax cell-cell adhesions between migrating keratinocytes during wound reepithelialization.
Kashgari G, Venkatesh S, Refuerzo S, Pham B, Bayat A, Klein RH, Ramos R, Ta AP, Plikus MV, Wang PH, Andersen B
JCI insight 2021 Sep 8;6(17)
JCI insight 2021 Sep 8;6(17)
Generation and functional characterization of murine mammary organoids.
Yip HYK, Papa A
STAR protocols 2021 Sep 17;2(3):100765
STAR protocols 2021 Sep 17;2(3):100765
Single-cell analyses unravel cell type-specific responses to a vitamin D analog in prostatic precancerous lesions.
Abu El Maaty MA, Grelet E, Keime C, Rerra AI, Gantzer J, Emprou C, Terzic J, Lutzing R, Bornert JM, Laverny G, Metzger D
Science advances 2021 Jul;7(31)
Science advances 2021 Jul;7(31)
Endogenous retroviruses promote homeostatic and inflammatory responses to the microbiota.
Lima-Junior DS, Krishnamurthy SR, Bouladoux N, Collins N, Han SJ, Chen EY, Constantinides MG, Link VM, Lim AI, Enamorado M, Cataisson C, Gil L, Rao I, Farley TK, Koroleva G, Attig J, Yuspa SH, Fischbach MA, Kassiotis G, Belkaid Y
Cell 2021 Jul 8;184(14):3794-3811.e19
Cell 2021 Jul 8;184(14):3794-3811.e19
CBP-mediated Wnt3a/β-catenin signaling promotes cervical oncogenesis initiated by Piwil2.
Feng D, Yan K, Liang H, Liang J, Wang W, Yu H, Zhou Y, Zhao W, Dong Z, Ling B
Neoplasia (New York, N.Y.) 2021 Jan;23(1):1-11
Neoplasia (New York, N.Y.) 2021 Jan;23(1):1-11
Induced Pluripotent Stem Cells Derived From Two Idiopathic Azoospermia Patients Display Compromised Differentiation Potential for Primordial Germ Cell Fate.
Fang F, Li Z, Zhao Q, Ye Z, Gu X, Pan F, Li H, Xiang W, Xiong C
Frontiers in cell and developmental biology 2020;8:432
Frontiers in cell and developmental biology 2020;8:432
Polyisocyanide Hydrogels as a Tunable Platform for Mammary Gland Organoid Formation.
Zhang Y, Tang C, Span PN, Rowan AE, Aalders TW, Schalken JA, Adema GJ, Kouwer PHJ, Zegers MMP, Ansems M
Advanced science (Weinheim, Baden-Wurttemberg, Germany) 2020 Sep;7(18):2001797
Advanced science (Weinheim, Baden-Wurttemberg, Germany) 2020 Sep;7(18):2001797
Discrete populations of isotype-switched memory B lymphocytes are maintained in murine spleen and bone marrow.
Riedel R, Addo R, Ferreira-Gomes M, Heinz GA, Heinrich F, Kummer J, Greiff V, Schulz D, Klaeden C, Cornelis R, Menzel U, Kröger S, Stervbo U, Köhler R, Haftmann C, Kühnel S, Lehmann K, Maschmeyer P, McGrath M, Naundorf S, Hahne S, Sercan-Alp Ö, Siracusa F, Stefanowski J, Weber M, Westendorf K, Zimmermann J, Hauser AE, Reddy ST, Durek P, Chang HD, Mashreghi MF, Radbruch A
Nature communications 2020 May 22;11(1):2570
Nature communications 2020 May 22;11(1):2570
Chronic expression of p16(INK4a) in the epidermis induces Wnt-mediated hyperplasia and promotes tumor initiation.
Azazmeh N, Assouline B, Winter E, Ruppo S, Nevo Y, Maly A, Meir K, Witkiewicz AK, Cohen J, Rizou SV, Pikarsky E, Luxenburg C, Gorgoulis VG, Ben-Porath I
Nature communications 2020 Jun 1;11(1):2711
Nature communications 2020 Jun 1;11(1):2711
Evolutionarily conserved sequence motif analysis guides development of chemically defined hydrogels for therapeutic vascularization.
Jia J, Jeon EJ, Li M, Richards DJ, Lee S, Jung Y, Barrs RW, Coyle R, Li X, Chou JC, Yost MJ, Gerecht S, Cho SW, Mei Y
Science advances 2020 Jul;6(28):eaaz5894
Science advances 2020 Jul;6(28):eaaz5894
Chemotherapeutic Stress Influences Epithelial-Mesenchymal Transition and Stemness in Cancer Stem Cells of Triple-Negative Breast Cancer.
Li X, Strietz J, Bleilevens A, Stickeler E, Maurer J
International journal of molecular sciences 2020 Jan 8;21(2)
International journal of molecular sciences 2020 Jan 8;21(2)
An IFT20 mechanotrafficking axis is required for integrin recycling, focal adhesion dynamics, and polarized cell migration.
Su S, Begum S, Ezratty EJ
Molecular biology of the cell 2020 Aug 1;31(17):1917-1930
Molecular biology of the cell 2020 Aug 1;31(17):1917-1930
Nov/CCN3 Enhances Cord Blood Engraftment by Rapidly Recruiting Latent Human Stem Cell Activity.
Gupta R, Turati V, Brian D, Thrussel C, Wilbourn B, May G, Enver T
Cell stem cell 2020 Apr 2;26(4):527-541.e8
Cell stem cell 2020 Apr 2;26(4):527-541.e8
Regulatory T Cells Control the Switch From in situ to Invasive Breast Cancer.
Martinez LM, Robila V, Clark NM, Du W, Idowu MO, Rutkowski MR, Bos PD
Frontiers in immunology 2019;10:1942
Frontiers in immunology 2019;10:1942
Comprehensive Cell Surface Antigen Analysis Identifies Transferrin Receptor Protein-1 (CD71) as a Negative Selection Marker for Human Neuronal Cells.
Menon V, Thomas R, Elgueta C, Horl M, Osborn T, Hallett PJ, Bartos M, Isacson O, Pruszak J
Stem cells (Dayton, Ohio) 2019 Oct;37(10):1293-1306
Stem cells (Dayton, Ohio) 2019 Oct;37(10):1293-1306
The MMTV-Wnt1 murine model produces two phenotypically distinct subtypes of mammary tumors with unique therapeutic responses to an EGFR inhibitor.
Pfefferle AD, Darr DB, Calhoun BC, Mott KR, Rosen JM, Perou CM
Disease models & mechanisms 2019 Jul 5;12(7)
Disease models & mechanisms 2019 Jul 5;12(7)
A basal-enriched microRNA is required for prostate tumorigenesis in a Pten knockout mouse model.
Fan X, Bjerke GA, Riemondy K, Wang L, Yi R
Molecular carcinogenesis 2019 Dec;58(12):2241-2253
Molecular carcinogenesis 2019 Dec;58(12):2241-2253
Integrin-Rac signalling for mammary epithelial stem cell self-renewal.
Olabi S, Ucar A, Brennan K, Streuli CH
Breast cancer research : BCR 2018 Oct 22;20(1):128
Breast cancer research : BCR 2018 Oct 22;20(1):128
Ubiquitin ligase RNF8 suppresses Notch signaling to regulate mammary development and tumorigenesis.
Li L, Guturi KKN, Gautreau B, Patel PS, Saad A, Morii M, Mateo F, Palomero L, Barbour H, Gomez A, Ng D, Kotlyar M, Pastrello C, Jackson HW, Khokha R, Jurisica I, Affar EB, Raught B, Sanchez O, Alaoui-Jamali M, Pujana MA, Hakem A, Hakem R
The Journal of clinical investigation 2018 Oct 1;128(10):4525-4542
The Journal of clinical investigation 2018 Oct 1;128(10):4525-4542
Profiling human breast epithelial cells using single cell RNA sequencing identifies cell diversity.
Nguyen QH, Pervolarakis N, Blake K, Ma D, Davis RT, James N, Phung AT, Willey E, Kumar R, Jabart E, Driver I, Rock J, Goga A, Khan SA, Lawson DA, Werb Z, Kessenbrock K
Nature communications 2018 May 23;9(1):2028
Nature communications 2018 May 23;9(1):2028
The hypoxic tumor microenvironment in vivo selects the cancer stem cell fate of breast cancer cells.
Kim H, Lin Q, Glazer PM, Yun Z
Breast cancer research : BCR 2018 Mar 6;20(1):16
Breast cancer research : BCR 2018 Mar 6;20(1):16
Single-Cell Analysis Identifies LY6D as a Marker Linking Castration-Resistant Prostate Luminal Cells to Prostate Progenitors and Cancer.
Barros-Silva JD, Linn DE, Steiner I, Guo G, Ali A, Pakula H, Ashton G, Peset I, Brown M, Clarke NW, Bronson RT, Yuan GC, Orkin SH, Li Z, Baena E
Cell reports 2018 Dec 18;25(12):3504-3518.e6
Cell reports 2018 Dec 18;25(12):3504-3518.e6
Inflammatory memory sensitizes skin epithelial stem cells to tissue damage.
Naik S, Larsen SB, Gomez NC, Alaverdyan K, Sendoel A, Yuan S, Polak L, Kulukian A, Chai S, Fuchs E
Nature 2017 Oct 26;550(7677):475-480
Nature 2017 Oct 26;550(7677):475-480
Defining stem cell dynamics and migration during wound healing in mouse skin epidermis.
Aragona M, Dekoninck S, Rulands S, Lenglez S, Mascré G, Simons BD, Blanpain C
Nature communications 2017 Mar 1;8:14684
Nature communications 2017 Mar 1;8:14684
Regulatory T Cells in Skin Facilitate Epithelial Stem Cell Differentiation.
Ali N, Zirak B, Rodriguez RS, Pauli ML, Truong HA, Lai K, Ahn R, Corbin K, Lowe MM, Scharschmidt TC, Taravati K, Tan MR, Ricardo-Gonzalez RR, Nosbaum A, Bertolini M, Liao W, Nestle FO, Paus R, Cotsarelis G, Abbas AK, Rosenblum MD
Cell 2017 Jun 1;169(6):1119-1129.e11
Cell 2017 Jun 1;169(6):1119-1129.e11
Hair follicle stem cell cultures reveal self-organizing plasticity of stem cells and their progeny.
Chacón-Martínez CA, Klose M, Niemann C, Glauche I, Wickström SA
The EMBO journal 2017 Jan 17;36(2):151-164
The EMBO journal 2017 Jan 17;36(2):151-164
Induced p53 loss in mouse luminal cells causes clonal expansion and development of mammary tumours.
Tao L, Xiang D, Xie Y, Bronson RT, Li Z
Nature communications 2017 Feb 13;8:14431
Nature communications 2017 Feb 13;8:14431
Low Testosterone Alters the Activity of Mouse Prostate Stem Cells.
Zhou Y, Copeland B, Otto-Duessel M, He M, Markel S, Synold TW, Jones JO
The Prostate 2017 Apr;77(5):530-541
The Prostate 2017 Apr;77(5):530-541
Autoreactive T Cells and Chronic Fungal Infection Drive Esophageal Carcinogenesis.
Zhu F, Willette-Brown J, Song NY, Lomada D, Song Y, Xue L, Gray Z, Zhao Z, Davis SR, Sun Z, Zhang P, Wu X, Zhan Q, Richie ER, Hu Y
Cell host & microbe 2017 Apr 12;21(4):478-493.e7
Cell host & microbe 2017 Apr 12;21(4):478-493.e7
Llgl1 prevents metaplastic survival driven by epidermal growth factor dependent migration.
Greenwood E, Maisel S, Ebertz D, Russ A, Pandey R, Schroeder J
Oncotarget 2016 Sep 20;7(38):60776-60792
Oncotarget 2016 Sep 20;7(38):60776-60792
Yap1 promotes the survival and self-renewal of breast tumor initiating cells via inhibiting Smad3 signaling.
Sun JG, Chen XW, Zhang LP, Wang J, Diehn M
Oncotarget 2016 Mar 1;7(9):9692-706
Oncotarget 2016 Mar 1;7(9):9692-706
Characterization of the CD49f+/CD44+/CD24- single-cell derived stem cell population in basal-like DCIS cells.
Duru N, Gernapudi R, Lo PK, Yao Y, Wolfson B, Zhang Y, Zhou Q
Oncotarget 2016 Jul 26;7(30):47511-47525
Oncotarget 2016 Jul 26;7(30):47511-47525
Inhibition of the glucocorticoid receptor results in an enhanced miR-99a/100-mediated radiation response in stem-like cells from human prostate cancers.
Rane JK, Erb HH, Nappo G, Mann VM, Simms MS, Collins AT, Visakorpi T, Maitland NJ
Oncotarget 2016 Aug 9;7(32):51965-51980
Oncotarget 2016 Aug 9;7(32):51965-51980
Directed elimination of senescent cells by inhibition of BCL-W and BCL-XL.
Yosef R, Pilpel N, Tokarsky-Amiel R, Biran A, Ovadya Y, Cohen S, Vadai E, Dassa L, Shahar E, Condiotti R, Ben-Porath I, Krizhanovsky V
Nature communications 2016 Apr 6;7:11190
Nature communications 2016 Apr 6;7:11190
Merlin Isoforms 1 and 2 Both Act as Tumour Suppressors and Are Required for Optimal Sperm Maturation.
Zoch A, Mayerl S, Schulz A, Greither T, Frappart L, Rübsam J, Heuer H, Giovannini M, Morrison H
PloS one 2015;10(8):e0129151
PloS one 2015;10(8):e0129151
The Transcriptional Repressor ZNF503/Zeppo2 Promotes Mammary Epithelial Cell Proliferation and Enhances Cell Invasion.
Shahi P, Slorach EM, Wang CY, Chou J, Lu A, Ruderisch A, Werb Z
The Journal of biological chemistry 2015 Feb 6;290(6):3803-13
The Journal of biological chemistry 2015 Feb 6;290(6):3803-13
SF3B1 mutant MDS-initiating cells may arise from the haematopoietic stem cell compartment.
Mian SA, Rouault-Pierre K, Smith AE, Seidl T, Pizzitola I, Kizilors A, Kulasekararaj AG, Bonnet D, Mufti GJ
Nature communications 2015 Dec 8;6:10004
Nature communications 2015 Dec 8;6:10004
FGF ligands of the postnatal mammary stroma regulate distinct aspects of epithelial morphogenesis.
Zhang X, Martinez D, Koledova Z, Qiao G, Streuli CH, Lu P
Development (Cambridge, England) 2014 Sep;141(17):3352-62
Development (Cambridge, England) 2014 Sep;141(17):3352-62
NDY1/KDM2B functions as a master regulator of polycomb complexes and controls self-renewal of breast cancer stem cells.
Kottakis F, Foltopoulou P, Sanidas I, Keller P, Wronski A, Dake BT, Ezell SA, Shen Z, Naber SP, Hinds PW, McNiel E, Kuperwasser C, Tsichlis PN
Cancer research 2014 Jul 15;74(14):3935-46
Cancer research 2014 Jul 15;74(14):3935-46
Highly upregulated Lhx2 in the Foxn1-/- nude mouse phenotype reflects a dysregulated and expanded epidermal stem cell niche.
Bohr S, Patel SJ, Vasko R, Shen K, Huang G, Yarmush ML, Berthiaume F
PloS one 2013;8(5):e64223
PloS one 2013;8(5):e64223
Distinct effects of EGFR ligands on human mammary epithelial cell differentiation.
Mukhopadhyay C, Zhao X, Maroni D, Band V, Naramura M
PloS one 2013;8(10):e75907
PloS one 2013;8(10):e75907
Evidence for a multipotent mammary progenitor with pregnancy-specific activity.
Kaanta AS, Virtanen C, Selfors LM, Brugge JS, Neel BG
Breast cancer research : BCR 2013;15(4):R65
Breast cancer research : BCR 2013;15(4):R65
Generation of a novel germline stem cell line expressing a germline-specific reporter in the mouse.
Shiura H, Ikeda R, Lee J, Sato T, Ogonuki N, Hirose M, Ogura A, Ogawa T, Abe K
Genesis (New York, N.Y. : 2000) 2013 Jul;51(7):498-505
Genesis (New York, N.Y. : 2000) 2013 Jul;51(7):498-505
GATA3 suppresses metastasis and modulates the tumour microenvironment by regulating microRNA-29b expression.
Chou J, Lin JH, Brenot A, Kim JW, Provot S, Werb Z
Nature cell biology 2013 Feb;15(2):201-13
Nature cell biology 2013 Feb;15(2):201-13
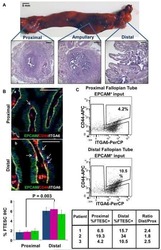
Stem-like epithelial cells are concentrated in the distal end of the fallopian tube: a site for injury and serous cancer initiation.
Paik DY, Janzen DM, Schafenacker AM, Velasco VS, Shung MS, Cheng D, Huang J, Witte ON, Memarzadeh S
Stem cells (Dayton, Ohio) 2012 Nov;30(11):2487-97
Stem cells (Dayton, Ohio) 2012 Nov;30(11):2487-97
Alpha6-integrin is expressed on germinal centre B cells and modifies growth of a B-cell line.
Ambrose HE, Wagner SD
Immunology 2004 Apr;111(4):400-6
Immunology 2004 Apr;111(4):400-6
Antibody to integrin alpha 6 subunit specifically inhibits cell-binding to laminin fragment 8.
Aumailley M, Timpl R, Sonnenberg A
Experimental cell research 1990 May;188(1):55-60
Experimental cell research 1990 May;188(1):55-60
Development of mouse mammary gland: identification of stages in differentiation of luminal and myoepithelial cells using monoclonal antibodies and polyvalent antiserum against keratin.
Sonnenberg A, Daams H, Van der Valk MA, Hilkens J, Hilgers J
The journal of histochemistry and cytochemistry : official journal of the Histochemistry Society 1986 Aug;34(8):1037-46
The journal of histochemistry and cytochemistry : official journal of the Histochemistry Society 1986 Aug;34(8):1037-46
No comments: Submit comment
Supportive validation
- Submitted by
- Invitrogen Antibodies (provider)
- Main image
- Experimental details
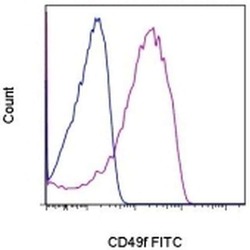
- Staining of normal human peripheral blood cells with 0.125 µg of Rat IgG2a K Isotype Control FITC (Product # 11-4321-42) (blue histogram) or 0.125 µg of Anti-Human/Mouse CD49f (Integrin alpha 6) FITC (purple histogram). Cells in the lymphocyte gate were used for analysis.
- Conjugate
- Green dye
- Submitted by
- Invitrogen Antibodies (provider)
- Main image
- Experimental details
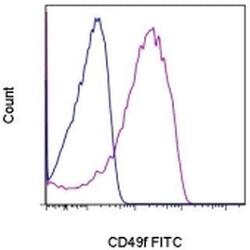
- Staining of normal human peripheral blood cells with 0.125 µg of Rat IgG2a K Isotype Control FITC (Product # 11-4321-42) (blue histogram) or 0.125 µg of Anti-Human/Mouse CD49f (Integrin alpha 6) FITC (purple histogram). Cells in the lymphocyte gate were used for analysis.
Supportive validation
- Submitted by
- Invitrogen Antibodies (provider)
- Main image
- Experimental details
- NULL
- Conjugate
- Green dye
- Submitted by
- Invitrogen Antibodies (provider)
- Main image
- Experimental details
- NULL
- Conjugate
- Green dye
- Submitted by
- Invitrogen Antibodies (provider)
- Main image

- Experimental details
- NULL
- Conjugate
- Green dye
- Submitted by
- Invitrogen Antibodies (provider)
- Main image
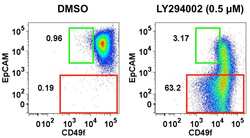
- Experimental details
- NULL
- Conjugate
- Green dye
- Submitted by
- Invitrogen Antibodies (provider)
- Main image
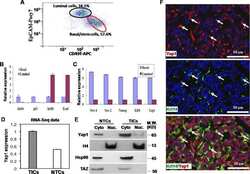
- Experimental details
- NULL
- Conjugate
- Green dye
- Submitted by
- Invitrogen Antibodies (provider)
- Main image
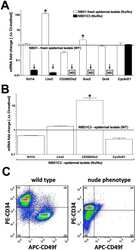
- Experimental details
- NULL
- Conjugate
- Green dye
- Submitted by
- Invitrogen Antibodies (provider)
- Main image
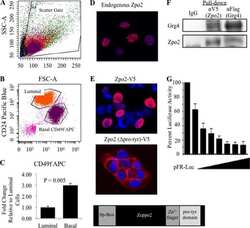
- Experimental details
- NULL
- Conjugate
- Green dye
- Submitted by
- Invitrogen Antibodies (provider)
- Main image
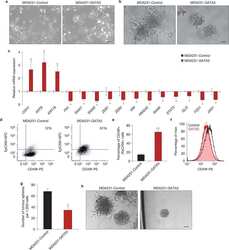
- Experimental details
- NULL
- Conjugate
- Green dye
- Submitted by
- Invitrogen Antibodies (provider)
- Main image
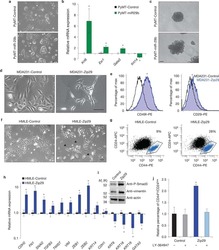
- Experimental details
- NULL
- Conjugate
- Green dye
- Submitted by
- Invitrogen Antibodies (provider)
- Main image
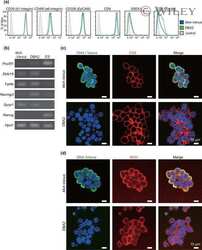
- Experimental details
- NULL
- Conjugate
- Green dye
- Submitted by
- Invitrogen Antibodies (provider)
- Main image
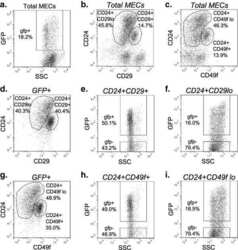
- Experimental details
- NULL
- Conjugate
- Green dye
- Submitted by
- Invitrogen Antibodies (provider)
- Main image
- Experimental details
- NULL
- Conjugate
- Green dye
- Submitted by
- Invitrogen Antibodies (provider)
- Main image
- Experimental details
- NULL
- Conjugate
- Green dye
- Submitted by
- Invitrogen Antibodies (provider)
- Main image
- Experimental details
- NULL
- Conjugate
- Green dye
- Submitted by
- Invitrogen Antibodies (provider)
- Main image
- Experimental details
- NULL
- Conjugate
- Green dye
- Submitted by
- Invitrogen Antibodies (provider)
- Main image
- Experimental details
- NULL
- Conjugate
- Green dye
- Submitted by
- Invitrogen Antibodies (provider)
- Main image
- Experimental details
- NULL
- Conjugate
- Green dye
- Submitted by
- Invitrogen Antibodies (provider)
- Main image
- Experimental details
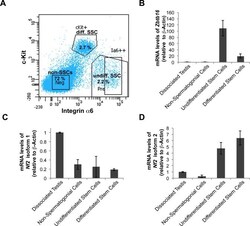
- Fig 4 Nf2 isoform 2 is enriched in spermatogonial stem cells. (A ) MACS pre-sorted EpCam + cells were FACS sorted according to Integrin alpha6 and c-Kit expression into non-spermatogonial cells (Integrin alpha6 - , c-Kit - ), undifferentiated spermatogonial stem cells (Integrin alpha6 + , c-Kit - ) and differentiated spermatogonial stem cells (Integrin alpha6 + , c-Kit + ). mRNAs of Zbtb16 , Nf2 isoform 1 and Nf2 isoform 2 were measured in the sorted cell fractions and whole testis lysates by qPCR and normalised to beta-actin ( Actb ) levels. (B) Stem cell marker Zbtb16 was highly enriched in the undifferentiated spermatogonia fraction. Analysis of Nf2 isoform 1 (C) and isoform 2 (D) mRNA in the sorted cell fractions revealed enrichment of isoform 2 and low isoform 1 expression in spermatogonial stem cells. Error bars in C, D and E denote SDs of technical replications of representative cell isolation.
- Conjugate
- Green dye
- Submitted by
- Invitrogen Antibodies (provider)
- Main image
- Experimental details
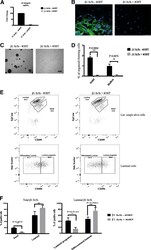
- Fig. 1 Loss of beta1-integrin leads to reduced organoid and luminal progenitor populations. a Primary mammary epithelial cells (MECs) were isolated from beta1-integrin fxfx ;CreESR mice and cultured as single cells to form organoids in the absence or presence of 4-hydroxytamoxifen (4-OHT). Gene expression levels were quantified using qRT-PCR. b Immunofluorescence staining of beta1-integrin fxfx cells cultured on collagen-coated coverslips for 3 days in the absence or presence of 4-OHT and then stained with antibodies against beta1-integrin and 4',6-diamidino-2-phenylindole as counterstain. Scale bar = 50 mum. c Representative images of organoid cultures on culture day 10. Spheres formed in the absence of 4-OHT; however, no spheres were present in cultures treated with 4-OHT, leading to the genetic deletion of beta1-integrin. Scale bar = 500 mum. d Percentage of organoid-forming cells within beta1-integrin fxfx cells with or without 4-OHT ( n = 4). Error bars = SEM (Student's t test for paired samples). e Basal, total luminal, luminal progenitor and differentiated luminal cell populations, stained for CD45, CD31, epithelial cell adhesion molecule (EpCAM), alpha6-integrin (CD49f) and alpha2-integrin (CD49b). The fluorescence-activated cell sorting diagrams show the reduction in basal and luminal progenitor populations in beta1-integrin- MECs (treated with 4-OHT). f Quantification of cell types from beta1-integrin fx/fx MECs in the absence or presence of 4-
- Conjugate
- Green dye
- Submitted by
- Invitrogen Antibodies (provider)
- Main image
- Experimental details
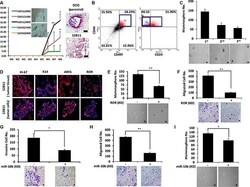
- Figure 7 Aggressive CD49f + /CD44 + /CD24 - single-cell derived clones show tumorigenesis in vivo ( A ) Athymc nude mice were injected with 2 x 10 5 , 1.5 x 10 5 and 1 x 10 5 of S2B11 cells and 2 x 10 5 and 1.5 x 10 5 of S2D10 cells. All mice that were injected with S2B11 cells formed tumors and none of the mice that were injected with S2D10 cells showed any tumor formation. The high expression level of K14 was confirmed in S2B11 tumors via IHC. H&E staining showed the more invasive nature of the S2B11 tumors. Bar scale represents 100 mum. Data represents the mean +-S.D ( n = 10); * p < 0.05, ** p < 0.01. ( B ) CD49f + /CD44 + /CD24 - stem cell-like subpopulation in S2B11 tumors was confirmed via FACS analysis showing that this subpopulation was consisting 13.6% of whole tumor cell population. ( C ) Mammosphere formation ability of the primary S2B11 tumor cells was evaluated for 3 generations showing their ability to self-renew. Bar scale represents 50 mum. Data represents the mean +- S.D. ( D ) Immunofluorescence staining shows a significant Ki-67, K14, ARF6 and RoR expression in the spheres formed by S2B11 primary tumor cells and in the tumor tissue itself. ( E , F ) Mammosphere formation ability (Bar scale represents 50 mum) (E) and migration capacity (Bar scale represents 25 mum) (F) was evaluated in S2B11 primary tumor cells after knocking-down the RoR with shRoR. Data represents the mean +-S.D ( n = 3); ** p < 0.01. ( G , H , I ) Invasion capacity (Bar scale represents
- Conjugate
- Green dye
- Submitted by
- Invitrogen Antibodies (provider)
- Main image
- Experimental details
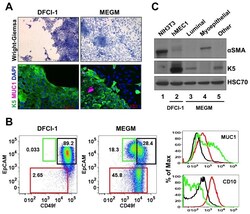
- Figure 1 In vitro differentiation of K5 + K19 - h TERT -immortalized mammary epithelial cells. Cells were either maintained under non-differentiating condition (DFCI-1 medium) or propagated under differentiation-promoting condition (MEGM medium containing 5 nM EGF) for three weeks and cell morphology and marker expressions were evaluated. Shown are representative results from more than 10 independent experiments with similar outcome. ( A ) Overall cell morphology was assessed by Wright-Giemsa staining (top panels) and K5 (green) and MUC1 (purple) expression was assessed by immunofluorescence microscopy (bottom panels). Nuclei were visualized with DAPI (blue). Red bars indicate 50 uM. ( B ) Expression of CD49f, EpCAM, MUC1 and CD10 was assessed by flow cytometry. Gates for CD49f lo EpCAM hi (luminal, green box), EpCAM lo (myoepithelial, red box) and CD49f hi EpCAM hi (undifferentiated, black box) cells are indicated. Histograms on the right indicate levels of MUC1 (luminal marker, top) and CD10 (myoepithelial marker, bottom) in cells propagated in MEGM medium. Green lines represent the levels of MUC1 (top) or CD10 (bottom) in the CD49f lo EpCAM hi (luminal) population, red lines are for the EpCAM lo (myoepithelial) population and black lines for the CD49f hi EpCAM hi (undifferentiated) population. ( C ) Expression of alpha-smooth muscle actin (alphaSMA) and K5 was assessed by immunoblotting. NIH3T3 cells (lane 1) were included as a positive control for alphaSMA. Lane 2: K5 + K
- Conjugate
- Green dye
- Submitted by
- Invitrogen Antibodies (provider)
- Main image
- Experimental details
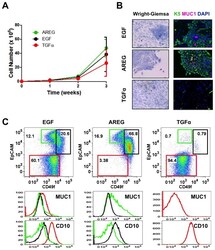
- Figure 2 Effects of various EGFR ligands on K5 + K19 - hMEC differentiation in MEGM medium. Cells were propagated in modified MEGM media where EGF was substituted with either AREG or TGFalpha and morphology and marker expressions were analyzed after three weeks. ( A ) Cell growth during differentiation. Two hundred thousand (2 x 10 5 ) K5 + K19 - hMECs were seeded in 60 mm dishes in modified MEGM media with indicated EGFR ligands. Cell numbers were determined every week. Shown are averages from 4 independent experiments. Error bars indicate standard errors. There was no statistically significant difference between groups in cell number at each time point by one-way ANOVA with Bonferroni multiple comparisons. ( B ) Overall cell morphology was assessed by Wright-Giemsa staining (left panels) and K5 (green) and MUC1 (purple) expression was assessed by immunofluorescence microscopy (right panels). Nuclei were visualized with DAPI (blue). Red bars indicate 50 uM. ( C ) Expression of CD49f, EpCAM, MUC1 and CD10 was analyzed by flow cytometry. Gates and percentages for CD49f lo EpCAM hi (luminal, green box), EpCAM lo (myoepithelial, red box) and CD49f hi EpCAM hi (undifferentiated, black box) populations are indicated in the top panels. Middle and bottom panels are histograms for MUC1 (middle) and CD10 (bottom). Green lines represent the levels of MUC1 (middle) or CD10 (bottom) in the CD49f lo EpCAM hi (luminal) population, red lines are for the EpCAM lo (myoepithelial) population a
- Conjugate
- Green dye
- Submitted by
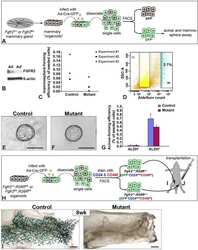
- Invitrogen Antibodies (provider)
- Main image
- Experimental details
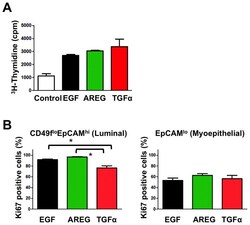
- Figure 3 All EGFR ligands support growth of K5 + K19 - hMECs before and after differentiation. ( A ) Undifferentiated K5 + K19 - hMECs were starved of serum/growth factors for 24 hours in D3 medium before being left unstimulated (Control) or stimulated with AREG, EGF or TGFalpha (all at 5 nM) for 24 hours. Cell growth was assessed by [ 3 H] thymidine incorporation for the last 6 hours of incubation. A representative result from 2 independent experiments run in triplicates is shown. Error bars indicate standard errors. ( B ) K5 + K19 - hMECs were propagated in MEGM medium (with EGF) to induce differentiation. Differentiated luminal (CD49f lo EpCAM hi ) and myoepithelial (EpCAM lo ) cells were separated by FACS and plated in modified MEGM medium containing either AREG, EGF or TGFalpha (all at 5 nM). The percentage of proliferating cells was assessed by the expression of Ki67. Each condition was run in 5 replicates. Error bars represent standard errors. The difference between EGF and TGFalpha, as well as that between AREG and TGFalpha in CD49f lo EpCAM hi cells was statistically significant at p
- Conjugate
- Green dye
- Submitted by
- Invitrogen Antibodies (provider)
- Main image
- Experimental details
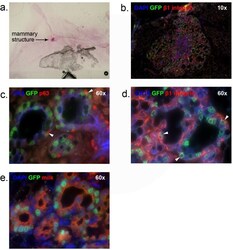
- Figure 4 In vivo outgrowth of H2BGFP + /CD24 + /CD29 lo cells. Outgrowths from H2BGFP + /CD24 + /CD29 lo cells were stained with Carmine Alum for whole-mount analysis, then sectioned and immunostained to analyze their epithelial origin and composition. (a) mammary fat pad whole mount (b) DAPI, GFP and beta1 integrin staining (c) CK8, GFP and p63 staining (d) CK14, GFP and beta1 integrin staining (e) DAPI, GFP and milk staining. Panel b, 10x magnification. Panels c-e, 60x magnification. Arrowheads indicate representative co-expressing cells. DAPI, 4',6-diamidino-2-phenylindole; GFP, green fluorescent protein; H2BGFP, histone 2B-eGFP.
- Conjugate
- Green dye
- Submitted by
- Invitrogen Antibodies (provider)
- Main image
- Experimental details
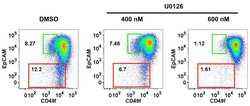
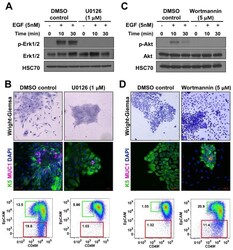
- Figure 5 MEK inhibitor blocks differentiation of K5 + K19 - hMECs. ( A ) Undifferentiated K5 + K19 - hMECs were starved of serum/growth factors for 48 hours in D3 medium, treated with 1 uM U0126 or vehicle (DMSO) alone for 4 hours before stimulation with 5 nM EGF for the indicated period. Cell lysate was analyzed by immunoblotting. ( B ) K5 + K19 - hMECs were propagated in MEGM medium (containing EGF) with or without 1 uM U0126 for three weeks. Medium was replaced every two days. Overall cell morphology was assessed by Wright-Giemsa staining (top panels) and K5 (green) and MUC1 (red) expression was assessed by immunofluorescence microscopy (middle panels). Nuclei were visualized with DAPI (blue). Red bars indicate 50 uM. Expression of CD49f and EpCAM was analyzed by flow cytometry (bottom panels). Gates and percentages for CD49f lo EpCAM hi (luminal, green box) and EpCAM lo (myoepithelial, red box) populations are indicated. Shown are representative results from 3 independent experiments. ( C ) Undifferentiated K5 + K19 - hMECs were starved of serum/growth factors for 48 hours in D3 medium, treated with 5 uM wortmannin or vehicle (DMSO) alone for 4 hours before stimulation with 5 nM EGF for the indicated period. Cell lysate was analyzed by immunoblotting. ( D ) K5 + K19 - hMECs were propagated in MEGM medium (containing EGF) with or without 5 uM wortmannin for ten days. At this time point, control culture has not differentiated yet. Medium was replaced every two days. Overall
- Conjugate
- Green dye
- Submitted by
- Invitrogen Antibodies (provider)
- Main image
- Experimental details
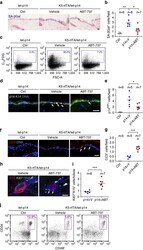
- Figure 5 ABT-737 treatment eliminates senescent epidermal cells and induces stem cell proliferation. ( a ) Skin sections stained for SA-beta-Gal (blue) of control tet-p14 (Ctrl) mice, and K5-rtTA/tet-p14 mice treated with dox for 4 weeks to activate p14 ARF , and subsequently treated with ABT-737 (p14+ABT) or vehicle (p14+V) for 4 consecutive days. ( b ) SA-beta-Gal + cells per microscopic field in mice as in a . ( c ) FACS analyses of SA-beta-Gal activity (C 12 FDG stain) in epidermal cells isolated from indicated mice. Gate indicates SA-beta-Gal + cell percentages. FSC-A--forward scatter. ( d ) Skin sections stained for the human p14 ARF (white, arrows) from indicated mice after 2 days of ABT-737 or vehicle treatment. K14 (green) marks the basal epidermis. ( e ) p14 ARF+ cells per field in mice as in c . ( f ) Sections of mice as in c stained for the apoptosis marker cleaved caspase-3 (CC3, arrows). ( g ) CC3 + cells per field in same mice. ( h ) Sections of hair follicle bulges of p14-expressing mice after 4 days of ABT-737 or vehicle treatment, stained for the proliferation marker Ki67 (green, arrows) and the bulge marker K15 (red). ( i ) Numbers of Ki67 + K15 + cells per follicle per mouse in mice as in h . Dots represent mean number in individual mice, combining three independent experiments. ( j ) Representative FACS analyses of epidermal cells from indicated mice after 2 days of ABT-737 or vehicle treatment, stained for CD34, CD49f and Sca1. Charts show only Sca1 - (f
- Conjugate
- Green dye
- Submitted by
- Invitrogen Antibodies (provider)
- Main image
- Experimental details
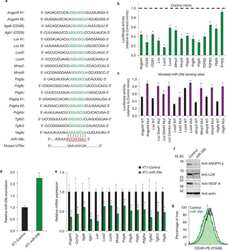
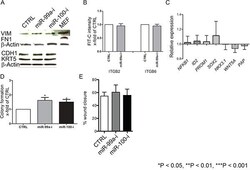
- Figure 5 Suppression of miR-99a/100-induced efficient DNA repair in CB cells is not due to induction of epithelial-mesenchymal transition or de-differentiation A. Representative western blot analysis of epithelial-mesenchymal transition-associated proteins E-cadherin (CDH1), fibronectin (FN1) and Vimentin (VIM) in CB cells transfected with control, miR-99a-inhibitor, and miR-100-inhibitor, for 3 days. B. FACS analysis for CD49b (ITGB2) and CD49f (ITGB6) expression of CB cells transfected with either control or miR-99a inhibitor for 3 days (n=3 PCa). C. mRNA levels of differentiation-associated genes (Nuclear factor kappa-light-chain-enhancer of activated B cells 1 (NFkB1), DNA-binding protein inhibitor ID-2 (ID2), prominin 1 (PROM1), Sex determining region Y-box 2 (SOX2), Homeobox protein Nkx-3.1 (NKX3.1), Wingless-Type MMTV Integration Site Family, Member 5A (WNT5a) and Pappalysin A (PAP)) after miR-99a-inhibitor transfection in CB cells, for 3 days, relative to control transfection. None of the changes were statistically significant (n = 2 BPH and 3 PCa, each sample in triplicate) were measured by qRT-PCR and normalized to RPLP0. D. Colony forming efficiency of miR-99a/100 inhibitor transfected CB cells (n=3 PCa). E. Wound healing assay miR-99a/100 inhibitor transfected CB cells after 48 h. Data are expressed as mean +- s.d. *P < 0.05, **P < 0.01, ***P < 0.001 (Student's ttest).
- Conjugate
- Green dye
- Submitted by
- Invitrogen Antibodies (provider)
- Main image
- Experimental details
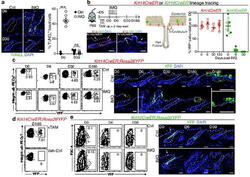
- Extended Data Fig. 1 Lineage tracing of skin stem cells and progeny during and after acute skin inflammation a, Epifluorescence images and corresponding quantifications of TUNEL + basal cells at D6 of imiquimod treatment (or vehicle Ctrl) and at D30 following treatment (n=7. P0.05)). b, Schematic, immunofluorescence images, and quantifications of tamoxifen(TAM)-induced (corn oil control, Ctrl) RosaYFP reporter lineage tracing with: Krt14CreER, expressed by K14 + EpSCs and Krt10CreER, expressed by K10 + terminally differentiating cells., intraperitoneal (i.p.) (n=4. all time points P>0.05). Plots depict percentage of YFP + cells relative to pre-imiquimod (D0) baselines (corresponding flow cytometric plots in Extended Data Fig. 1c,e ). Arrows mark examples of YFP+ cells. c, Lineage tracing of Krt14CreER; RosaYFP at indicated times. Left, flow cytometric analysis of Integrin-alpha6 + Sca1 + CD34 - YFP + epidermal keratinocytes. Right, immunofluorescence of tamoxifen-activated EpSCs, lineage traced by YFP + to include progeny (n=3). d, Flow cytometry of Krt14CreER;Rosa YFP cells from the skin epidermis of animals that were lineage traced starting from IMQ treatment and analyzed at D180 (n=2). e, Analysis of Krt10CreER;RosaYFP skins, lineage-traced beginning during IMQ or Ctrl treatment (n=3). Top, flow cytometric analysis of side YFP + cells. Bottom, representative immunofluorescence images. All scale bars= 50 um. Dotted lines demarcate the dermo-e
- Conjugate
- Green dye
- Submitted by
- Invitrogen Antibodies (provider)
- Main image
- Experimental details
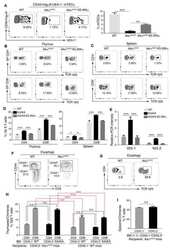
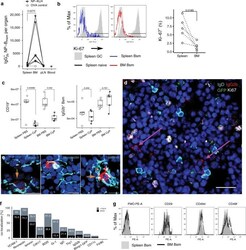
- Fig. 1 The bone marrow contains a major population of isotype-switched non-proliferating memory B cells. a Quantification of NP-specific IgG2a/b + spleen, peripheral lymph nodes, blood and bone marrow (BM) memory B cells. Female C57BL/6 mice immunized with NP-KLH/LPS SC. Numbers of NP-binding IgG2b + cells in Spleen, BM, blood, and peripheral lymph nodes (pLN) determined by flow-cytometry on d421 or d426 post immunization; pooled from two independent experiments. OVA ctrl: staining controls from mice immunized with the irrelevant antigen ovalbumin (OVA). Gated for IgG2b + CD19 + CD38 + CD138 - GL7 - CD11c - IgM - IgD - PI - small lymphocytes (cf. Supplementary Fig. 5 ). Lines connect samples from one individual, paired one-sided t -test for spleen and BM samples. b Flow-cytometric quantification of Ki-67 expression in IgG2b + Bsm (IgG2b + CD19 + CD38 + CD138 - GL7 - CD11c - IgM - IgD - PI - small lymphocytes) splenic naive (IgM + IgD + IgG2b - CD19 + CD38 + CD138 - GL7 - CD11c - PI - small lymphocytes) and germinal center (GC) (CD19 + CD38 lo GL7 + CD11c - PI - lymphocytes) B cells. Frequencies of Ki-67 + cells within the subset, data in right graph from two independent experiments using pooled cells from 4 to 20 C57BL/6 mice, paired one-sided t -test. c Flow-cytometric quantification of CD19 + B cells and IgG2b + memory B cells in female C57BL/6J mice treated with Cyclophosphamide (CyP) or untreated controls (PBS) after immunization with 3x NP-CGG/IFA. Analysis performed aft
- Conjugate
- Green dye
- Submitted by
- Invitrogen Antibodies (provider)
- Main image
- Experimental details
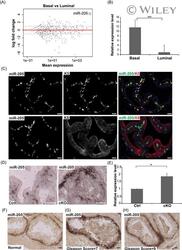
- 1 miR-205 is highly expressed in the basal layer of prostate gland. A, Quantification of miR-seq data show miR-205 is the most abundantly expressed miRNA in basal cells. Red square circles miR-205 . B, qPCR validation of differential miR-205 expression in basal and luminal cells. Data shown are mean +- SEM, collected from three independent experiments. *** P < .001. C, miR-205 is expressed in basal but not luminal cells. Upper panel: miR-205 is expressed in Krt5+ basal cells. Arrows point to colocalization of miR-205 and Krt5 signals. Lower panel: miR-205 is not expressed in Krt8+ luminal cells. D, miR-205 expression is restricted to basal cells in both control (Ctrl) and Pten (cKO) prostate samples. E, qPCR quantification shows elevated miR-205 expression in FACS purified basal cells from Pten prostate. Data shown are mean +- SEM, collected from three independent experiments. * P < .05. F-H, In situ hybridization for miR-205 in normal human prostate (F) and human prostate cancer patients with Gleason score 7 (G) or 9 (H). Scale bars in all panels, 20 muM. FACS, fluorescence activated cell sorting; miRNA, microRNA; qPCR, quantitative polymerase chain reaction [Color figure can be viewed at wileyonlinelibrary.com]
- Conjugate
- Green dye
- Submitted by
- Invitrogen Antibodies (provider)
- Main image
- Experimental details
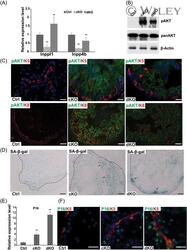
- 5 miR-205 is required to promote pAKT and bypass cellular senescence in Pten prostate. A, qPCR quantification of miR-205 targets, Inppl1 and Inpp4b , in the basal cells of Ctrl, cKO, and dKO prostate. Hprt is used as internal control. Data shown are mean +- SD, collected from three independent experiments, ** P < .01. B, Representative Western blot analysis quantification using total prostate lysate shows strongly upregulated pAkt levels in cKO and attenuated upregulation in dKO samples. Total Akt levels are not changed. Three independent experiments were performed. C, pAkt levels increase in both basal and luminal layer in cKO, less strongly increases in dKO and are absent in Ctrl. Basal and luminal cells are marked by Krt5 and Krt8 signals, respectively. D, SA-beta-gal staining shows Pten -induced senescence in cKO and more prominent increases in dKO. Arrows point to senescent cells with strong signals. E, qPCR quantification of p16 in FACS purified basal layer isolated from Ctrl, cKO, and dKO prostate. Data shown are mean +- SD, collected from three independent experiments, ** P < .01. F, p16/Krt5 costaining identifies senescent cells in basal and luminal cells in both cKO and dKO samples but rarely in Ctrl. Scale bars in all panels, 20 muM. FACS, fluorescence activated cell sorting; miRNA, microRNA; qPCR, quantitative polymerase chain reaction; SA-beta-gal, senescence-associated beta-galactosidase; SD, standard deviation [Color figure can be viewed at wileyonline
- Conjugate
- Green dye
- Submitted by
- Invitrogen Antibodies (provider)
- Main image
- Experimental details
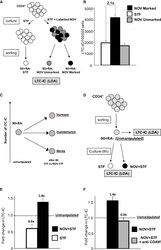
- Figure 2 NOV Increases the Frequency of Functional 90+RA- Cells in Single UCB Units (A) Strategy for isolating NOV-marked, NOV-unmarked, and STF-only 90+RA- cells. CD34+ cells are incubated with labeled NOV plus STF or STF alone before antibody staining. (B) LTC-IC frequencies of STF-control, NOV-marked, and NOV-unmarked 90+RA- cells. n = 8 individual UCB unit;, p (STF versus NOV-marked) = 0.0002 (t test); mean + SEM p value by ELDA ( http://bioinf.wehi.edu.au/software/elda/ ; ). (C) Possible impacts on LTC-IC number of ex vivo culture of 90+RA- cells. Relative to unmanipulated cells (left), the total number of LTC-ICs could decay, be maintained, or increase after 8 h. These may be distinguished by directly comparing LTC-IC frequencies of unmanipulated and cultured cells from the same UCB unit. (D) Strategy to distinguish recruitment and rescue models by enumeration of absolute numbers of LTC-ICs in 90+RA- cells isolated from a single UCB unit before and after exposure to STF or NOV+STF. The absolute number of LTC-ICs present at the start of each culture is the product of the number of unmanipulated cells inoculated and the LTC-IC frequency in unmanipulated cells, absolute numbers at the end calculated from the relevant cell count, and LTC-IC frequency. (E) Fold changes in LTC-IC numbers in STF- and NOV+STF-treated 90+RA- cells. Number of LTC-ICs in the unmanipulated cells inoculated is normalized to 1.0 (dashed line); the fold change in the absolute number of LTC-ICs is calc
- Conjugate
- Green dye
- Submitted by
- Invitrogen Antibodies (provider)
- Main image
- Experimental details
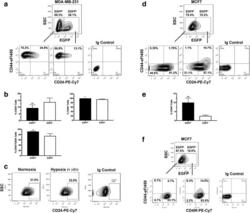
- Fig. 2 Cancer stem cell (CSC)-like cells are enriched in the hypoxic populations freshly isolated from xenografts. Tumor cells are enzymatically dissociated and isolated from either the MDA-MB-231/HRE-EGFP ( a - c ) or MCF7/HRE-EGFP ( d - f ) xenografts. Stem cell characteristics are evaluated by fluorescence-activated cell sorting (FACS) for the expression of CSC-associated surface markers CD24, CD44 and CD49f. Representative FACS plots are shown in a , c , d and f . Quantitative population analyses are shown in b ( n = 4-5; * p < 0.05, *** p < 0.001, Student's t test) and e (n = 4; *** p < 0.001, Student's t test). These results are confirmed by three or more independent experiments. EGFP, enhanced green fluorescent protein; SSC, side scatter
- Conjugate
- Green dye
- Submitted by
- Invitrogen Antibodies (provider)
- Main image

- Experimental details
- Figure 3 Organoids derived from FACS-sorted mammary epithelial cells. Mammary cells were dissociated following experimental steps included in this protocol, up to step 4.s. and steps in A lternatives (A) Cells were then stained with EpCAM and CD49f to distinguish between luminal and basal epithelial cell populations. P1 gate (green) indicates epithelial cells, whereas red dots represent stromal cells. (B) Sorted luminal and basal cells were counted, plated in Matrigel domes, and let grow into organoids. Representative images showing organoid colonies after 18 days of culture are provided. Three different types of organoid colonies can be identified and are generally referred to as solid colonies (left), cystic colonies with bright reflection (middle), and budding colonies with protruding cells (right) (). Scale bar = 50 mum.
- Conjugate
- Green dye
- Submitted by
- Invitrogen Antibodies (provider)
- Main image
- Experimental details
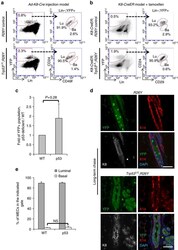
- Figure 2 Induced loss of p53 in luminal cells does not directly alter their luminal identity. ( a ) FACS analysis of MGs from virgin females with the indicated genotypes 3 weeks after intraductal injection of Ad-K8-Cre showing YFP-marked MECs were largely restricted to the luminal gate. Ba, basal gate; Lin, lineage markers (including CD45, CD31 and Ter119); Lu, luminal gate. ( b ) FACS analysis showing YFP-marked MECs from K8-CreER;Trp53 L/L ;R26Y ( n =4) or K8-CreER;R26Y ( n =3) females 4 weeks after tamoxifen administration. Note in both types of mice, YFP + MECs were restricted to the luminal gate. Ba, basal gate; Lu, luminal gate. ( c ) Quantification of percentages of YFP + populations 3-4 weeks after injection of Ad-K8-Cre to Trp53 L/L ;R26Y females (p53) or matched R26Y -only females (WT). Data represent four independent experiments. In each experiment (one WT, one p53), the percentage of YFP + cells in the p53 experimental female was normalized to that in the WT control female (=1) from the same experiment. ( d ) Co-IF staining of K8 (white), K14 (red) and YFP (green) on MG sections from Trp53 L/L ;R26Y ( n =5) or R26Y -only ( n =4) virgin females >5 months after intradcutal injection of Ad-K8-Cre . Each channel of the co-IF staining is shown. Scale bars, 50 mum. ( e ) Quantification of percentages of cells in the luminal or basal gate in a . Data represent mean+-s.e.m. from three independent experiments (one WT, one p53 in each experiment). P value: NS, not significa
- Conjugate
- Green dye
- Submitted by
- Invitrogen Antibodies (provider)
- Main image
- Experimental details
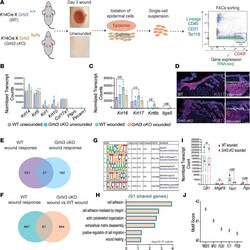
- Figure 4 GRHL3 regulates the expression of factors that modulate E-cadherin levels and cell-cell adhesion in the wound front. ( A ) Schematic representation of wound-front keratinocyte isolation at day 3 from WT and Grhl3 -cKO mice ( n = 2/genotype). ( B ) Normalized mRNA expression (reads per kilobase of transcript, per million mapped reads [RPKM]) of keratinocyte and nonkeratinocyte markers (mean +- SEM). ( C ) Normalized mRNA expression (RPKM) of wound markers (mean +- SEM). ( D ) Immunofluorescence analysis of Keratin-17 (anti-Krt17) expression in wound sections from WT and Grhl3 -cKO mice. Dotted lines indicate the epidermis-dermis junctions. Side panels show higher magnification of Krt17 expression in unwounded and wounded epidermis. Scale bar: 45 mum. ( E ) Venn diagrams depicting the overlap of genes that are differentially expressed in the WT wound response (WT wounded versus unwounded) and the genes that are differentially expressed in the Grhl3 -cKO wounds response ( Grhl3 -cKO wounded versus unwounded). ( F ) Venn diagrams depicting the overlap of genes that are differentially expressed in WT wound response (WT wounded versus unwounded) and the genes that are differentially expressed in Grhl3 -cKO wounds ( Grhl3 -cKO wounded versus WT wounded). ( G ) Motif analysis on overlapped genes (91 genes from F ) that are differentially expressed in the WT wound response and Grhl3 -cKO wounds. ( H ) Gene ontology of differentially expressed genes (91 overlapped genes from F
- Conjugate
- Green dye
- Submitted by
- Invitrogen Antibodies (provider)
- Main image
- Experimental details
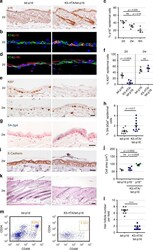
- Fig. 1 p16 induces cell-cycle arrest and cell hypertrophy, and disrupts hair-follicle growth. a Immunostaining of human p16 (brown) in back skin sections of K5-rtTA/tet-p16 and control tet-p16 mice treated with doxycycline (dox) for 2 days (2d) starting at 3 weeks of age. b Skin sections from the same mice stained for p16 (red) and K14 (green), which labels the basal epidermis. c Percentage of p16 + keratinocytes in the interfollicular epidermis (IFE) in mice treated with dox for 2 days (2d), 2 weeks (2w), or 6 months (6 m). Dots indicate individual mice, n = 5, 5, 4 in respective groups. d Skin sections from mice treated with dox for 2 days, stained for Rb phosphorylated on Thr-821/826 (p-Rb) (red) and K14 (green). e Immunostaining of the proliferation marker Ki67 (brown) in sections from mice treated with dox for 2 days (2d) or 2 weeks (2w). f Percentage of IFE keratinocytes expressing Ki67 in the same mice (dots). n = 4, 6, 4, 4. g SA-betaGal staining (blue) of skin sections from indicated mice, treated with dox for 2 weeks. h Percentage of SA-betaGal positive IFE cells from indicated mice (dots) treated with dox for 2 weeks. n = 9, 10. i Skin sections from indicated mice stained for E-Cadherin (brown) to indicate cell circumference. j Area of epidermal keratinocytes from indicated mice (dots). Shown are values for control mice (tet-p16), and for p16 - and p16 + keratinocytes in K5-rtTA/tet-p16 mice. n = 3, 6, 6 mice, >60 cells were scored per mouse. k H&E-stained skin sec
- Conjugate
- Green dye
- Submitted by
- Invitrogen Antibodies (provider)
- Main image
- Experimental details
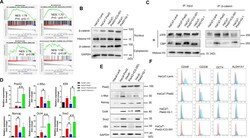
- Figure 4 CBP/beta-catenin promotes the maintenance of stem cell reprogramming by Piwil2. (A) GSEA plot showing significant enrichment of the Wnt/beta-catenin signaling activation modules in HaCaT-Piwil2 cells. (B) Immunoblotting of beta-catenin translocated into the nucleus in HaCaT-Piwil2 cells after treatment with 20 uM ICG-001 or IQ-1 for 24 h. (C) Nuclear lysates from HaCaT-Piwil2 cells treated with 20 uM ICG-001, 20 uM IQ-1, or DMSO were coimmunoprecipitated with antisera to beta-catenin and immunoblotted for CBP and p300. (D and E) The expression of Piwil2 and the ""reprogramming"" factors c-Myc, Nanog, Oct4, Sox2 , and Klf4 was determined by real-time PCR and immunoblotting in HaCaT-Piwil2 cells treated with 20 uM ICG-001, 20 uM IQ-1, or DMSO for 24 h. (F) The proportion of CD49f-, CD338-, OCT4-, and ALDHA1-positive cells, determined by flow cytometry in HaCaT-Piwil2 cells treated with 20 uM ICG-001, 20 uM IQ-1, or DMSO for 24 h. The data are presented as the mean +- SD. * P < 0.05 and ** P < 0.01 by Student's t test. Figure 4
- Conjugate
- Green dye
- Submitted by
- Invitrogen Antibodies (provider)
- Main image
- Experimental details
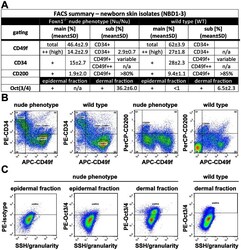
- Figure 4 As Oct3/4+ population is expanded; CD49f+, CD34+ and CD200+ populations are reduced in epithelial isolates from newborn skin of the Foxn1 -/- phenotype vs. wild type. (A) Flow cytometry summary table listing fractions positive for markers of progeny within epithelial isolates from newborns (%+-SD, n>6). Distinct differences between the Foxn1 -/- phenotype and wild type are demonstrated by comparative sample flow cytometry data gated for (B) CD49f, CD34, CD200 and (C) Oct3/4 positive epithelial fractions.
- Conjugate
- Green dye
- Submitted by
- Invitrogen Antibodies (provider)
- Main image
- Experimental details
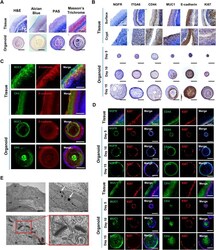
- Histological, immunohistological and ultrastructural analyses of tonsil epithelial organoids. (A) Histology of human tonsil epithelium tissues and organoids on day 15. Each sample was stained with H&E for morphological analysis, Alcian blue to visualize the mucosal layer and mucous-producing goblet cells, PAS to visualize mucosubstances, and Masson's trichrome to visualize connective matrix. (B) Immunohistological analyses of surface and crypt areas of human tonsil epithelium tissues along with tonsil organoids on days 5, 10 and 15. Each sample was immuno-stained with antibodies specific for epithelium markers, including NGFR, ITGA6, CD44, MUC1, and E-cadherin, as well as a cell proliferation marker, Ki67. (C) Immunofluorescence to compare distribution of suprabasal/superficial layer markers, MUC1 and CK4 (green), between the tonsil tissues and the organoids on day 15; the epithelial marker E-cadherin (red), was used as a control. Merged images with Hoechst 33342 staining (blue) are shown in the right-hand panels. (D) Immunofluorescence images showing a time course of organoid development on days 5, 10, and 15. Representative markers (green) for basal layer cells (NGFR and CD44; upper panels) and suprabasal/superficial layer cells (MUC1 and CK4; lower panels) were labeled with the corresponding antibodies; Ki67 (red) was used as a control for active proliferation. Merged images with Hoechst 33342 staining (blue) are shown in the right-hand panels. (E) TEM images illustrating
- Conjugate
- Green dye
- Submitted by
- Invitrogen Antibodies (provider)
- Main image
- Experimental details
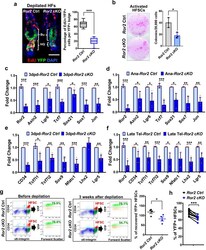
- Ror2 depletion results in downregulation of Wnt/beta-catenin target genes and stemness genes, which in turn lead to a delay of HFSC activation and the loss of a HFSC population. a Depilation-activated Ror2 cKO HFSCs display a delay in activation. Two days post-depilation and 24 h post-EdU labeling, depilated skins were immunostained (left) and quantified (right). Data are reported as the median (the line within the box), the 25th to 75th percentiles (bottom and top lines of the box) and the 10th to 90th percentiles (bottom and top whiskers); n = 8 (Ctrl) or 10 (cKO) HFs examined over one pair of animals; *** p < 0.0001. Scale bar represents 50 mum. b Colony formation efficiency (CFE) of Ror2 Ctrl and cKO HFSCs from anagen onset back skins. Colonies from FACS-purified HFSCs are stained with Rhodamine B (left). Quantification of CFE (right). Numbers of colonies which sizes >= 3 mm 2 were counted. Data are reported as average +- s.d. ; n = 3 indepe n dent wells; * p = 0.0269. Results are representative of at least two independent experiments. c , d Real-time PCR analysis for Wnt/beta-catenin target genes with FACS-purified Ror2 Ctrl and cKO HFSCs 3 days post-depilation ( c ) or at anagen onset ( d ). Values were normalized to Ror2 Ctrl HFSC mRNA. e , f Real-time PCR analysis for HFSC stemness genes with FACS-purified Ror2 Ctrl and cKO HFSCs 3 days post-depilation ( e ) or at late telogen ( f ). Data in c - f are reported as average +- s.d. ; n = 4 biological independent animals;
- Conjugate
- Green dye
- Submitted by
- Invitrogen Antibodies (provider)
- Main image
- Experimental details
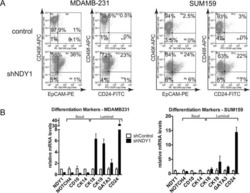
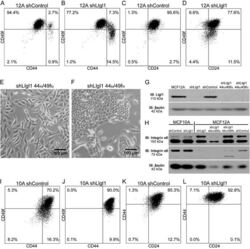
- Figure 2 Llgl1 regulates expression of cell lineage markers A. - D. , I. - L. Cells were incubated with the indicated cell lineage marker and sorted by FACS. A. - D. MCF12A shControl vs shLlgl1 (under normal growth conditions) were incubated with anti-CD49f-PE, anti-CD44-APC, and/or anti-CD24-FITC. E. and F. MCF12A shLlgl1 were sorted based on CD44/CD49f expression, CD444 hi /CD49f lo (E) and CD44 lo /CD49f hi (F). G. Protein lysates were isolated and analyzed by immunoblot using anti-Llgl1 and anti-betaactin antibodies. H. Protein lysates were analyzed by immunoblot using anti-Integrin alpha6 and anti-betaactin. (I-L) MCF10A shControl vs shLlgl1 (under normal growth conditions) were incubated with anti-CD49f-PE, anti-CD44-APC, and/or anti-CD24-FITC.
- Conjugate
- Green dye
- Submitted by
- Invitrogen Antibodies (provider)
- Main image
- Experimental details
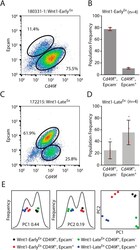
- Fig. 5. Wnt-Early Ex and Wnt1-Late Ex tumors share features with different normal mammary cell types. (A) Cd49f/Epcam FACS profile of a representative Wnt1-Early Ex tumor. (B) FACS population frequencies of Wnt1-Early Ex tumors as measured from four independent primary tumors. Each measurement is represented as a cross. The error bars represent 1 s.d. (C) Cd49f/Epcam FACS profile of a representative Wnt1-Late Ex tumor. (D) FACS population frequencies of Wnt1-Late Ex tumors as measured from four independent primary tumors. Each measurement is represented as a cross. The error bars represent 1 s.d. (E) First two principle components of FACS-sorted Wnt1 tumor gene expression profiles.
- Conjugate
- Green dye
- Submitted by
- Invitrogen Antibodies (provider)
- Main image
- Experimental details
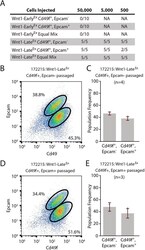
- Fig. 6. Both Wnt1-Late Ex tumor subpopulations have tumor-initiating potential. (A) Limiting dilution cell transplantation assay. Three primary tumors (two Wnt1-Early Ex and one Wnt1-Late Ex ) were transplanted into five 6- to 8-week-old wild-type FVB female mice at each cell concentration and monitored for tumor growth over 120 days. (B) Cd49f/Epcam FACS profile of a representative Wnt1-Late Ex CD49f pos /Epcam neg passaged tumor. (C) FACS population frequencies of Wnt1-Late Ex CD49f pos /Epcam neg passaged tumors as measured from four independent transplanted tumors. Each measurement is represented as a cross. The error bars represent 1 s.d. (D) Cd49f/Epcam FACS profile of a representative Wnt1-Late Ex CD49f pos /Epcam pos passaged tumor. (E) FACS population frequencies of Wnt1-Late Ex CD49f pos /Epcam pos passaged tumors as measured from three independent transplanted tumors. Each measurement is represented as a cross. The error bars represent 1 s.d.
- Conjugate
- Green dye
- Submitted by
- Invitrogen Antibodies (provider)
- Main image
- Experimental details
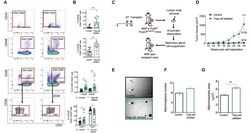
- Figure 3 Ablation of Treg cells results in expansion of the mammary cancer stem/progenitor cell pool. (A,B) Representative flow cytometric plots (A) and quantification (B) of stem cell like-populations (CD24 -/lo CD44 + , CD24 + CD49f + , CD24 + CD29 hi ) and luminal progenitor-enriched population (CD24 + CD29 lo ) of Treg cell-ablated and control mice. Gating on the luminal progenitor-enriched population, we compared immature (CD61 + ) and differentiated luminal progenitors (CD61 - ) between both groups (bottom). Indicated cell populations highlighted with red frames. Values are expressed as mean +- SEM, control n = 11, Treg cell ablated n = 12, **** p < 0.0001, and was calculated by Mann-Whitney test. ** p = 0.0045; *** p = 0.0003; * p = 0.0237; * p = 0.0219 was calculated by two-way ANOVA, followed by Bonferroni's post-hoc test. Data were pooled from four independent experiments. (C,D) Schematics (C) and tumor growth kinetics (D) of mice orthotopically transplanted with dissociated mammary epithelial cells. Values expressed as mean +- SEM. **** p < 0.0001 by two-way ANOVA, followed by Bonferroni's post-hoc test (D) . (E-G) In vitro mammosphere forming capacity of CD45 depleted-mammary cells. Representative images (E) , mammosphere number (F) and area (G) of control (black) and Treg cell-ablated (green) conditions ( n = 16 and n = 13, respectively). Arrow depicts a representative mammosphere in each image. Scale bar represe
- Conjugate
- Green dye
- Submitted by
- Invitrogen Antibodies (provider)
- Main image
- Experimental details
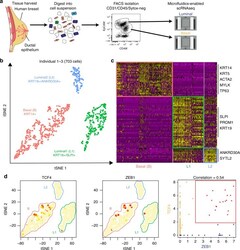
- Fig. 1 Identification of three major epithelial cell types and their markers using scRNAseq. a Overview of scRNAseq approach using primary human breast tissue samples that were processed into single cell suspension, followed by FACS isolation of basal (CD49f-hi, EPCAM+) and luminal (CD49f+, EPCAM-hi), and scRNAseq analysis using the microfluidics-enabled scRNAseq. b Combined tSNE projection of cells from all three microfluidics-enabled scRNAseq datasets. The major basal cluster is highlighted in red; Luminal1 (L1) in green; Luminal2 (L2) in blue. c Heatmap displaying the scaled expression patterns of top marker genes within each cell type with selected marker genes highlighted; yellow indicating high expression of a particular gene, and purple indicating low expression. d Feature plots showing the scaled expression of TCF4 and ZEB1 marking a subpopulation of basal cells and gene plot showing co-expression of TCF4 and ZEB1 in the same cells. See Supplementary Fig. 1 capture site imaging, gene detection, individual principal component analysis, tSNE plot colored by individual-derived cells and feature plots of cell type-specific markers
- Conjugate
- Green dye
- Submitted by
- Invitrogen Antibodies (provider)
- Main image
- Experimental details
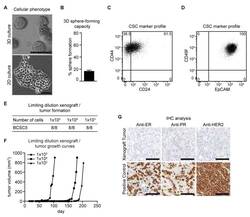
- Figure 1 Characterization of BCSC5 in vitro and in vivo. ( A ) Representative pictures of BCSC5 cultured in 3D and 2D conditions, scale bar 100 mum. ( B ) Sphere-forming capacity of BCSC5 cells in an anchorage-independent growth assay ( n = 3). Data represent means + SEM. ( C , D ) Expression patterns of CD24 and CD44 ( C ) as well as EpCAM and CD49f ( D ) in BCSC5 cells analyzed by flow cytometry. ( E ) Tumor formation in limiting dilution xenografts of BCSC5. ( F ) Representative growth curves for limiting dilution assay of BCSC5 xenografts in immunocompromised NOD/SCID mice. ( G ) Immunohistochemical (IHC) analysis of ER, PR, and HER2 on sections of the BCSC5 xenograft tumors, scale bar 100 mum.
- Conjugate
- Green dye
- Submitted by
- Invitrogen Antibodies (provider)
- Main image
- Experimental details
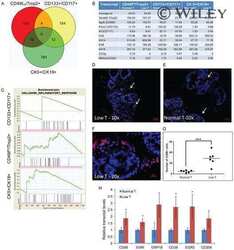
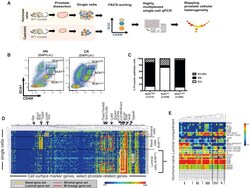
- Figure 1 Single-Cell Expression Profiling of Prostate Cells from HN and Castrated Mice (A) Schematic diagram demonstrating experimental setup for single-cell expression profiling. (B) FACS gating strategy used to sort single prostate cells, from Lineage-negative cells (Lin - : CD31 - CD45 - TER119 - ). (C) Quantification of keratin expression profiles by IF based on three FACS-sorted populations as in (B). The number of cells counted in each group is shown from five mice. See also Figures S1 A-S1C. (D) Hierarchical clustering of single prostate cells from HN and castrated (CR) mice showing separation of luminal, basal, and stromal cells, as well as the luminal (white), basal (yellow), bi-lineage (red), and stromal (purple) gene sets. Color scale is indicated. See also Table S2 . (E) Enlarged view of select genes from the heatmap in Figure S1 I clustering prostate cells in the luminal lineage from HN mice into five subsets. Color scale is indicated. See also Figure S1 .
- Conjugate
- Green dye
- Submitted by
- Invitrogen Antibodies (provider)
- Main image
- Experimental details
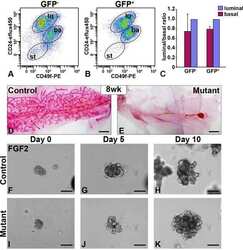
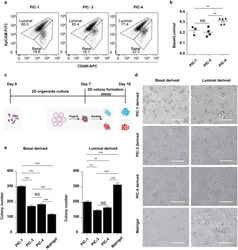
- Figure 4 PIC hydrogels provide a tunable system to investigate specific MGO characteristics. a) Representative FACS plots of CD49f (basal) and EpCAM (luminal) stained cystic MGOs generated in different PIC hydrogels. One set of representative FACS plots out of three independent experiments is shown. b) Quantification of basal to luminal population ratio of cystic MGOs generated in different PIC hydrogels from FACS analysis. c) Schematic description of the 3D colony formation assay of mammary epithelium of cystic MGOs generated in different PIC hydrogels. d) Representative bright-field images of 3D colonies generated from PIC hydrogels or Matrigel-derived basal or luminal population. Two independent experiments were performed and data was presented for one of the experiments. The results of the other experiment are shown in Figure S8 (Supporting Information). Scale bar, 250 um. e) Quantification of basal/luminal population-derived 3D colony numbers in PIC hydrogels or Matrigel. Only colonies with a diameter above 20 um were counted. NS, not significant. ** P < 0.01, *** P < 0.001, using one-way ANOVA followed by Tukey's multiple comparisons test.
- Conjugate
- Green dye
 Explore
 Validate
 Learn
Learn Flow cytometry