 Explore
 Validate
 Learn
Learn Western blot
 Immunohistochemistry
Antibody data
- Antibody Data
- Antigen structure
- References [1]
- Comments [0]
- Validations
- Western blot [3]
- Flow cytometry [2]
- Other assay [1]
Submit
Validation data
Reference
Comment
Report error
- Product number
- PA5-23184 - Provider product page

- Provider
- Invitrogen Antibodies
- Product name
- KLF4 Polyclonal Antibody
- Antibody type
- Polyclonal
- Antigen
- Other
- Reactivity
- Human, Mouse, Rat
- Host
- Rabbit
- Isotype
- IgG
- Vial size
- 100 µg
- Concentration
- 1 mg/mL
- Storage
- -20° C, Avoid Freeze/Thaw Cycles
Submitted references MiR-145 mediates cell morphology-regulated mesenchymal stem cell differentiation to smooth muscle cells.
Yeh YT, Wei J, Thorossian S, Nguyen K, Hoffman C, Del Álamo JC, Serrano R, Li YJ, Wang KC, Chien S
Biomaterials 2019 Jun;204:59-69
Biomaterials 2019 Jun;204:59-69
No comments: Submit comment
Supportive validation
- Submitted by
- Invitrogen Antibodies (provider)
- Main image

- Experimental details
- Western blot analysis of KLF4 in Lysate from human 293 cells in the 1) absence and 2) presence of immunizing peptide, 3) mouse NIH 3T3 and 4) RAW cells using a KLF4/GKLF polyclonal antibody (Product # PA5-23184) at 1 µg/mL (293) and 2 µg/mL (NIH 3T3 and RAW). Goat anti-rabbit Ig HRP secondary antibody.

- Submitted by
- Invitrogen Antibodies (provider)
- Main image
- Experimental details
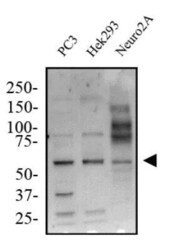
- Western blot analysis of KLF4 in human PC3, Hek293 and mouse Neuro2A cells. Samples were incubated in KLF4 polyclonal antibody (Product # PA5-23184) using a dilution of 2 µg/mL followed by an anti-rabbit HRP secondary antibody. Separated on a 7.5% gel by SDS-PAGE, transferred to PVDF membrane and blocked in 5% non-fat milk in TBST. Detection: chemiluminescence.

- Submitted by
- Invitrogen Antibodies (provider)
- Main image
- Experimental details
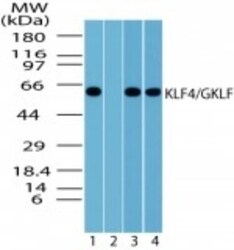
- Western blot analysis of KLF4 in human 293 cells. Samples were incubated in KLF4 polyclonal antibody (Product # PA5-23184) using a dilution of 1 µg/mL (293) and 2 µg/mL (NIH 3T3 and RAW) followed by a Goat anti-rabbit IgG HRP secondary antibody. Lane 1: absence and Lane 2: presence of immunizing peptide; Lane 3: mouse NIH 3T3; Lane 4: RAW cells. PicoTect ECL substrate solution was used for this test.

Supportive validation
- Submitted by
- Invitrogen Antibodies (provider)
- Main image

- Experimental details
- Intracellular flow cytometric analysis using KLF4/GKLF polyclonal antibody (Product # PA5-23184). Balb/c mouse splenocytes were probed using 1 µg of KLF4/GKLF polyclonal antibody (Product # PA5-23184) (red) and 1 µg of isotype control (green). An rabbit IgG PE conjugated secondary.

- Submitted by
- Invitrogen Antibodies (provider)
- Main image

- Experimental details
- Flow cytometry of KLF4 in Balb/c mouse splenocytes. Samples were incubated in KLF4 polyclonal antibody (Product # PA5-23184) using a dilution of 1 µg followed by anti-rabbit IgG PE conjugated secondary. Antibody (red) and 1 µg of isotype control was used for this test.

Supportive validation
- Submitted by
- Invitrogen Antibodies (provider)
- Main image

- Experimental details
- Fig. 3. Elongated cell shape induces SMC differentiation through the miR-145/KLF4 pathway. (A) MicroRNA expression analyses in MSCs subjected to flat or 10 mum microgrooved substrates with TGF-beta1 for 3 days. The microgroove-regulated miRNAs expressions were examined by qRT-PCR. The graphic data is mean +- SEM of value normalized to flat substrates, n = 3. *P < 0.05, **P < 0.005. (B) Western blot analyses of alpha-SMA, SM-22 and GAPDH in MSCs transfected with microgroove-regulated miRNAs or the corresponding controls on flat substrates with TGF-beta1 for 3 days. (C) Western blot analyses of alpha-SMA, SM-22 and GAPDH in MSCs transfected with PM145, AM145 or the corresponding controls and cultured on flat or 10 mum microgrooved substrates. The graphic data are mean +- SEM of band intensity normalized to flat control, n = 3. *P < 0.05, **P < 0.005. (D) Western blot analyses of KLF4 and GAPDH in MSCs transfected with PM145, AM145 or the corresponding controls and cultured on flat or 10 mum microgrooved substrates. The graphic data are mean +- SEM of band intensity normalized to control, n = 3. *P < 0.05, **P < 0.005.
