Explore
 Validate
 Learn
Learn Flow cytometry
Antibody data
- Antibody Data
- Antigen structure
- References [5]
- Comments [0]
- Validations
- Flow cytometry [1]
- Other assay [7]
Submit
Validation data
Reference
Comment
Report error
- Product number
- 25-1389-42 - Provider product page

- Provider
- Invitrogen Antibodies
- Product name
- CD138 (Syndecan-1) Monoclonal Antibody (DL-101), PE-Cyanine7, eBioscience™
- Antibody type
- Monoclonal
- Antigen
- Other
- Description
- Description: The DL-101 monoclonal antibody reacts with human CD138, also known as syndecan-1. CD138 is a transmembrane protein containing chondroitin sulfate and heparin sulfate moieties responsible for binding to the extracellular matrix components. CD138 is not expressed by mature B cells but is present on pre-B cells and the finally differentiated plasma cells. Applications Reported: This DL-101 antibody has been reported for use in flow cytometric analysis. Applications Tested: This DL-101 antibody has been pre-titrated and tested by flow cytometric analysis of the U266 cell line. This can be used at 5 µL (0.5 µg) per test. A test is defined as the amount (µg) of antibody that will stain a cell sample in a final volume of 100 µL. Cell number should be determined empirically but can range from 10^5 to 10^8 cells/test. Light sensitivity: This tandem dye is sensitive photo-induced oxidation. Please protect this vial and stained samples from light. Fixation: Samples can be stored in IC Fixation Buffer (Product # 00-822-49) (100 µL cell sample + 100 µL IC Fixation Buffer) or 1-step Fix/Lyse Solution (Product # 00-5333-54) for up to 3 days in the dark at 4°C with minimal impact on brightness and FRET efficiency/compensation. Some generalizations regarding fluorophore performance after fixation can be made, but clone specific performance should be determined empirically. Excitation: 488-561 nm; Emission: 775 nm; Laser: Blue Laser, Green Laser, Yellow-Green Laser. Filtration: 0.2 µm post-manufacturing filtered.
- Reactivity
- Human
- Host
- Mouse
- Isotype
- IgG
- Antibody clone number
- DL-101
- Vial size
- 100 Tests
- Concentration
- 5 µL/Test
- Storage
- 4° C, store in dark, DO NOT FREEZE!
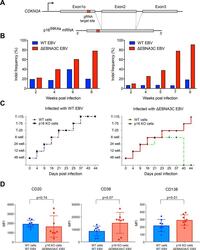
Submitted references Highly efficient CRISPR-Cas9-mediated gene knockout in primary human B cells for functional genetic studies of Epstein-Barr virus infection.
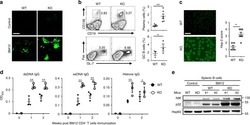
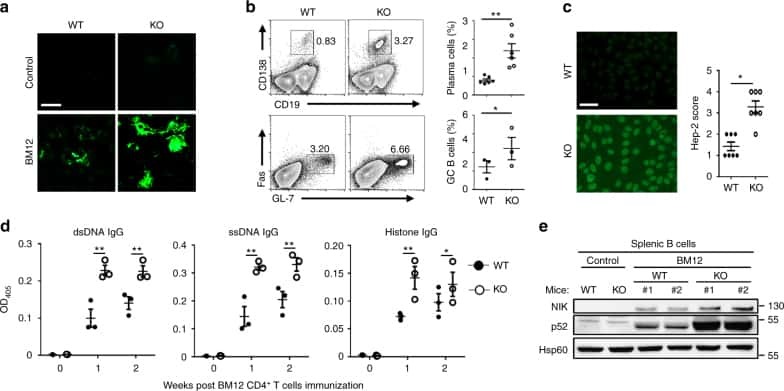
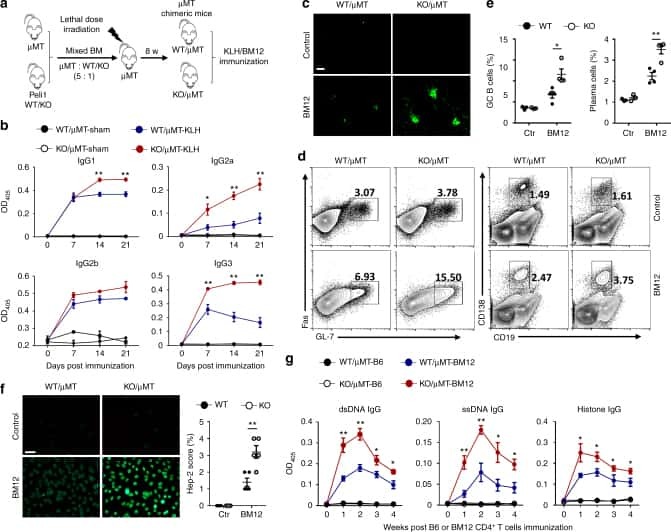
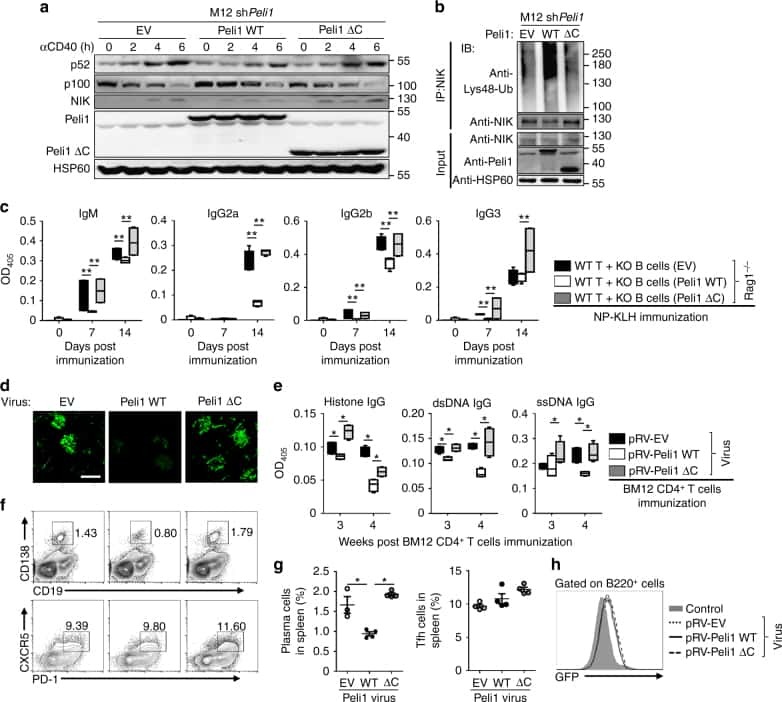
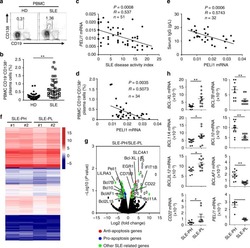
Peli1 negatively regulates noncanonical NF-κB signaling to restrain systemic lupus erythematosus.
Mitochondrial-Targeted Decyl-Triphenylphosphonium Enhances 2-Deoxy-D-Glucose Mediated Oxidative Stress and Clonogenic Killing of Multiple Myeloma Cells.
Differential Effects of Tacrolimus versus Sirolimus on the Proliferation, Activation and Differentiation of Human B Cells.
PRIMA-1Met induces myeloma cell death independent of p53 by impairing the GSH/ROS balance.
Akidil E, Albanese M, Buschle A, Ruhle A, Pich D, Keppler OT, Hammerschmidt W
PLoS pathogens 2021 Apr;17(4):e1009117
PLoS pathogens 2021 Apr;17(4):e1009117
Peli1 negatively regulates noncanonical NF-κB signaling to restrain systemic lupus erythematosus.
Liu J, Huang X, Hao S, Wang Y, Liu M, Xu J, Zhang X, Yu T, Gan S, Dai D, Luo X, Lu Q, Mao C, Zhang Y, Shen N, Li B, Huang M, Zhu X, Jin J, Cheng X, Sun SC, Xiao Y
Nature communications 2018 Mar 19;9(1):1136
Nature communications 2018 Mar 19;9(1):1136
Mitochondrial-Targeted Decyl-Triphenylphosphonium Enhances 2-Deoxy-D-Glucose Mediated Oxidative Stress and Clonogenic Killing of Multiple Myeloma Cells.
Schibler J, Tomanek-Chalkley AM, Reedy JL, Zhan F, Spitz DR, Schultz MK, Goel A
PloS one 2016;11(11):e0167323
PloS one 2016;11(11):e0167323
Differential Effects of Tacrolimus versus Sirolimus on the Proliferation, Activation and Differentiation of Human B Cells.
Traitanon O, Mathew JM, La Monica G, Xu L, Mas V, Gallon L
PloS one 2015;10(6):e0129658
PloS one 2015;10(6):e0129658
PRIMA-1Met induces myeloma cell death independent of p53 by impairing the GSH/ROS balance.
Tessoulin B, Descamps G, Moreau P, Maïga S, Lodé L, Godon C, Marionneau-Lambot S, Oullier T, Le Gouill S, Amiot M, Pellat-Deceunynck C
Blood 2014 Sep 4;124(10):1626-36
Blood 2014 Sep 4;124(10):1626-36
No comments: Submit comment
Supportive validation
- Submitted by
- Invitrogen Antibodies (provider)
- Main image

- Experimental details
- Staining of the U266 cell line with Mouse IgG1 K Isotype Control PE-Cyanine7 (Product # 25-4714-80) (blue histogram) or Anti-Human CD138 (Syndecan-1) PE-Cyanine7 (purple histogram). Total viable cells, as determined by Fixable Viability Dye eFluor® 660, were used for analysis.

Supportive validation
- Submitted by
- Invitrogen Antibodies (provider)
- Main image
- Experimental details
- NULL
- Submitted by
- Invitrogen Antibodies (provider)
- Main image
- Experimental details
- NULL
- Submitted by
- Invitrogen Antibodies (provider)
- Main image

- Experimental details
- NULL
- Submitted by
- Invitrogen Antibodies (provider)
- Main image
- Experimental details
- NULL

- Submitted by
- Invitrogen Antibodies (provider)
- Main image
- Experimental details
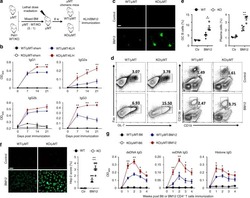
- Fig 4 p16 INK4a is a functional barrier to EBV driven proliferation of lymphoblastoid cells. (A) Blueprint of the primary transcript and the spliced mRNA with the three exons of CDKN2A on chromosome 9 encoding the p16 INK4a protein. The target site of the RNP complex within the 1st exon (exon1alpha) (chr9:21,974,678-21,974,827) is shown. (B) Study of the biological effect of the CDKN2A knockout in a time course experiment. WT and p16 KO cells were mixed such that the fraction of the latter was in the order of 10 to 20%, when the cells were infected with WT or DeltaEBNA3C EBV strains. The knockout status of the CDKN2A gene was studied by next generation sequencing to analyze the CD46 locus of the mixed cell populations over time. The fraction of cells with a disabled CDKN2A gene increased in cells infected with DeltaEBNA3C EBV exceeding 80% after eight weeks, whereas the knockout status of CDKN2A in the population of cells infected with WT EBV did not show a clear trend. Results from two biological replicates are shown, additional replicates can be found in S4A Fig . (C) Cell numbers of four different B cell populations were plotted as a function of days post nucleofection (x-axis) versus the format of the cell culture vessel (y-axis) starting with a single well in a 48-well cluster plate. 2x10 6 B cells with an intact CDKN2A locus (WT cells) or cells with an edited CDKN2A gene (p16 KO cells) were infected with wild-type (WT) EBV (left panel) or DeltaEBNA3C EBV (right panel).

- Submitted by
- Invitrogen Antibodies (provider)
- Main image

- Experimental details
- 10.1371/journal.pone.0167323.g001 Fig 1 Flow cytometric analysis of stem-like cells in HMCLs. A. Representative dot plots for CD138 vs. side scatter and B. quantification of % CD138 low fractions. C. Hoechst 33342 staining for SP with or without verapamil. Gate represents the % SP fractions, MP = main population. D. Quantification of % SP cells in MM.1S and OPM-2 cell lines +- verapamil. Bars represent mean of three independent runs +- SEM, *p < 0.05 vs. control.

- Submitted by
- Invitrogen Antibodies (provider)
- Main image

- Experimental details
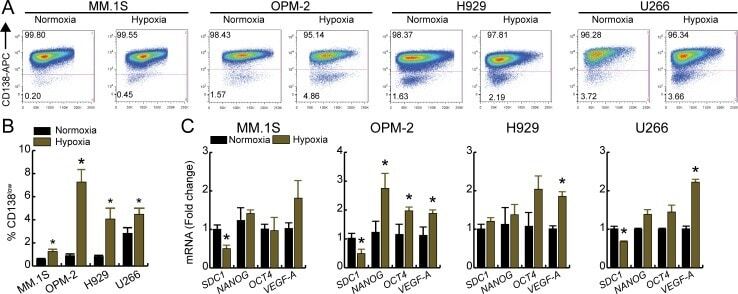
- 10.1371/journal.pone.0167323.g002 Fig 2 Hypoxia increases CD138 low population and alters transcriptional profile of HMCLs. Cell were cultured at either normoxia (21% O 2 ) or hypoxia (1% O 2 ) for 3 days, labeled with CD138-APC antibody and the percentage of CD138 low and CD138 high cells were analyzed by flow cytometry. A. Representative dot plots of different HMCLs and B. quantification of % CD138 low fractions under normoxia or hypoxia. C. qRT-PCR analysis of SDC1 , stem cell genes ( NANOG , OCT4 ), and VEGF-A . For panels B and C, bars represent mean of three independent runs +- SEM. *p < 0.05 vs. normoxia.