 Explore
 Validate
 Learn
Learn Western blot
 Other assay
Antibody data
- Antibody Data
- Antigen structure
- References [2]
- Comments [0]
- Validations
- Other assay [3]
Submit
Validation data
Reference
Comment
Report error
- Product number
- PA1-12722 - Provider product page

- Provider
- Invitrogen Antibodies
- Product name
- SGPL1 Polyclonal Antibody
- Antibody type
- Polyclonal
- Antigen
- Synthetic peptide
- Description
- By Western blot, PA1-12722 detects a ~64 kDa protein representing S1P lyase 1 from MDBK cell lysate.
- Reactivity
- Human, Mouse, Rat, Bovine
- Host
- Rabbit
- Isotype
- IgG
- Vial size
- 100 μg
- Concentration
- 1.0 mg/mL
- Storage
- -20°C, Avoid Freeze/Thaw Cycles
Submitted references Nuclear Sphingosine-1-phosphate Lyase Generated ∆2-hexadecenal is A Regulator of HDAC Activity and Chromatin Remodeling in Lung Epithelial Cells.
Sphingosine-1-Phosphate Lyase Deficient Cells as a Tool to Study Protein Lipid Interactions.
Ebenezer DL, Ramchandran R, Fu P, Mangio LA, Suryadevara V, Ha AW, Berdyshev E, Van Veldhoven PP, Kron SJ, Schumacher F, Kleuser B, Natarajan V
Cell biochemistry and biophysics 2021 Sep;79(3):575-592
Cell biochemistry and biophysics 2021 Sep;79(3):575-592
Sphingosine-1-Phosphate Lyase Deficient Cells as a Tool to Study Protein Lipid Interactions.
Gerl MJ, Bittl V, Kirchner S, Sachsenheimer T, Brunner HL, Lüchtenborg C, Özbalci C, Wiedemann H, Wegehingel S, Nickel W, Haberkant P, Schultz C, Krüger M, Brügger B
PloS one 2016;11(4):e0153009
PloS one 2016;11(4):e0153009
No comments: Submit comment
Supportive validation
- Submitted by
- Invitrogen Antibodies (provider)
- Main image
- Experimental details
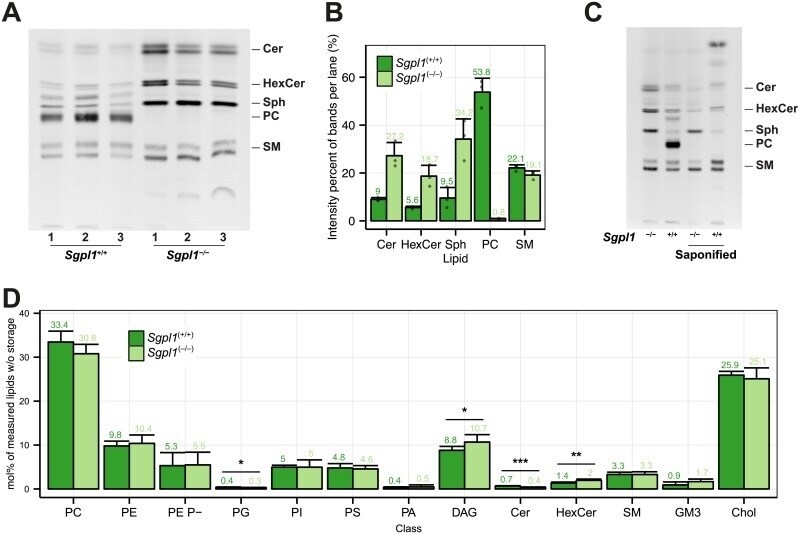
- Fig 1 Characterization of the MEF Sgpl1 +/+ and Sgpl1 -/- cell lines. (A) Sgpl1 +/+ and Sgpl1 -/- cells were metabolically labeled with 6 muM pacSph for 4 h. Lipids were extracted and subjected to click reaction with fluorogenic coumarin azide, separated by TLC and exited with UV light. Lipids were identified via clickable standards ( S3 Fig ). Three replicates are shown for every cell line. (B) Quantification of the fluorescence intensities of Fig 1A. Values are listed in S1 Table . Mean +- SD are shown (n = 3). (C) Samples were treated as above, but were also subjected to alkaline hydrolysis (saponified) or mock treatment. (D) Membrane Lipidome. Lipid class profile of Sgpl1 +/+ and Sgpl1 -/- cells. Lipid classes are standardized to all lipids measured excluding storage lipids (TAG and CE). GP O- lipids are contained in the sum of each class (e.g. PE O- in PE) and may show overlap with diacyl species containing odd-numbered fatty acids. PE Plasmalogens (PE P-) are displayed as a separate class. A Welch Two Sample t-test was used to estimate the P values: *P < 0.05; **P < 0.01; *** P < 0.001. Error bars correspond to standard deviation (n = 6).
- Submitted by
- Invitrogen Antibodies (provider)
- Main image
- Experimental details
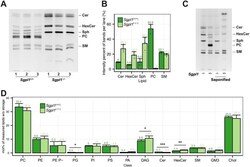
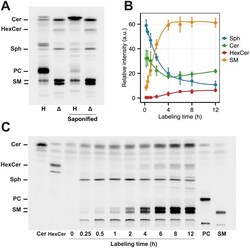
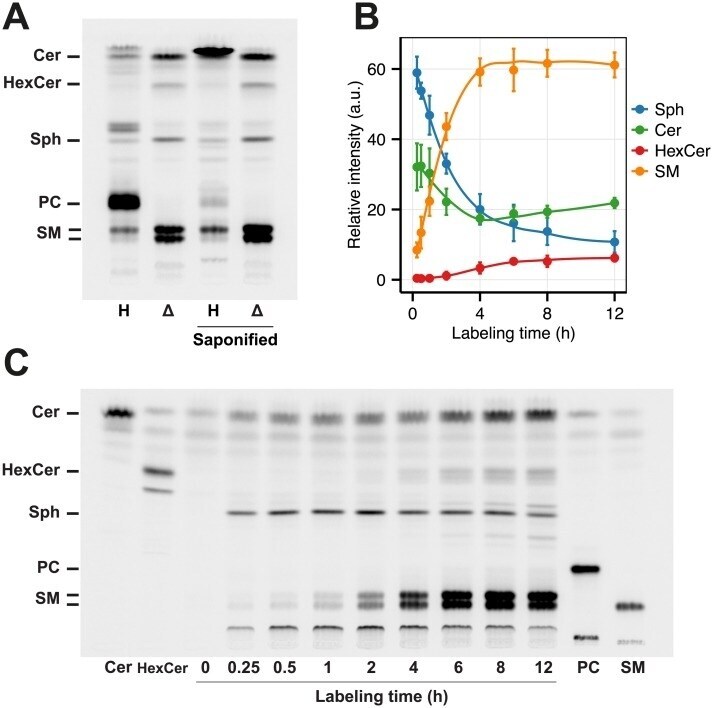
- Fig 2 Characterization of the HeLa Delta SGPL1 cell lines. (A) HeLa wildtype ( H , Lane 1) and HeLa Delta SGPL1 ( Delta ,Lane 2) cells were labeled with 6 muM pacSph for 6 h. Lipids were extracted and subjected to click reaction with fluorogenic fluorescein, separated by TLC and excited with blue light. Lipids were identified based on comparison to the respective lipid standards (see Fig 2C). Both samples were also subjected to alkaline hydrolysis (Lane 3 and 4). (B) Quantification of the fluorescence intensities of Fig 2C. Mean +- SD (n = 3) are shown ( S2 Table ). Each timepoint is standardized to 100% of lipids quantified. Data are fitted by Local Polynomial Regression Fitting (LOESS, degree = 2) as curves. (C) HeLa Delta SGPL1 cells were labeled for the time points indicated and treated as in (A). As reference, 50 pmol of each clickable Cer, HexCer, PC and SM ( S3 Fig ) was loaded as standard.
- Submitted by
- Invitrogen Antibodies (provider)
- Main image
- Experimental details
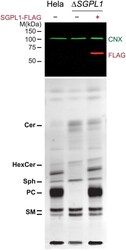
- Fig 3 Rescue of HeLa Delta SGPL1 cells by exogenous Flag-SGPL1. HeLa wildtype, HeLa Delta SGPL1 and HeLa Delta SGPL1 transfected with Flag-tagged SGPL1 were labeled with 6 muM pacSph for 4 h. Upper Panel: Proteins precipitated during the lipid extraction were solubilized, analyzed by SDS-PAGE and immunoblotting, using anti-FLAG antibodies (red). Detection of endogenous calnexin with anti-calnexin antibody (CNX, green) was used as a loading control. Lower Panel: Extracted lipids were subjected to click reaction with fluorogenic coumarin azide, separated by TLC and exited with UV light. Lipids were identified via with alkyne lipid standards ( S3 Fig ).
