Explore
 Validate
 Learn
LearnMA5-15009
antibody from Invitrogen Antibodies
Targeting: EGR1
AT225, G0S30, KROX-24, NGFI-A, TIS8, ZIF-268, ZNF225
 Western blot
 Immunocytochemistry
 Immunoprecipitation Flow cytometry Chromatin Immunoprecipitation Other assay
Antibody data
- Antibody Data
- Antigen structure
- References [4]
- Comments [0]
- Validations
- Immunocytochemistry [3]
- Other assay [2]
Submit
Validation data
Reference
Comment
Report error
- Product number
- MA5-15009 - Provider product page

- Provider
- Invitrogen Antibodies
- Product name
- EGR1 Monoclonal Antibody (T.126.1)
- Antibody type
- Monoclonal
- Antigen
- Synthetic peptide
- Description
- It is not recommended to aliquot this antibody.
- Reactivity
- Human, Mouse, Rat
- Host
- Rabbit
- Isotype
- IgG
- Antibody clone number
- T.126.1
- Vial size
- 100 μL
- Concentration
- 117 μg/mL
- Storage
- -20°C
Submitted references Transcriptional Activation of Matricellular Protein Spondin2 (SPON2) by BRG1 in Vascular Endothelial Cells Promotes Macrophage Chemotaxis.
Id1 Stabilizes Epiblast Identity by Sensing Delays in Nodal Activation and Adjusting the Timing of Differentiation.
IgD attenuates the IgM-induced anergy response in transitional and mature B cells.
Genetic evidence for p75NTR-dependent tetraploidy in cortical projection neurons from adult mice.
Li N, Liu S, Zhang Y, Yu L, Hu Y, Wu T, Fang M, Xu Y
Frontiers in cell and developmental biology 2020;8:794
Frontiers in cell and developmental biology 2020;8:794
Id1 Stabilizes Epiblast Identity by Sensing Delays in Nodal Activation and Adjusting the Timing of Differentiation.
Malaguti M, Migueles RP, Blin G, Lin CY, Lowell S
Developmental cell 2019 Aug 19;50(4):462-477.e5
Developmental cell 2019 Aug 19;50(4):462-477.e5
IgD attenuates the IgM-induced anergy response in transitional and mature B cells.
Sabouri Z, Perotti S, Spierings E, Humburg P, Yabas M, Bergmann H, Horikawa K, Roots C, Lambe S, Young C, Andrews TD, Field M, Enders A, Reed JH, Goodnow CC
Nature communications 2016 Nov 10;7:13381
Nature communications 2016 Nov 10;7:13381
Genetic evidence for p75NTR-dependent tetraploidy in cortical projection neurons from adult mice.
López-Sánchez N, Frade JM
The Journal of neuroscience : the official journal of the Society for Neuroscience 2013 Apr 24;33(17):7488-500
The Journal of neuroscience : the official journal of the Society for Neuroscience 2013 Apr 24;33(17):7488-500
No comments: Submit comment
Supportive validation
- Submitted by
- Invitrogen Antibodies (provider)
- Main image
- Experimental details
- Immunofluorescent analysis of EGR1 in dissociated PC12 cells using an EGR1 monoclonal antibody (Product # MA5-15009) (green) and a MEK1/2 monoclonal antibody (red).
- Submitted by
- Invitrogen Antibodies (provider)
- Main image

- Experimental details
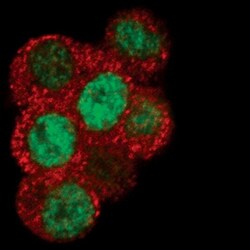
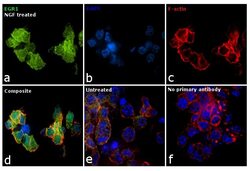
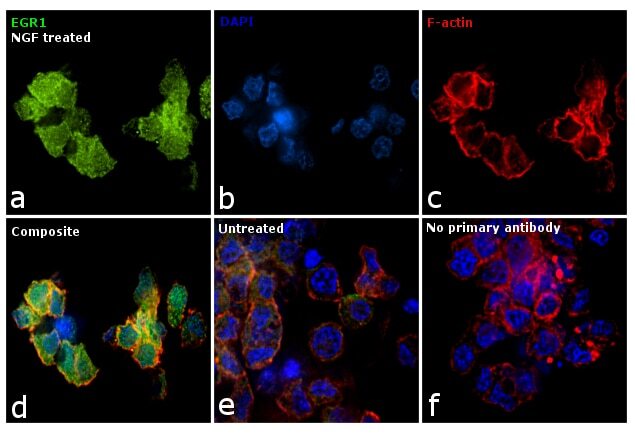
- Immunofluorescence analysis of EGR1 was performed using PC-12 cells treated with NGF (100 ng/mL for 2 hr) post 12 hr serum starvation. The cells were fixed with 4% paraformaldehyde for 10 minutes, permeabilized with 0.1% Triton™ X-100 for 15 minutes, and blocked with 1% BSA for 1 hour at room temperature. The cells were labeled with EGR1 Monoclonal Antibody (T.160.5) (Product # MA5-15009) at 1:100 dilution in 0.1% BSA, incubated at 4 °C overnight and then labeled with Goat anti-Rabbit IgG (Heavy Chain) Superclonal™ Recombinant Secondary Antibody, Alexa Fluor® 488 conjugate (Product # A27034) at a dilution of 1:2,000 for 45 minutes at room temperature (Panel a: green). Nuclei (Panel b: blue) were stained with ProLong™ Diamond Antifade Mountant with DAPI (Product # P36962). F-actin (Panel c: red) was stained with Rhodamine Phalloidin (Product # R415). Panel d represents the merged image showing predominant nuclear localization. Panel e represents untreated cells with reduced expression of EGR1. Panel f shows cells without the primary antibody to assess background. The images were captured at 60X magnification.

- Submitted by
- Invitrogen Antibodies (provider)
- Main image
- Experimental details
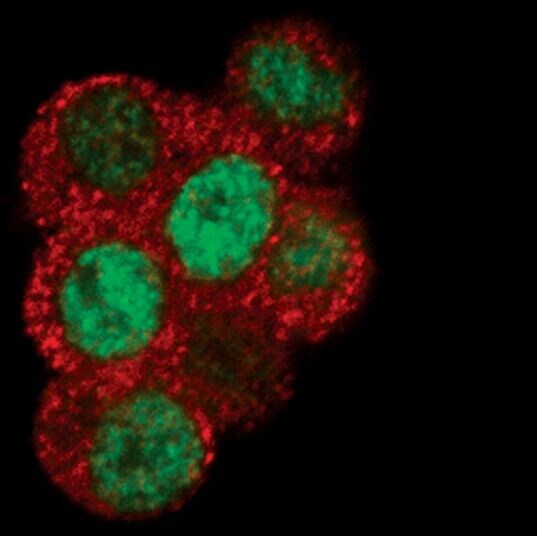
- Immunofluorescence analysis of EGR1 was performed using PC-12 cells treated with NGF (100 ng/mL for 2 hr) post 12 hr serum starvation. The cells were fixed with 4% paraformaldehyde for 10 minutes, permeabilized with 0.1% Triton™ X-100 for 15 minutes, and blocked with 1% BSA for 1 hour at room temperature. The cells were labeled with EGR1 Monoclonal Antibody (T.160.5) (Product # MA5-15009) at 1:100 dilution in 0.1% BSA, incubated at 4 °C overnight and then labeled with Goat anti-Rabbit IgG (Heavy Chain) Superclonal™ Recombinant Secondary Antibody, Alexa Fluor® 488 conjugate (Product # A27034) at a dilution of 1:2,000 for 45 minutes at room temperature (Panel a: green). Nuclei (Panel b: blue) were stained with ProLong™ Diamond Antifade Mountant with DAPI (Product # P36962). F-actin (Panel c: red) was stained with Rhodamine Phalloidin (Product # R415). Panel d represents the merged image showing predominant nuclear localization. Panel e represents untreated cells with reduced expression of EGR1. Panel f shows cells without the primary antibody to assess background. The images were captured at 60X magnification.
Supportive validation
- Submitted by
- Invitrogen Antibodies (provider)
- Main image
- Experimental details
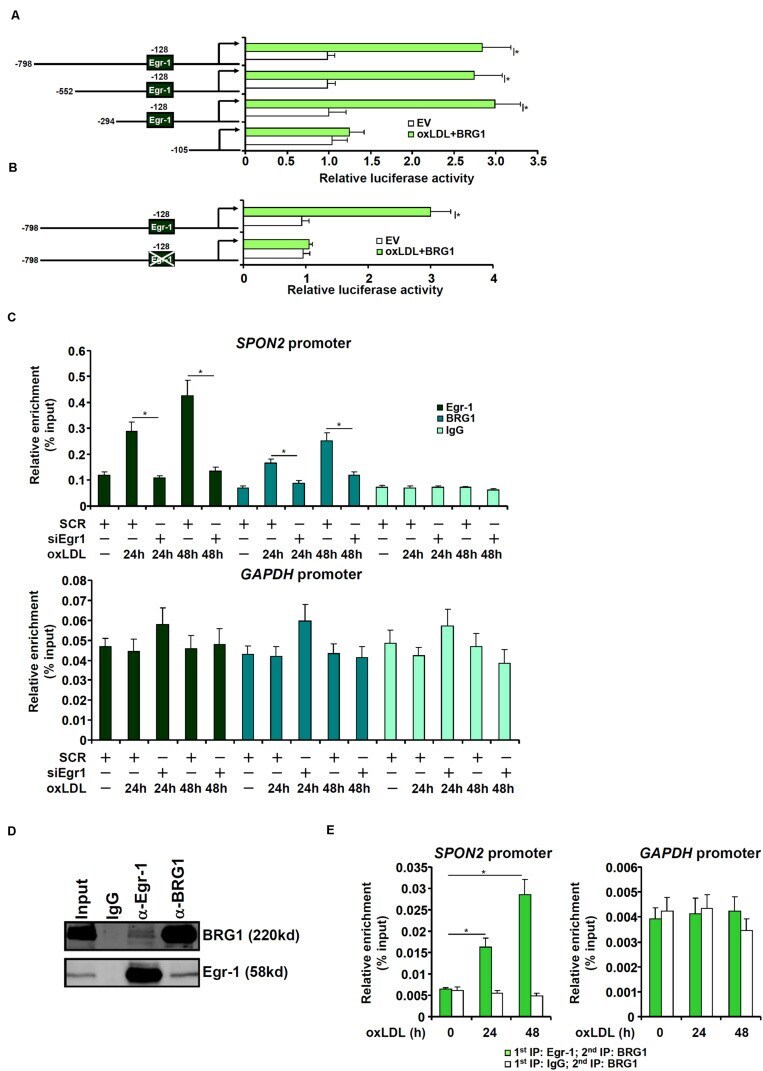
- FIGURE 5 BRG1 directly regulates SPON2 transcription in endothelial cells. (A) SPON2 promoter-luciferase constructs of various lengths were transfected into EAh926 cells with or without BRG1 followed by treatment with oxLDL (50 mug/mL) for 24 h. Luciferase activities were normalized by both protein concentration and GFP fluorescence. (B) Wild type or mutant SPON2 promoter-luciferase construct was transfected into EAhy926 cells with or without BRG1 followed by treatment with oxLDL (50 mug/mL) for 24 h. Luciferase activities were normalized by both protein concentration and GFP fluorescence. (C) EAhy926 cells were transfected with siRNA targeting Egr-1 or SCR followed by treatment with oxLDL (50 mug/mL) for 24 h.ChIP assays were performed with indicated antibodies. Inset, knockdown efficiency of Egr-1 was examined by Western. (D) EAhy926 cells were treated with oxLDL (50 mug/mL) for 24 h. Nuclear proteins were extracted and immunoprecipitated with indicated antibodies. (E) EAhy926 cells were treated with or without oxLDL (50 mug/mL) for 24 h. Re-ChIP assays were performed with indicated antibodies. Data represent averages of three independent experiments and error bars represent SEM. * p < 0.05.
- Submitted by
- Invitrogen Antibodies (provider)
- Main image
- Experimental details
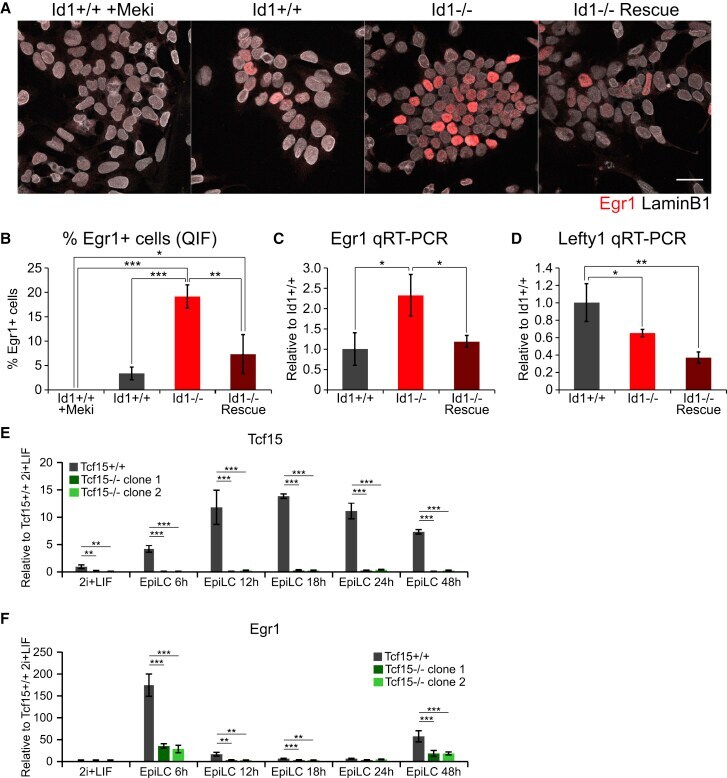
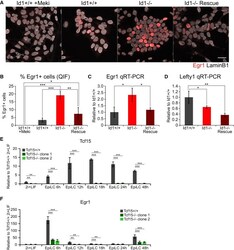
- Figure 5 Id1 Dampens FGF Responsiveness by Modulating the Activity of Tcf15 (A) Immunofluorescent staining for Egr1 and LaminB1 in wild-type, Id1-, Id1-rescue ESCs cultured in LIF + FCS. Wild-type cells cultured in LIF + FCS + 1 muM PD0325901 (+Meki) are included as a negative control. Scale bar, 30 mum. (B) Quantification of the IF data in (A). (C) qRT-PCR for the Fgf target Egr1 in wild-type, Id1-, and Id1-rescue ESCs cultured in LIF + FCS. (D) qRT-PCR for the Nodal target Lefty1 in wild-type, Id1-, and Id1-rescue ESCs cultured in LIF + FCS. (E) qRT-PCR for Tcf15 in wild-type and two Tcf15- clonal cell lines during 2i + LIF to EpiLC differentiation. (F) qRT-PCR for Egr1 in the samples described in (E). Data are presented as mean +- standard deviation of three independent experiments. Statistical analyses were performed using a one-way ANOVA followed by Tukey's multiple comparison test. * p < 0.05, ** p < 0.01, *** p < 0.001. See also Figure S5 .