 Explore
 Validate
 Learn
Learn Flow cytometry
Antibody data
- Antibody Data
- Antigen structure
- References [1]
- Comments [0]
- Validations
- Flow cytometry [1]
- Other assay [1]
Submit
Validation data
Reference
Comment
Report error
- Product number
- MHCD11C18 - Provider product page

- Provider
- Invitrogen Antibodies
- Product name
- CD11c Monoclonal Antibody (BU15), PE-Cyanine5.5
- Antibody type
- Monoclonal
- Antigen
- Other
- Description
- The R-phycoerythrin (PE)-Cy5.5® tandem conjugate permits simultaneous multicolor labeling and detection of multiple targets with excitation by a single excitation source-the 488 nm line of the argon-ion laser.
- Reactivity
- Human
- Host
- Mouse
- Isotype
- IgG
- Antibody clone number
- BU15
- Vial size
- 500 µL
- Storage
- 4° C, store in dark
Submitted references Subtype-Specific Surface Proteins on Adipose Tissue Macrophages and Their Association to Obesity-Induced Insulin Resistance.
Strand K, Stiglund N, Haugstøyl ME, Kamyab Z, Langhelle V, Lawrence-Archer L, Busch C, Cornillet M, Hjellestad ID, Nielsen HJ, Njølstad PR, Mellgren G, Björkström NK, Fernø J
Frontiers in endocrinology 2022;13:856530
Frontiers in endocrinology 2022;13:856530
No comments: Submit comment
Supportive validation
- Submitted by
- Invitrogen Antibodies (provider)
- Main image
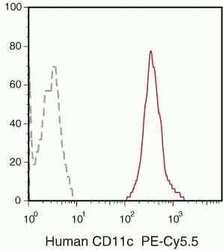
- Experimental details
- Human peripheral blood monocytes stained using PE-Cy5.5 conjugated anti-human CD11c monoclonal antibody (Product # MHCD11C18). The negative profile represents unstained cells.

Supportive validation
- Submitted by
- Invitrogen Antibodies (provider)
- Main image

- Experimental details
- Identification and characterization of macrophage populations in blood and adipose tissue of humans with obesity. (A) Flow cytometry gating scheme used to identify monocytes and macrophages. Arrows indicate the sequence of gating. (B) Representative flow cytometry plots showing CD206 and CD11c expression on monocytes (CD11c+CD206-), M1-(CD11c+CD206+) and M2-like (CD206+CD11c-) macrophages from PBMC, SAT, and VAT samples from one patient. (C) The total monocyte and macrophage population as a fraction of total CD45+ cells in PBMC (n=47), SAT (n=54), and VAT (n=54). (D) Monocytes, M1- and M2-like macrophages (MPhi) as a fraction of the total monocyte and macrophage population in PBMC (n=47), SAT (n=54), and VAT (n=54). (E) Representative stainings for the surface proteins shown in (F-L) . (F-L) Scatter plots showing expression of surface proteins (F) CCR2, (G) CD44, (H) CD16, (I) CD14, (J) HLA-DR, (K) CD40, and (L) CD163 on monocytes (grey), M1 (red)-, and M2 (blue)-like macrophages (MPhi's) from PBMC (n=47), SAT, and VAT (n=54). For (F, H, L) scatter plots showing percentage of cells expressing the proteins. For (G, I-K) scatter plots showing expression (mean fluorescence intensity, MFI) of surface proteins. For (C, D, F-L) line and error bars represent mean and SD. For (C, D) , the Mann-Whitney U -test was used for comparison between groups. **p< 0.01, ***p
