Explore
 Validate
 Learn
Learn Western blot
 ELISA
ELISAAntibody data
- Antibody Data
- Antigen structure
- References [2]
- Comments [0]
- Validations
- Western blot [2]
- Immunocytochemistry [4]
- Other assay [1]
Submit
Validation data
Reference
Comment
Report error
- Product number
- MA5-15595 - Provider product page

- Provider
- Invitrogen Antibodies
- Product name
- GOT2 Monoclonal Antibody (3E9)
- Antibody type
- Monoclonal
- Antigen
- Purifed from natural sources
- Description
- MA5-15595 targets GOT2 in indirect ELISA, IF and WB applications and shows reactivity with Human, mouse, Non-human primate, and Rat samples. The MA5-15595 immunogen is purified recombinant fragment of human GOT2 expressed in E. Coli. MA5-15595 detects GOT2 which has a predicted molecular weight of approximately 47kDa.
- Reactivity
- Human, Mouse, Rat
- Host
- Mouse
- Isotype
- IgG
- Antibody clone number
- 3E9
- Vial size
- 100 μL
- Concentration
- Conc. Not Determined
- Storage
- Store at 4°C short term. For long term storage, store at -20°C, avoiding freeze/thaw cycles.
Submitted references The role of glutamate oxaloacetate transaminases in sulfite biosynthesis and H(2)S metabolism.
APOBEC3G inhibits microRNA-mediated repression of translation by interfering with the interaction between Argonaute-2 and MOV10.
Mellis AT, Misko AL, Arjune S, Liang Y, Erdélyi K, Ditrói T, Kaczmarek AT, Nagy P, Schwarz G
Redox biology 2021 Jan;38:101800
Redox biology 2021 Jan;38:101800
APOBEC3G inhibits microRNA-mediated repression of translation by interfering with the interaction between Argonaute-2 and MOV10.
Liu C, Zhang X, Huang F, Yang B, Li J, Liu B, Luo H, Zhang P, Zhang H
The Journal of biological chemistry 2012 Aug 24;287(35):29373-83
The Journal of biological chemistry 2012 Aug 24;287(35):29373-83
No comments: Submit comment
Supportive validation
- Submitted by
- Invitrogen Antibodies (provider)
- Main image

- Experimental details
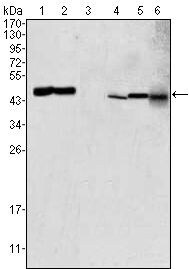
- Western blot analysis of GOT2 using GOT2 monoclonal antibody (Product # MA5-15595) in HEK293 (1), PC-12 (2), HL-60 (3), BCBL-1 (4), HepG2 (5) and NIH/3T3 (6) cell lysate.
- Submitted by
- Invitrogen Antibodies (provider)
- Main image
- Experimental details
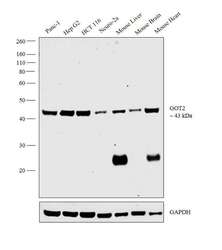
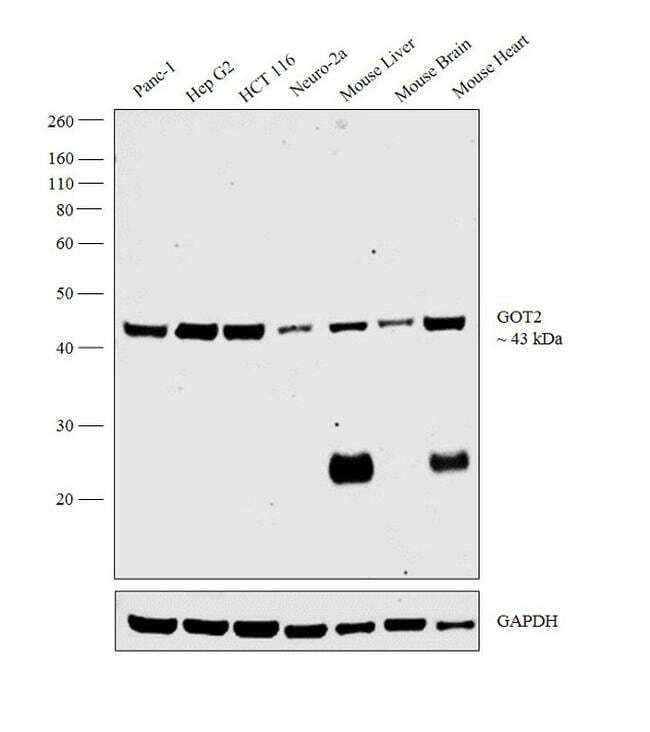
- Western blot analysis was performed on whole cell extracts (30 µg lysate) of Panc-1 (Lane 1), Hep G2 (Lane 2), HCT 116 (Lane 3), Neuro-2a (Lane 4), tissue extracts of Mouse Liver (Lane 5), Mouse Brain (Lane 6) and Mouse Heart (Lane 7). The blot was probed with Anti-GOT2 Monoclonal Antibody (Product # MA5-15595, 1:1000 dilution) and detected by chemiluminescence using Goat anti-Mouse IgG (H+L) Superclonal™ Secondary Antibody, HRP conjugate (Product # A28177, 0.25 µg/ml, 1:4000 dilution). A 43 kDa band corresponding to GOT2 was observed across cell lines and tissues tested. An additional band at 25 kDa was observed in Mouse Liver and Mouse Heart which can be due to the light chain of IgG.
Supportive validation
- Submitted by
- Invitrogen Antibodies (provider)
- Main image

- Experimental details
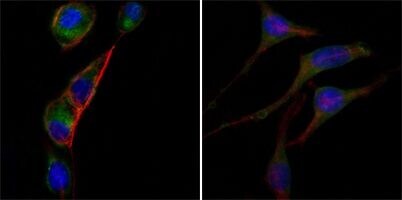
- Immunofluorescence analysis of PC-3 (left) and SK-BR-3 (right) cells using GOT2 monoclonal antibody (Product # MA5-15595) (Green). Blue: DRAQ5 fluorescent DNA dye. Red: Actin filaments have been labeled with DY-554 phalloidin.

- Submitted by
- Invitrogen Antibodies (provider)
- Main image
- Experimental details
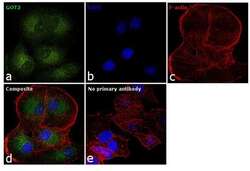
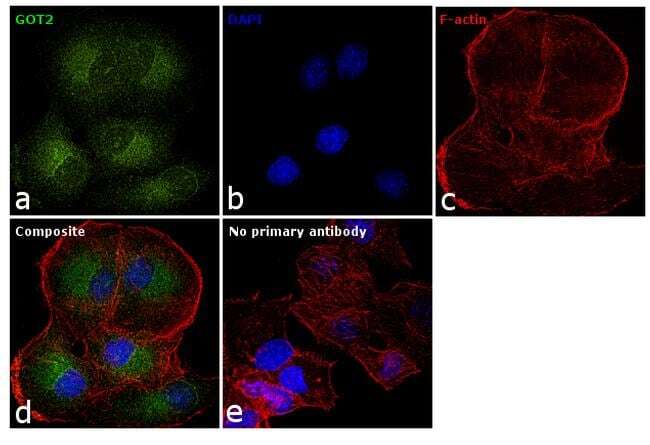
- Immunofluorescence analysis of GOT2 was performed using 70% confluent log phase PANC-1 cells. The cells were fixed with 4% paraformaldehyde for 10 minutes, permeabilized with 0.1% Triton™ X-100 for 15 minutes, and blocked with 1% BSA for 1 hour at room temperature. The cells were labeled with GOT2 Monoclonal Antibody (Product # MA5-15595) at 1:100 dilution in 0.1% BSA, incubated at 4 degree Celsius overnight and then labeled with Goat anti-Mouse IgG (H+L) Superclonal™ Secondary Antibody, Alexa Fluor® 488 conjugate (Product # A28175) at a dilution of 1:2000 for 45 minutes at room temperature (Panel a: green). Nuclei (Panel b: blue) were stained with SlowFade® Gold Antifade Mountant with DAPI (Product # S36938). F-actin (Panel c: red) was stained with Rhodamine Phalloidin (Product # R415, 1:300). Panel d represents the merged image showing cytosolic localization. Panel e represents control cells with no primary antibody to assess background. The images were captured at 60X magnification.

- Submitted by
- Invitrogen Antibodies (provider)
- Main image

- Experimental details
- Immunofluorescence analysis of PC-3 (left) and SK-BR-3 (right) cells using GOT2 monoclonal antibody (Product # MA5-15595) (Green). Blue: DRAQ5 fluorescent DNA dye. Red: Actin filaments have been labeled with DY-554 phalloidin.
- Submitted by
- Invitrogen Antibodies (provider)
- Main image

- Experimental details
- Immunofluorescence analysis of GOT2 was performed using 70% confluent log phase PANC-1 cells. The cells were fixed with 4% paraformaldehyde for 10 minutes, permeabilized with 0.1% Triton™ X-100 for 15 minutes, and blocked with 1% BSA for 1 hour at room temperature. The cells were labeled with GOT2 Monoclonal Antibody (Product # MA5-15595) at 1:100 dilution in 0.1% BSA, incubated at 4 degree Celsius overnight and then labeled with Goat anti-Mouse IgG (H+L) Superclonal™ Secondary Antibody, Alexa Fluor® 488 conjugate (Product # A28175) at a dilution of 1:2000 for 45 minutes at room temperature (Panel a: green). Nuclei (Panel b: blue) were stained with SlowFade® Gold Antifade Mountant with DAPI (Product # S36938). F-actin (Panel c: red) was stained with Rhodamine Phalloidin (Product # R415, 1:300). Panel d represents the merged image showing cytosolic localization. Panel e represents control cells with no primary antibody to assess background. The images were captured at 60X magnification.
Supportive validation
- Submitted by
- Invitrogen Antibodies (provider)
- Main image
- Experimental details
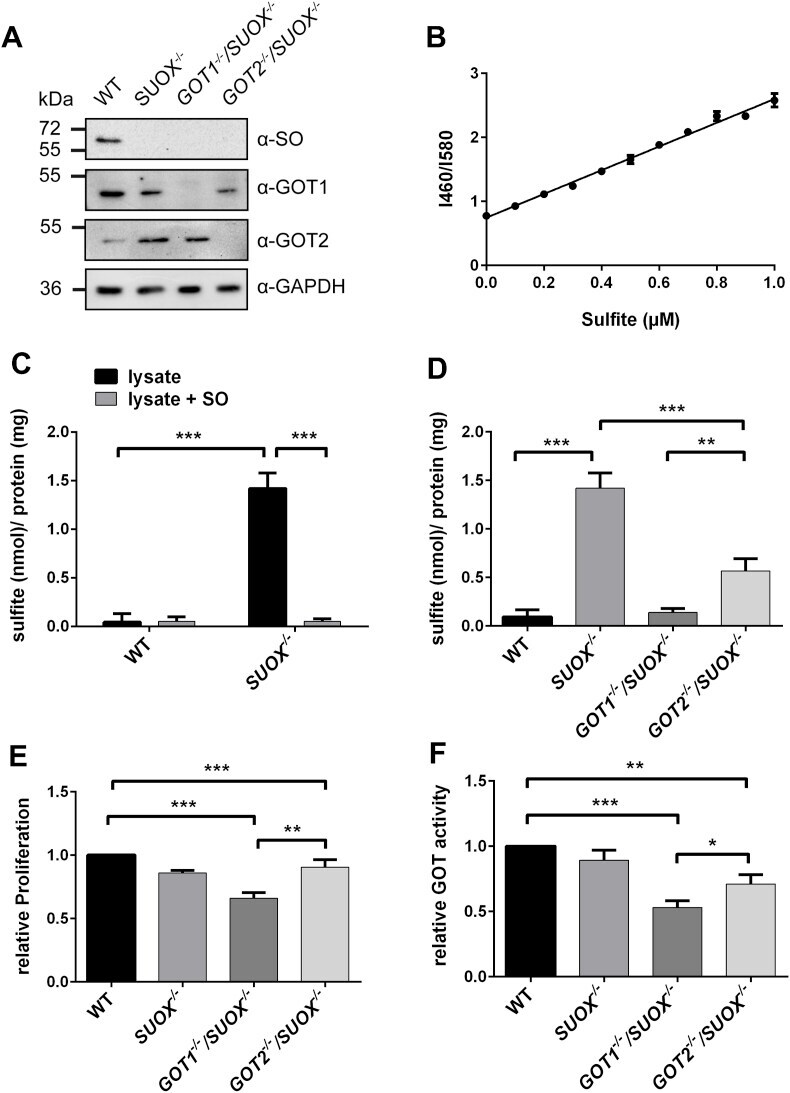
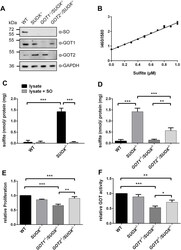
- Fig. 2 Contribution of GOT1 and GOT2 to cellular sulfite production . A. Western Blot of HEK293 lysates confirming knockout of SO, GOT1 and GOT2 (n = 3). B. Sulfite standard curve used for the determination of sulfite concentration from cellular extracts (n = 3). C. Sulfite measurement from cell extracts of WT and SUOX -/- cells with and without addition of purified SO (n = 4). Sulfite levels were normalized to cellular protein concentration. Error bars indicate standard deviation. Two-way ANOVA with Tukey's post-hoc test for pairwise comparisons was performed as indicated. p value: ***