Explore
 Validate
 Learn
Learn Western blot
 Immunocytochemistry
Antibody data
- Antibody Data
- Antigen structure
- References [1]
- Comments [0]
- Validations
- Immunocytochemistry [3]
- Immunohistochemistry [1]
- Other assay [3]
Submit
Validation data
Reference
Comment
Report error
- Product number
- PA5-53990 - Provider product page

- Provider
- Invitrogen Antibodies
- Product name
- EOGT Polyclonal Antibody
- Antibody type
- Polyclonal
- Antigen
- Recombinant protein fragment
- Description
- Immunogen sequence: NEAPPNTHSI PGEPLYNYAS IRLPEEHIPF FLHNNRHIAT VCRKDSLCPY KKHLEKLKYC WGYEKSCKPE FRFGYPVCSY VDMGWTDTLE SAEDIFWKQA DFGYARERLE EMHVLCQPKE TSDSSLVCSR YLQ Highest antigen sequence identity to the following orthologs: Mouse - 74%, Rat - 74%.
- Reactivity
- Human
- Host
- Rabbit
- Isotype
- IgG
- Vial size
- 100 μL
- Concentration
- 0.1 mg/mL
- Storage
- Store at 4°C short term. For long term storage, store at -20°C, avoiding freeze/thaw cycles.
Submitted references EOGT Correlated With Immune Infiltration: A Candidate Prognostic Biomarker for Hepatocellular Carcinoma.
Shu Y, He L, Gao M, Xiao F, Yang J, Wang S, Wei H, Zhang F, Wei H
Frontiers in immunology 2021;12:780509
Frontiers in immunology 2021;12:780509
No comments: Submit comment
Supportive validation
- Submitted by
- Invitrogen Antibodies (provider)
- Main image
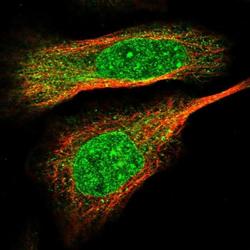
- Experimental details
- Immunofluorescent staining of EOGT in human cell line U-2 OS shows positivity in nuclear membrane, cytoplasm & nucleus but excluded from the nucleoli. Samples were probed using an EOGT Polyclonal Antibody (Product # PA5-53990).

- Submitted by
- Invitrogen Antibodies (provider)
- Main image

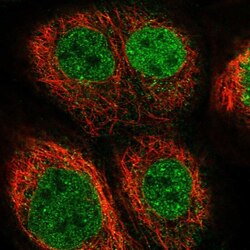
- Experimental details
- Immunofluorescent staining of EOGT in human cell line A-431 using an EOGT Polyclonal Antibody (Product # PA5-53990) shows localization to nucleoplasm and nuclear membrane.

- Submitted by
- Invitrogen Antibodies (provider)
- Main image
- Experimental details
- Immunofluorescent staining of EOGT in human cell line A-431 using an EOGT Polyclonal Antibody (Product # PA5-53990) shows localization to nucleoplasm and nuclear membrane.

Supportive validation
- Submitted by
- Invitrogen Antibodies (provider)
- Main image
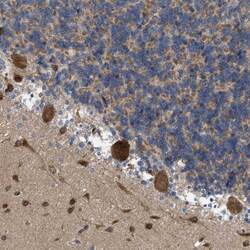
- Experimental details
- Immunohistochemical analysis of EOGT in human cerebellum using EOGT Polyclonal Antibody (Product # PA5-53990) shows strong cytoplasmic positivity in Purkinje cells.

Supportive validation
- Submitted by
- Invitrogen Antibodies (provider)
- Main image
- Experimental details
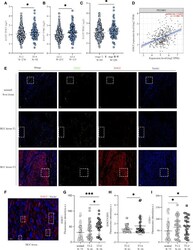
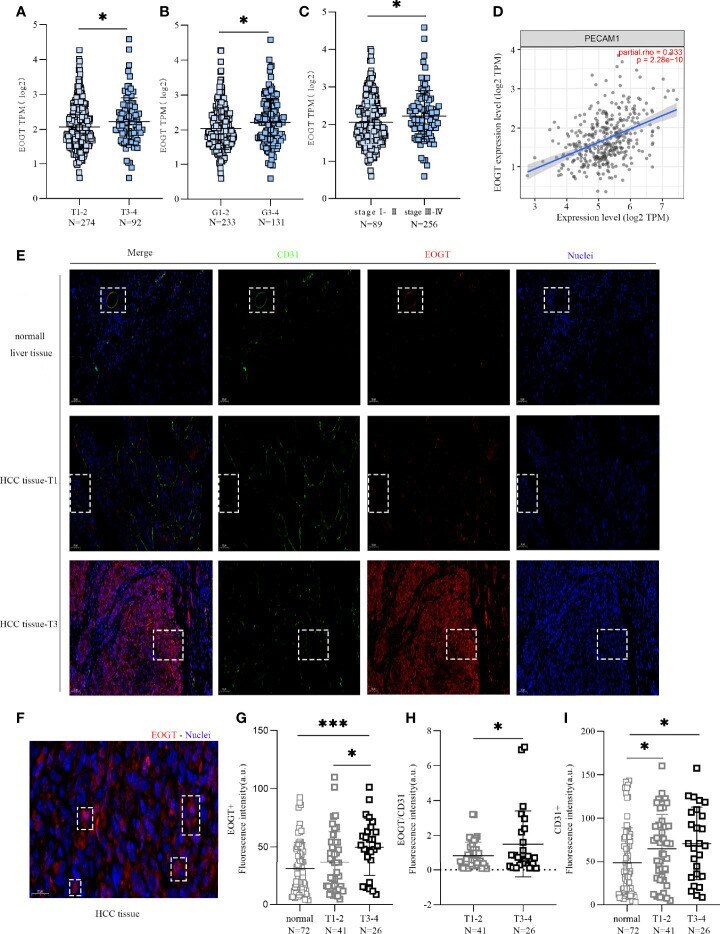
- Figure 3 High-EOGT expression was associated with tumor staging, including TNM stage (A) , grade (B) , and stage (C) . (D) Correlation of EOGT expression with PECAM1 (CD31). (E) Immunofluorescent staining of EOGT (red), CD31 (green), and DAPI (blue) in normal liver tissues, T1 stage HCC tissues, and T3 stage HCC tissues. (F) Immunofluorescent staining of EOGT (red) and DAPI (blue) in HCC tissue. (G) Quantification of EOGT-positive signal in normal liver tissues ( n = 72), T1-2 stage HCC tissues ( n = 41), and T3-4 stage HCC tissues ( n = 26). Values represent mean +- SEM expressed as arbitrary units (AU) of EOGT-positive area normalized by total tumor area. (H) Quantification of EOGT normalized by CD31 (EOGT/CD31) in T1-2 stage HCC tissues ( n = 41) and T3-4 stage HCC tissues ( n = 26). (I) Quantification of CD31-positive signal in normal liver tissues ( n = 72), T1-2 stage HCC tissues ( n = 41), and T3-4 stage HCC tissues ( n = 26). Values represent mean +- SEM expressed as arbitrary units (AU) of CD31-positive area normalized by total tumor area (* P < 0.05, *** P < 0.001).
- Submitted by
- Invitrogen Antibodies (provider)
- Main image
- Experimental details
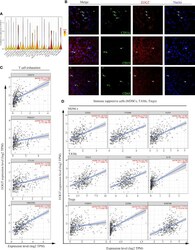
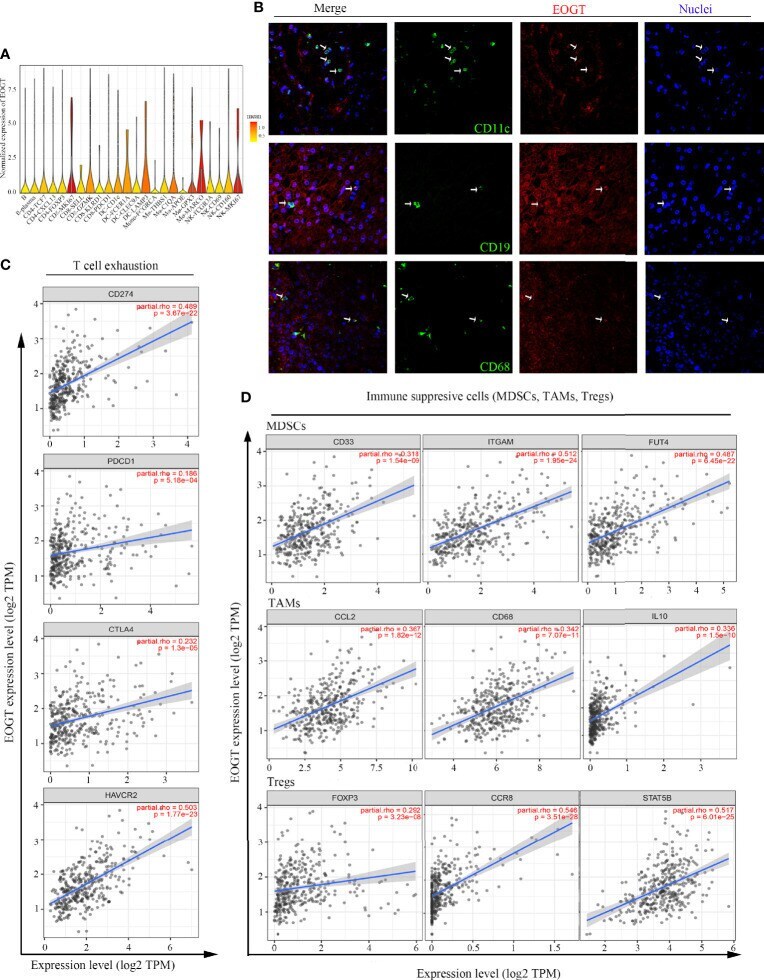
- Figure 8 Analysis of immune cell infiltration in HCC. (A) EOGT expression was highly expressed on different immune cell subsets according to single-cell RNA-sequencing results of six HCC patients. (B) Immunofluorescent staining of EOGT (red), CD11c (green), CD19 (green), CD68 (green), and DAPI (blue) in HCC tissue. (C) Correlations of EOGT expression with immunosuppressive molecules (PD-L1, PD-1, CTLA4, and HAVCR2) involved in T-cell exhaustion. (D) Correlations of EOGT expression with markers of immunosuppressive cells (MDSCs, TAMs, and Tregs).
- Submitted by
- Invitrogen Antibodies (provider)
- Main image

- Experimental details
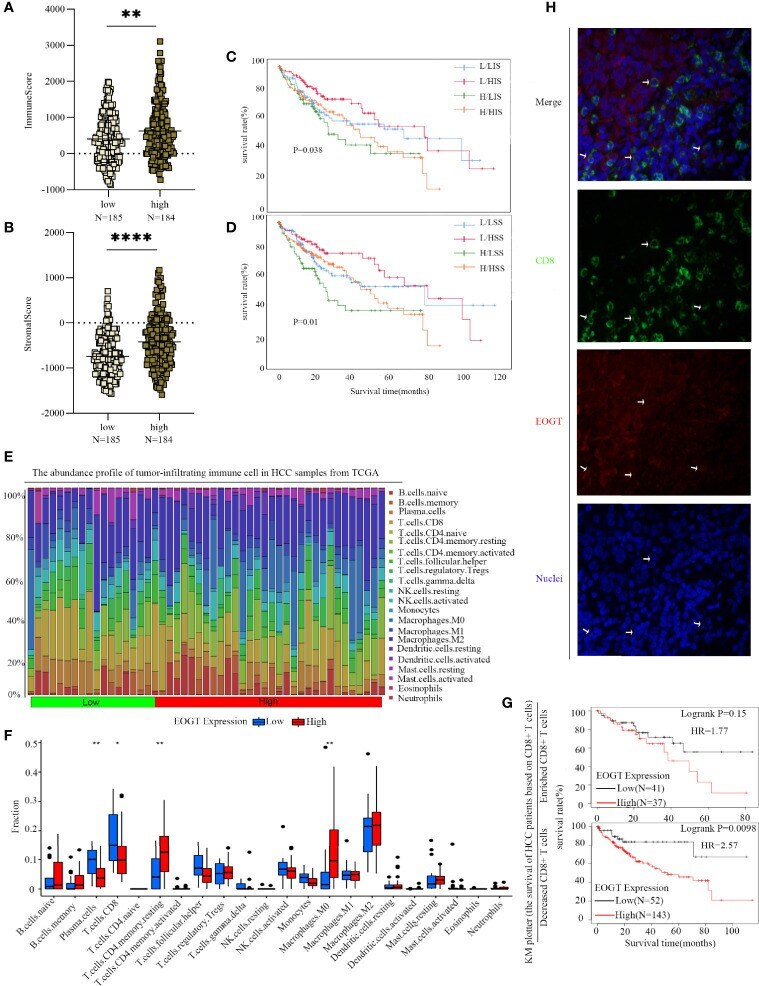
- Figure 9 Differences of immune scores (A) and stromal scores (B) between EOGT-low and EOGT-high expression subgroups. (C, D) KM survival curve of OS based on immune scores, stromal scores, and EOGT expression levels. L and H, respectively, represented the low-EOGT and high-EOGT expression groups. LIS and HIS, respectively, represented low-immune scores group and high-immune scores group. LSS and HSS, respectively, represented low-stromal scores group and high-stromal scores group. (E) Twenty-two tumor-infiltrating immune cells in HCC samples were estimated using the CIBERSORT algorithm. (F) The proportion of 22 tumor-infiltrating immune cells in HCC samples with high- and low-EOGT expression. (G) KM curves of OS in HCC samples based on EOGT expression and the levels of tumor-infiltrating CD8 + T cells. (H) Immunofluorescent staining of EOGT (red), CD8 (green), and DAPI (blue) in HCC tissues (* P < 0.05, ** P < 0.01, **** P < 0.0001).