Explore
 Validate
 Learn
LearnMA1-10290
antibody from Invitrogen Antibodies
Targeting: CD81
TAPA-1, TAPA1, TSPAN28
 Western blot Immunocytochemistry
 Immunoprecipitation Immunohistochemistry Flow cytometry Other assay
Antibody data
- Antibody Data
- Antigen structure
- References [3]
- Comments [0]
- Validations
- Western blot [1]
- Immunocytochemistry [1]
- Flow cytometry [2]
- Other assay [2]
Submit
Validation data
Reference
Comment
Report error
- Product number
- MA1-10290 - Provider product page

- Provider
- Invitrogen Antibodies
- Product name
- CD81 Monoclonal Antibody (M38)
- Antibody type
- Monoclonal
- Antigen
- Other
- Description
- This antibody reacts with an extracellular epitope of CD81, a 25 kDa member of the tetraspanin family, expressed on majority of cells. Western Blot: non-reducing conditions.
- Reactivity
- Human, Feline, Rabbit
- Host
- Mouse
- Isotype
- IgG
- Antibody clone number
- M38
- Vial size
- 100 µg
- Concentration
- 1 mg/mL
- Storage
- 4° C, do not freeze
Submitted references Circulating exosomal microRNAs as novel potential detection biomarkers in pancreatic cancer.
Human Immunodeficiency Virus-Associated Exosomes Promote Kaposi's Sarcoma-Associated Herpesvirus Infection via the Epidermal Growth Factor Receptor.
Exosomes derived from HIV-1-infected cells promote growth and progression of cancer via HIV TAR RNA.
Wu L, Zhou WB, Zhou J, Wei Y, Wang HM, Liu XD, Chen XC, Wang W, Ye L, Yao LC, Chen QH, Tang ZG
Oncology letters 2020 Aug;20(2):1432-1440
Oncology letters 2020 Aug;20(2):1432-1440
Human Immunodeficiency Virus-Associated Exosomes Promote Kaposi's Sarcoma-Associated Herpesvirus Infection via the Epidermal Growth Factor Receptor.
Chen L, Feng Z, Yuan G, Emerson CC, Stewart PL, Ye F, Jin G
Journal of virology 2020 Apr 16;94(9)
Journal of virology 2020 Apr 16;94(9)
Exosomes derived from HIV-1-infected cells promote growth and progression of cancer via HIV TAR RNA.
Chen L, Feng Z, Yue H, Bazdar D, Mbonye U, Zender C, Harding CV, Bruggeman L, Karn J, Sieg SF, Wang B, Jin G
Nature communications 2018 Nov 2;9(1):4585
Nature communications 2018 Nov 2;9(1):4585
No comments: Submit comment
Supportive validation
- Submitted by
- Invitrogen Antibodies (provider)
- Main image
- Experimental details
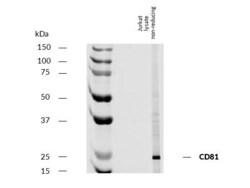
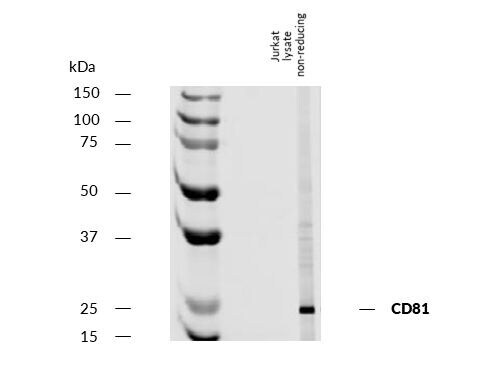
- Western blotting analysis of human CD81 using mouse monoclonal antibody M38 on lysate of Jurkat cell line under non-reducing conditions. Nitrocellulose membrane was probed with 2µg/mL of mouse anti-human CD81 monoclonal Monoclonal antibody (Product # MA1-10290) M38 followed by IRDye800-conjugated anti-mouse secondary antibody. A specific band was detected for CD81 at approximately 25 kDa.
Supportive validation
- Submitted by
- Invitrogen Antibodies (provider)
- Main image
- Experimental details
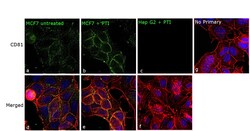
- Immunofluorescence analysis of CD81 antigen was performed using 70% confluent log phase MCF7 cells (a), MCF7 treated with Protein transport inhibitor (PTI) (1X for 4hrs) (b), and Hep G2 treated with Protein transport inhibitor (PTI) (1X for 4hrs) (c). The cells were fixed with 4% paraformaldehyde for 5 minutes, permeabilized with 0.1% Triton™ X-100 for 15 minutes, and blocked with 2% BSA for overnight at room temperature. The cells were labeled with CD81 Monoclonal Antibody (M38) (Product # MA1-10290) at 1:100 dilution in 0.1% BSA, incubated at 4 degree celsius overnight and then labeled with Donkey anti-Mouse IgG (H+L) Highly Cross-Adsorbed Secondary Antibody, Alexa Fluor Plus 488 (Product # A32766), (1:2000 dilution), for 45 minutes at room temperature (Panel a, b, c: Green). Nuclei (Panel d, e, f: Blue) were stained with ProLong™ Diamond Antifade Mountant with DAPI (Product # P36962). F-actin (Panel d, e, f, g: Red) was stained with Rhodamine Phalloidin (Product # R415, 1:300). Panel d, e represents the merged image showing peroxisomes, vesicles, ER, membrane localization. Panel c, f represents Hep G2 showing no expression. Panel g represents control cells with no primary antibody to assess background. The images were captured at 60X magnification.

Supportive validation
- Submitted by
- Invitrogen Antibodies (provider)
- Main image
- Experimental details
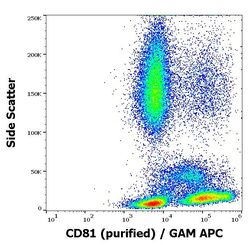
- Flow cytometry surface staining pattern of human peripheral blood stained using anti-human CD81 (M38) purified Monoclonal antibody (Product # MA1-10290) (concentration in sample 4 µg/mL) GAM APC.

- Submitted by
- Invitrogen Antibodies (provider)
- Main image

- Experimental details
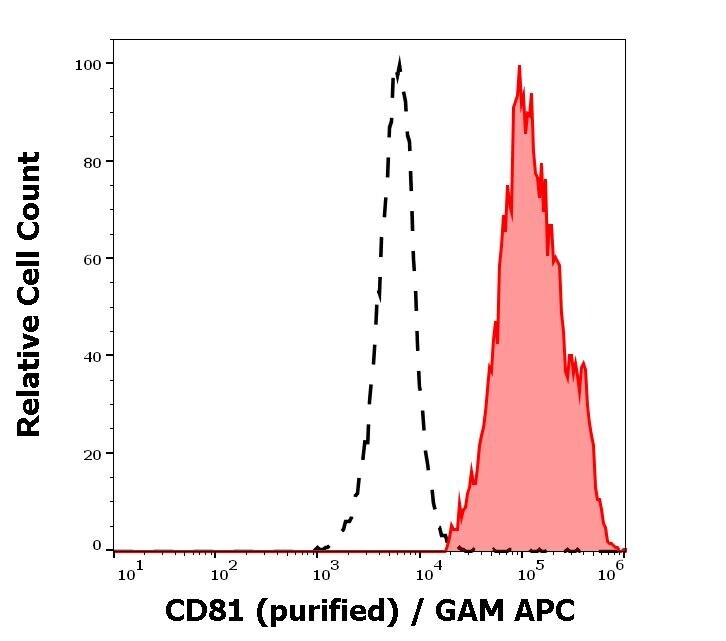
- Separation of human lymphocytes (red-filled) from neutrophil granulocytes (black-dashed) in flow cytometry analysis (surface staining) of human peripheral whole blood stained using anti-human CD81 (M38) purified Monoclonal antibody (Product # MA1-10290) (concentration in sample 4 µg/mL) GAM APC.
Supportive validation
- Submitted by
- Invitrogen Antibodies (provider)
- Main image

- Experimental details
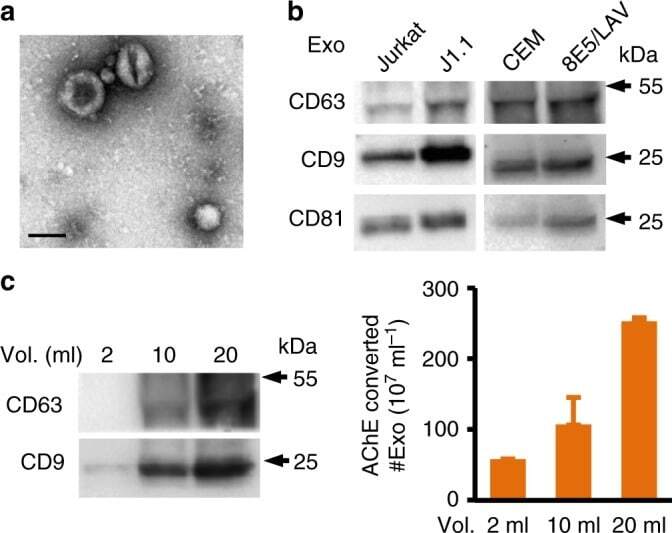
- Fig. 1 Characterization of exosomes from HIV-infected T cells. a Transmission electron microscope (TEM) images of exosomes isolated from T-cell culture supernatants. The representative J1.1 cell exosome image is shown. Scale bar, 100 nm. b Immunoblot of CD63, CD9, and CD81 on proteins extracted from T-cell line exosomes (whole scans of blots in Supplementary Figure 1). c CD63 and CD9 immunoblot (left) and AChE assays (right) of J1.1 exosomes isolated from 2, 10, and 20 ml of culture supernatants. Error bars, +- s.d. Data shown one experiment from three biological repeats. Numbers of exosomes (#Exo) were calculated by AChE activity using a standard provided by SBI
- Submitted by
- Invitrogen Antibodies (provider)
- Main image

- Experimental details
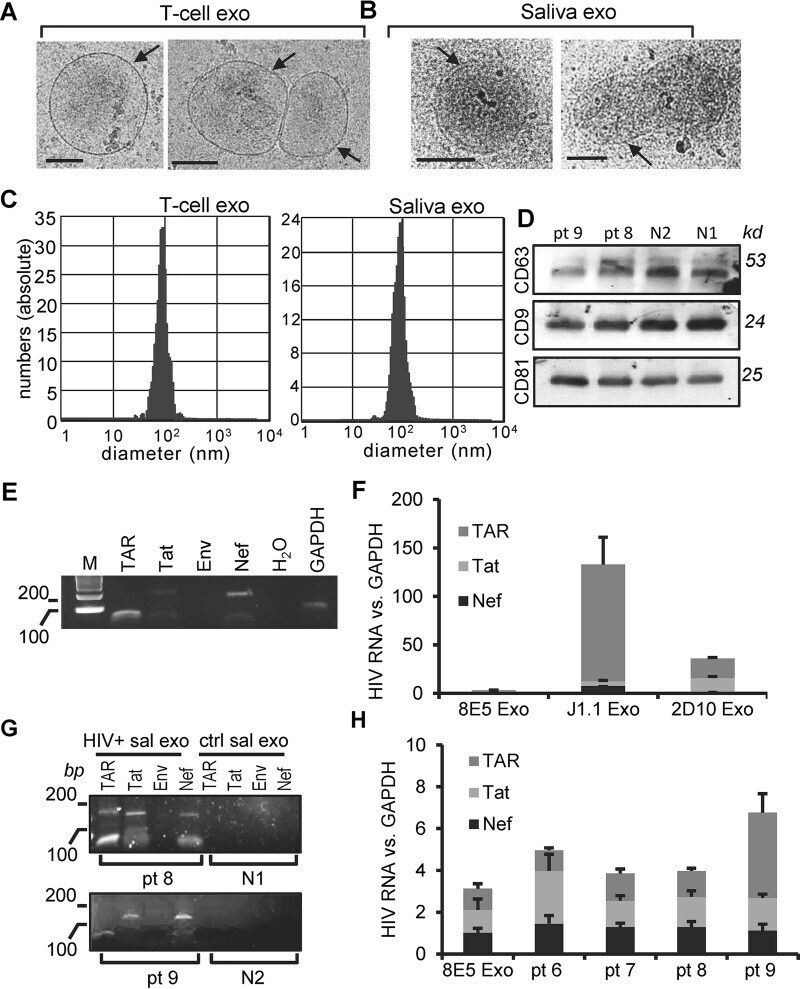
- FIG 1 Characterization of HIV-associated saliva exosomes. (A and B) Cryo-EM images of exosomes (exo) from Jurkat T cells (A) and the saliva of healthy donors (B). Arrows, exosome membrane. Bars, 100 nm. (C) Size distribution of exosomes from the culture supernatants of Jurkat T cells (T-cell exo) and the saliva of healthy donors (Saliva exo) determined with the ZetaView nanoparticle tracking analyzer. (D) Immunoblot images of total proteins extracted from saliva exosomes from HIV + (pt 8 and pt 9) and healthy (N1 and N2) donors. kd , kilodaltons. (E) RT-PCR gel images of the HIV TAR (60 bp), Tat (192 bp), Env (168 bp), and Nef (175 bp) PCR products in exosomes isolated from the culture supernatants of J1.1 cells. Lane M, molecular size markers (with the numbers to the left indicating molecular sizes [in base pairs]). (F) Quantitative RT-PCR of TAR, Tat, and Nef RNAs on total RNA extracted from exosomes secreted from HIV + 8E5/LAV (8E5), J1.1, and 2D10 T cells. The levels of HIV RNAs of exosomes from J1.1 and 2D10 cells were compared to those of exosomes from 8E5/LAV cells containing a single copy of the HIV proviral genome. (G) RT-PCR gel images of HIV TAR, Tat, Env, and Nef amplimers in saliva exosomes (sal exo) purified from HIV + (pt 8 and pt 9) and healthy (N1 and N2) donors. Note a nonspecific, ~170-bp PCR band in the TAR lane for pt 8. (H) Quantitative RT-PCR of TAR, Tat, and Nef RNAs in exosomes purified from the saliva of HIV + donors (pt 6 to pt 9). Exosomal RNA from