Explore
 Validate
 Learn
Learn Western blot
Antibody data
- Antibody Data
- Antigen structure
- References [0]
- Comments [0]
- Validations
- Western blot [1]
- ELISA [1]
- Other assay [2]
Submit
Validation data
Reference
Comment
Report error
- Product number
- TA347107 - Provider product page

- Provider
- OriGene
- Product name
- Rabbit Polyclonal CTCF Antibody
- Antibody type
- Polyclonal
- Description
- Rabbit Polyclonal CTCF Antibody
- Host
- Rabbit
- Conjugate
- Unconjugated
- Epitope
- CTCF
- Isotype
- IgG
- Antibody clone number
- NULL
- Vial size
- 50 µg
- Concentration
- 2.5 ?g/?l
No comments: Submit comment
Supportive validation
- Submitted by
- OriGene (provider)
- Main image

- Experimental details
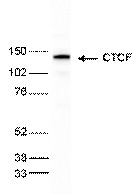
- WB using the antibody against CTCF diluted 1:1,000 in TBS-Tween containing 5% skimmed milk. The position of the protein of interest is indicated on the right; the marker (in kDa) is shown on the left.
- Validation comment
- WB
Supportive validation
- Submitted by
- OriGene (provider)
- Main image
- Experimental details
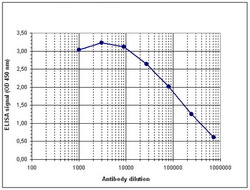
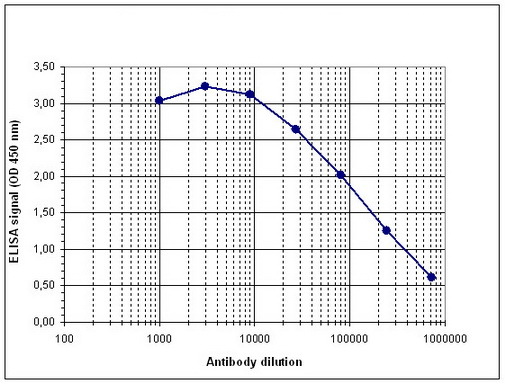
- Determination of the antibody titer To determine the titer of the antibody, an ELISA was performed using a serial dilution of the antibody against CTCF. The plates were coated with the peptides used for immunization of the rabbit. By plotting the absorbance against the antibody dilution (Figure 3), the titer of the antibody was estimated to be 1:143,000.
- Validation comment
- ELISA
Supportive validation
- Submitted by
- OriGene (provider)
- Main image
- Experimental details
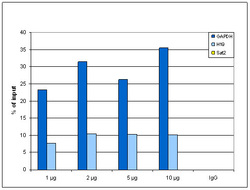
- ChIP was performed with the ab against CTCF on sheared chromatin from 4,000,000 HeLa cells. A titration of 1, 2, 5 and 10 ug ab was used. IgG (2 ug/IP) was negative control. qPCR was performed with optimized primers for the H19 imprinting control region, and a specific region in the GAPDH geneas positive controls, and for the Sat2 satellite repeat region, negative control. Image shows the recovery, expressed as a % of input (the relative amount of IP'd DNA compared to input DNA after qPCR).
- Validation comment
- Assay

- Submitted by
- OriGene (provider)
- Main image
- Experimental details
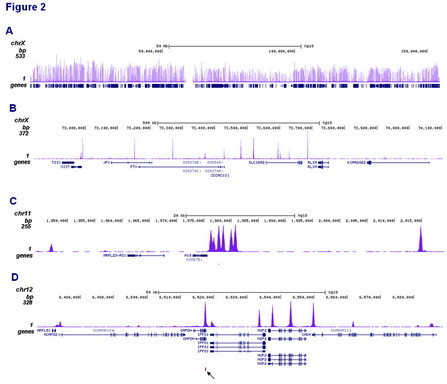
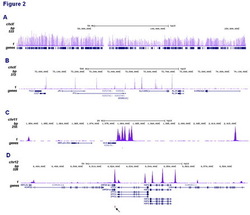
- ChIP was performed on sheared chromatin from 4,000,000 HeLa cells using 1 ug antibody. The IP'd DNA was subsequently analysed on an Illumina HiSeq 2000. The 50 bp tags were aligned to the human genome using the BWA algorithm. Image shows the peak distribution along the complete sequence and a 3 mb region of the X-chromosome and in two regions surrounding the H19 and GAPDH positive control genes, respectively (C, D and E). The position of the amplicon used for ChIP-qPCR is indicated by an arrow.
- Validation comment
- Assay