Explore
 Validate
 Learn
LearnPA5-88115
antibody from Invitrogen Antibodies
Targeting: CTCF
CFAP108, FAP108
 Western blot
 ELISA Immunocytochemistry Immunoprecipitation Immunohistochemistry Chromatin Immunoprecipitation Other assay
Antibody data
- Antibody Data
- Antigen structure
- References [1]
- Comments [0]
- Validations
- Western blot [3]
- Immunocytochemistry [7]
- Immunoprecipitation [1]
- Chromatin Immunoprecipitation [3]
- Other assay [2]
Submit
Validation data
Reference
Comment
Report error
- Product number
- PA5-88115 - Provider product page

- Provider
- Invitrogen Antibodies
- Product name
- CTCF Polyclonal Antibody
- Antibody type
- Polyclonal
- Antigen
- Recombinant full-length protein
- Description
- Immunogen sequence: MEGDAVEAIV EESETFIKGK ERKTYQRRRE GGQEEDACHL PQNQTDGGEV VQDVNSSVQM VMMEQLDPTL LQMKTEVMEG TVAPEAEAAV DDTQIITLQV VNMEEQPINI GELQLVQVPV PVTVPVATTS VEELQGAYEN EVSKEGLAES EPMICHTLPL PEGFQVVKVG ANGEVETLEQ GELPPQEDPS WQKDPDYQPP AKKTKKTKKS KLRYTEEGKD VDVSVYDFEE EQQEGLLSEV NAEKVVGNMK PPKPTKIKKK; Positive Samples: 293T, Jurkat; Cellular Location: Chromosome, Nucleus, centromere, nucleoplasm
- Reactivity
- Human, Mouse, Rat
- Host
- Rabbit
- Isotype
- IgG
- Vial size
- 100 μL
- Concentration
- 0.5 mg/mL
- Storage
- -20°C, Avoid Freeze/Thaw Cycles
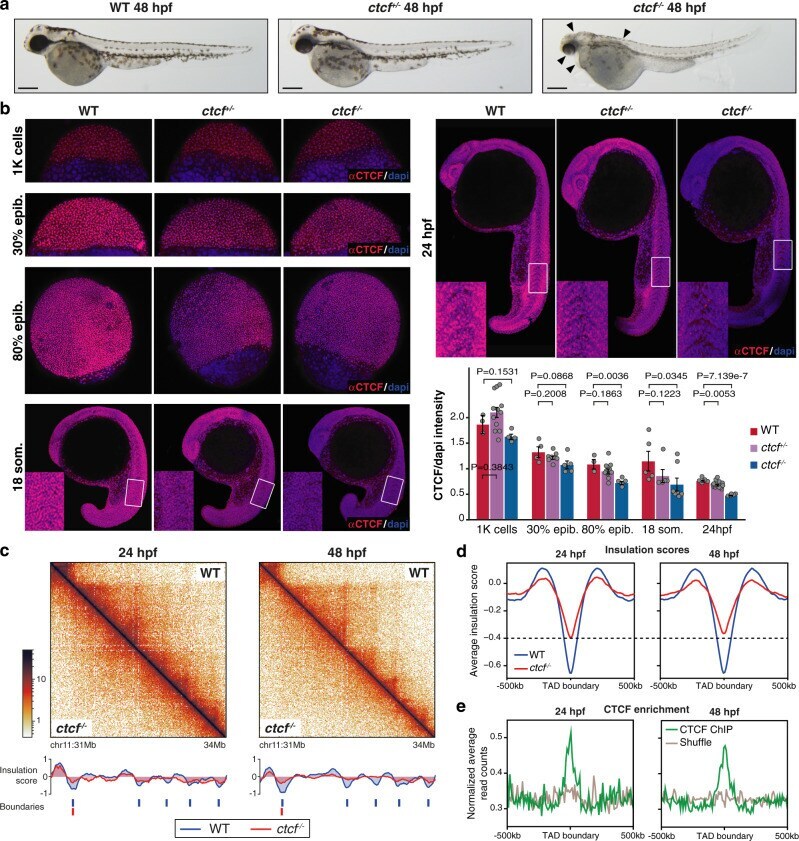
Submitted references CTCF knockout in zebrafish induces alterations in regulatory landscapes and developmental gene expression.
Franke M, De la Calle-Mustienes E, Neto A, Almuedo-Castillo M, Irastorza-Azcarate I, Acemel RD, Tena JJ, Santos-Pereira JM, Gómez-Skarmeta JL
Nature communications 2021 Sep 13;12(1):5415
Nature communications 2021 Sep 13;12(1):5415
No comments: Submit comment
Supportive validation
- Submitted by
- Invitrogen Antibodies (provider)
- Main image
- Experimental details
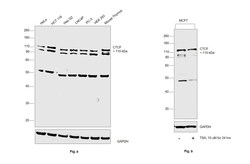
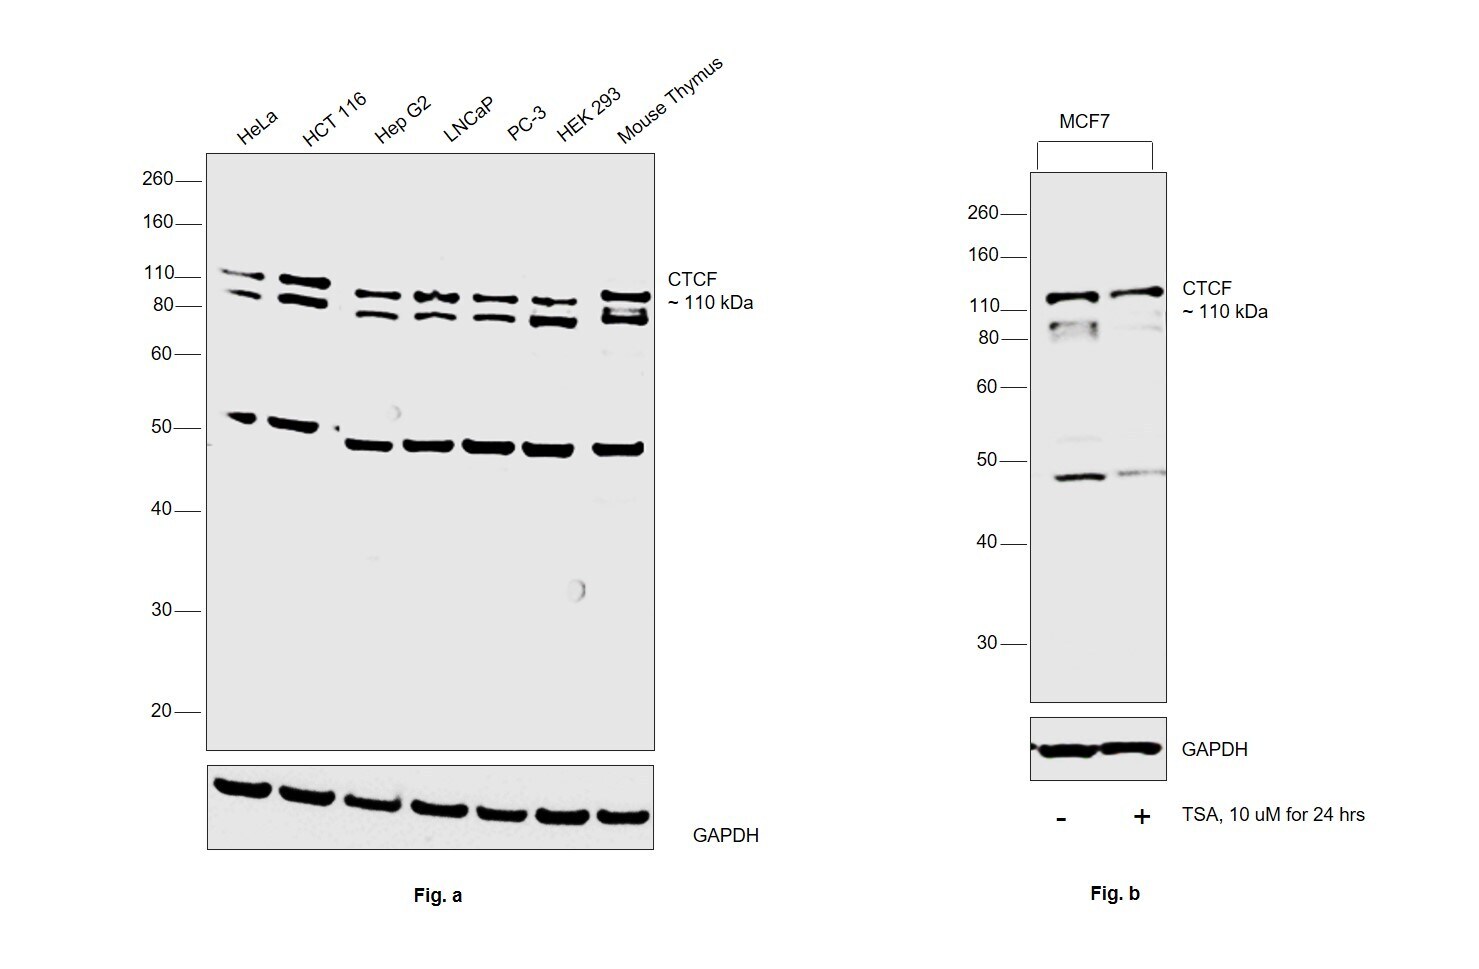
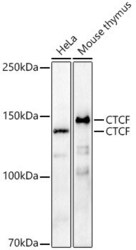
- Western blot was performed using Anti-CTCF Polyclonal Antibody (Product # PA5-88115) and a 110 kDa band corresponding to CTCF was observed across samples tested. The expression was reduced in MCF7 upon Trichostatin A treatment. Nuclear enriched extracts (30 µg lysate) of HeLa (Lane 1), HCT 116 (Lane 2), Hep G2 (Lane 3), LNCaP (Lane 4), PC-3 (Lane 5), HEK-293 (Lane 6), Mouse Thymus (Lane 7) in Fig. a; MCF7 (Lane 1), MCF7 treated with Trichostatin A (10 µM for 24 hrs) (Lane 2) in Fig.b were electrophoresed using NuPAGE™ 4-12% Bis-Tris Protein Gel (Product # NP0321BOX). Resolved proteins were then transferred onto a nitrocellulose membrane (Product # IB23001) by iBlot® 2 Dry Blotting System (Product # IB21001). The blot was probed with the primary antibody (1:1000 dilution) and detected by chemiluminescence with Goat anti-Rabbit IgG (Heavy Chain) Superclonal™ Recombinant Secondary Antibody, HRP (Product # A27036,1:20000 dilution using the iBright™ FL1500 Imaging System (Product # A44115). Chemiluminescent detection was performed using SuperSignal™ West Pico PLUS Chemiluminescent Substrate (Product # 34580). Additional uncharacterized bands at ~90, ~50 kDa were observed.
- Submitted by
- Invitrogen Antibodies (provider)
- Main image

- Experimental details
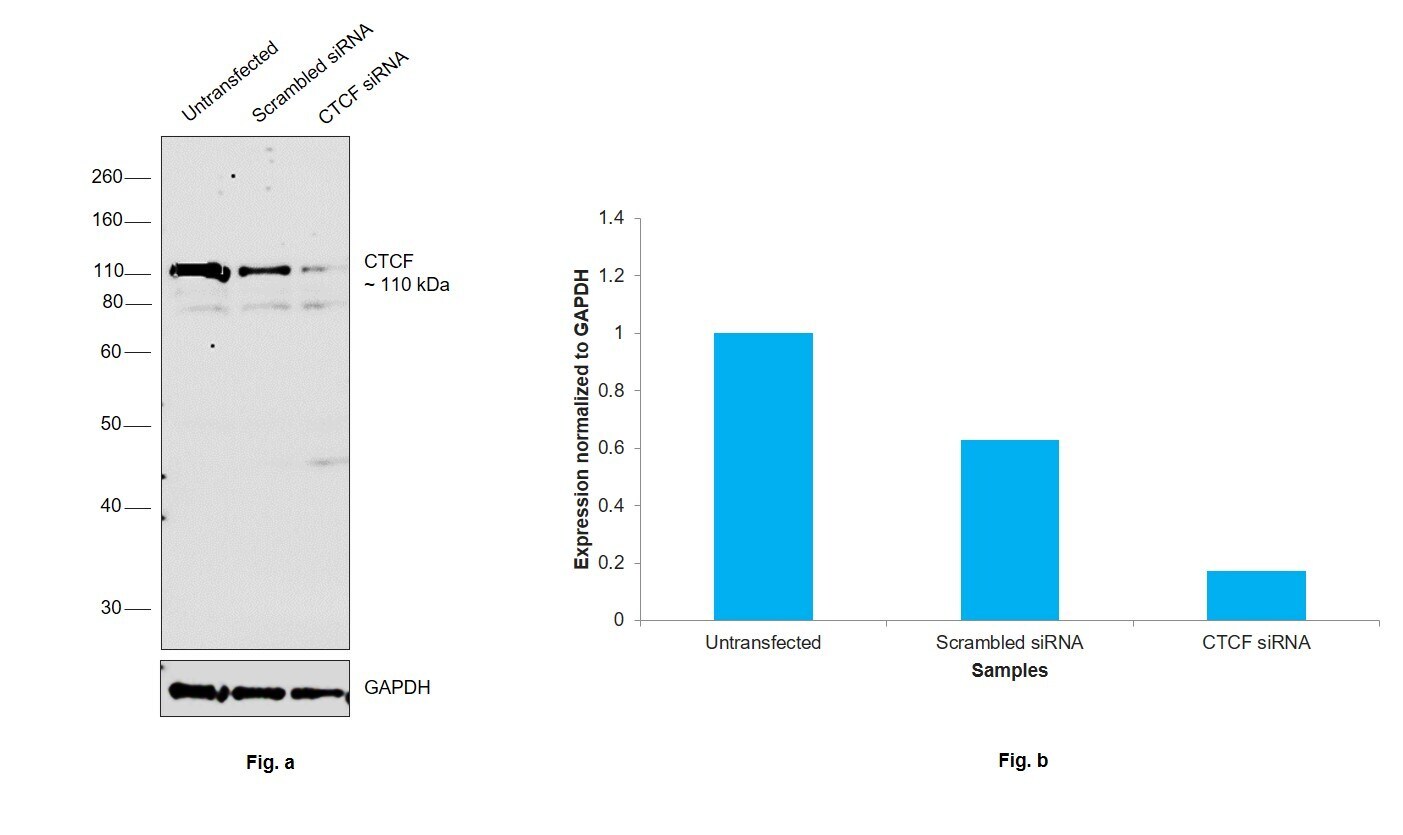
- Knockdown of CTCF was achieved by transfecting MCF7 with CTCF specific siRNAs (Silencer® select Product # s20966, s20967). Western blot analysis (Fig. a) was performed using nuclear enriched extracts from the CTCF knockdown cells (lane 3), non-targeting scrambled siRNA transfected cells (lane 2) and untransfected cells (lane 1). The blot was probed with CTCF Polyclonal Antibody (Product # PA5-88115, 1:1000 dilution ) and Goat anti-Rabbit IgG (Heavy Chain) Superclonal™ Recombinant Secondary Antibody, HRP (Product # A27036, 1:20000 dilution). Densitometric analysis of this western blot is shown in histogram (Fig. b). Decrease in signal upon siRNA mediated knock down confirms that antibody is specific to CTCF.
- Submitted by
- Invitrogen Antibodies (provider)
- Main image
- Experimental details
- Western blot analysis of CTCF in various lysates. Samples were incubated with CTCF Polyclonal antibody (Product # PA5-88115) using a dilution of 1:1,000, followed by HRP Goat Anti-Rabbit IgG (H+L) at a dilution of 1:10,000. Lysates/proteins: 25 µg per lane. Blocking buffer: 3% nonfat dry milk in TBST. Detection: ECL Basic Kit. Exposure time: 180s.

Supportive validation
- Submitted by
- Invitrogen Antibodies (provider)
- Main image
- Experimental details
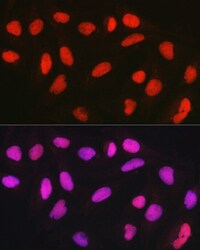
- Immunocytochemistry-Immunofluorescence analysis of CTCF was performed in U2OS cells using CTCF Polyclonal Antibody (Product # PA5-88115).

- Submitted by
- Invitrogen Antibodies (provider)
- Main image

- Experimental details
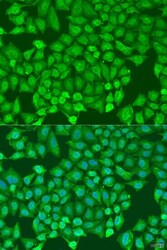
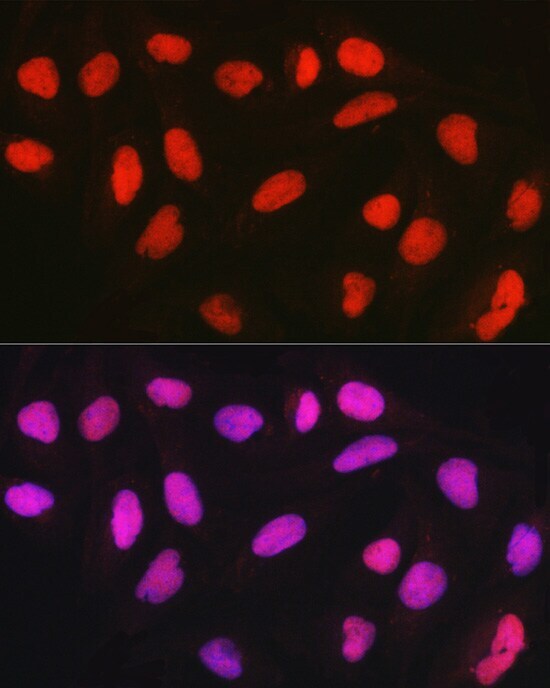
- Immunocytochemistry-Immunofluorescence analysis of CTCF was performed in Hela cells using CTCF Polyclonal Antibody (Product # PA5-88115).
- Submitted by
- Invitrogen Antibodies (provider)
- Main image
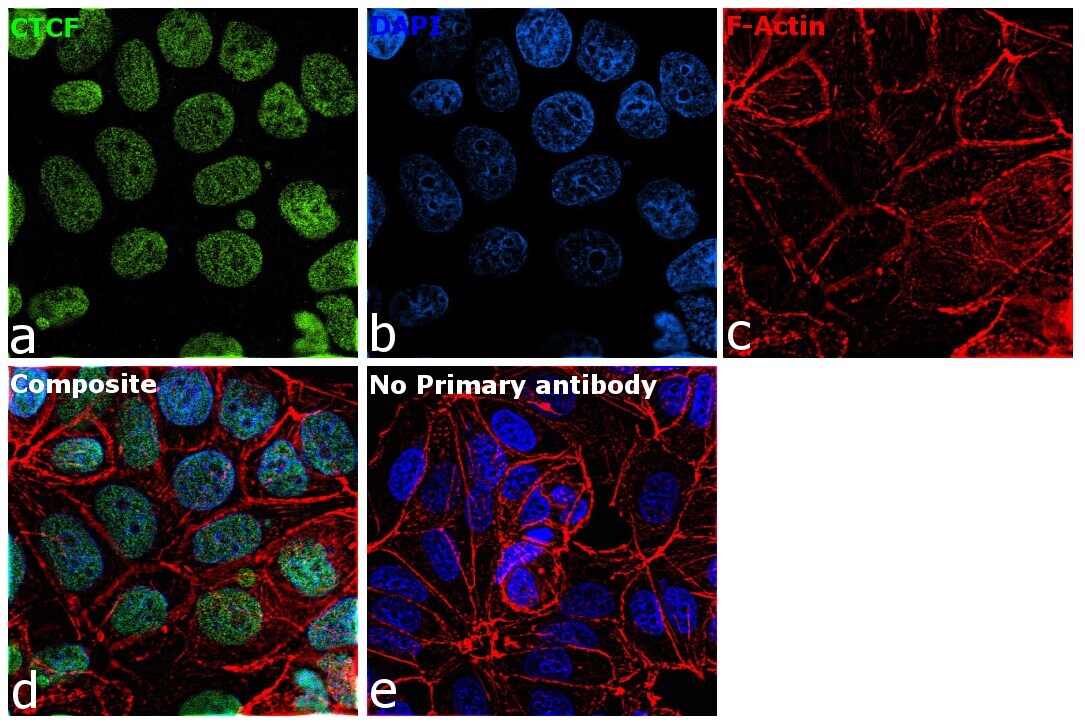
- Experimental details
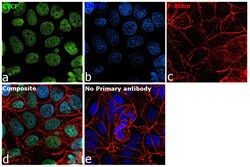
- Immunofluorescence analysis of CTCF was performed using 70% confluent log phase MCF7 cells. The cells were fixed with 4% paraformaldehyde for 10 minutes, permeabilized with 0.1% Triton™ X-100 for 15 minutes, and blocked with 2% BSA for 1 hour at room temperature. The cells were labeled with CTCF Polyclonal Antibody (Product # PA5-88115) at 1:100 dilution in 0.1% BSA, incubated at 4 degree celsius overnight and then labeled with Donkey anti-Rabbit IgG (H+L) Highly Cross-Adsorbed Secondary Antibody, Alexa Fluor Plus 488 (Product # A32790), (1:2000 dilution), for 45 minutes at room temperature (Panel a: Green). Nuclei (Panel b:Blue) were stained with ProLong™ Diamond Antifade Mountant with DAPI (Product # P36962). F-actin (Panel c: Red) was stained with Rhodamine Phalloidin (Product # R415, 1:300). Panel d represents the merged image showing nuclear localization. Panel e represents control cells with no primary antibody to assess background. The images were captured at 60X magnification.

- Submitted by
- Invitrogen Antibodies (provider)
- Main image
- Experimental details
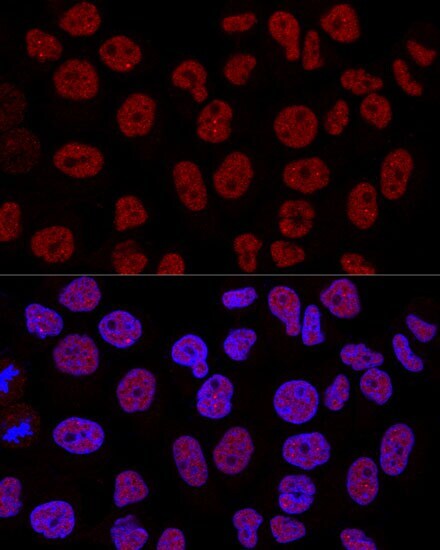
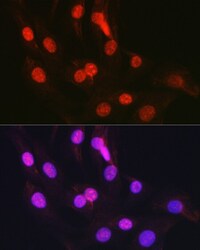
- Immunofluorescence analysis of CTCF in U2OS cells. Samples were incubated with CTCF Polyclonal antibody (Product # PA5-88115) using a dilution of 1:50 (40x lens). Blue: DAPI for nuclear staining.
- Submitted by
- Invitrogen Antibodies (provider)
- Main image
- Experimental details
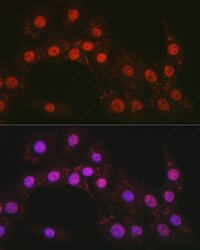
- Immunofluorescence analysis of CTCF in NIH/3T3 cells. Samples were incubated with CTCF Polyclonal antibody (Product # PA5-88115) using a dilution of 1:50 (40x lens). Blue: DAPI for nuclear staining.

- Submitted by
- Invitrogen Antibodies (provider)
- Main image
- Experimental details
- Immunofluorescence analysis of CTCF in PC-12 cells. Samples were incubated with CTCF Polyclonal antibody (Product # PA5-88115) using a dilution of 1:50 (40x lens). Blue: DAPI for nuclear staining.
- Submitted by
- Invitrogen Antibodies (provider)
- Main image

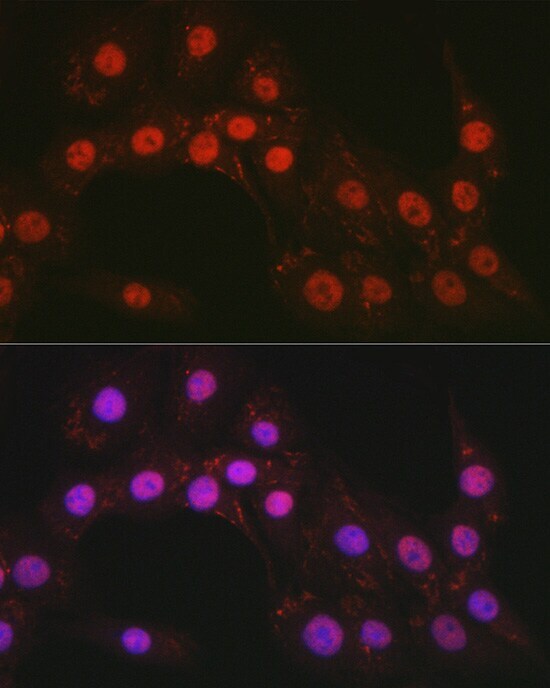
- Experimental details
- Immunofluorescence analysis of CTCF was performed using 70% confluent log phase MCF7 cells. The cells were fixed with 4% paraformaldehyde for 10 minutes, permeabilized with 0.1% Triton™ X-100 for 15 minutes, and blocked with 2% BSA for 1 hour at room temperature. The cells were labeled with CTCF Polyclonal Antibody (Product # PA5-88115) at 1:100 dilution in 0.1% BSA, incubated at 4 degree celsius overnight and then labeled with Donkey anti-Rabbit IgG (H+L) Highly Cross-Adsorbed Secondary Antibody, Alexa Fluor Plus 488 (Product # A32790), (1:2000 dilution), for 45 minutes at room temperature (Panel a: Green). Nuclei (Panel b:Blue) were stained with ProLong™ Diamond Antifade Mountant with DAPI (Product # P36962). F-actin (Panel c: Red) was stained with Rhodamine Phalloidin (Product # R415, 1:300). Panel d represents the merged image showing nuclear localization. Panel e represents control cells with no primary antibody to assess background. The images were captured at 60X magnification.
Supportive validation
- Submitted by
- Invitrogen Antibodies (provider)
- Main image

- Experimental details
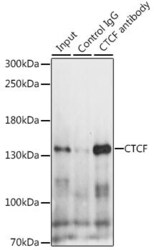
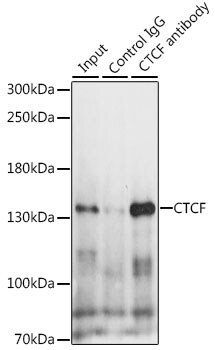
- Immunoprecipitation of CTCF in 300 μg extracts of Hela cells. Samples were precipitated with 3 μg CTCF Polyclonal antibody (Product # PA5-88115). Western blot was performed from the immunoprecipitate using CTCF Polyclonal antibody (Product # PA5-88115) at a dilution of 1:500.
Supportive validation
- Submitted by
- Invitrogen Antibodies (provider)
- Main image

- Experimental details
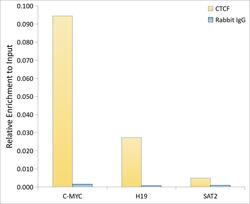
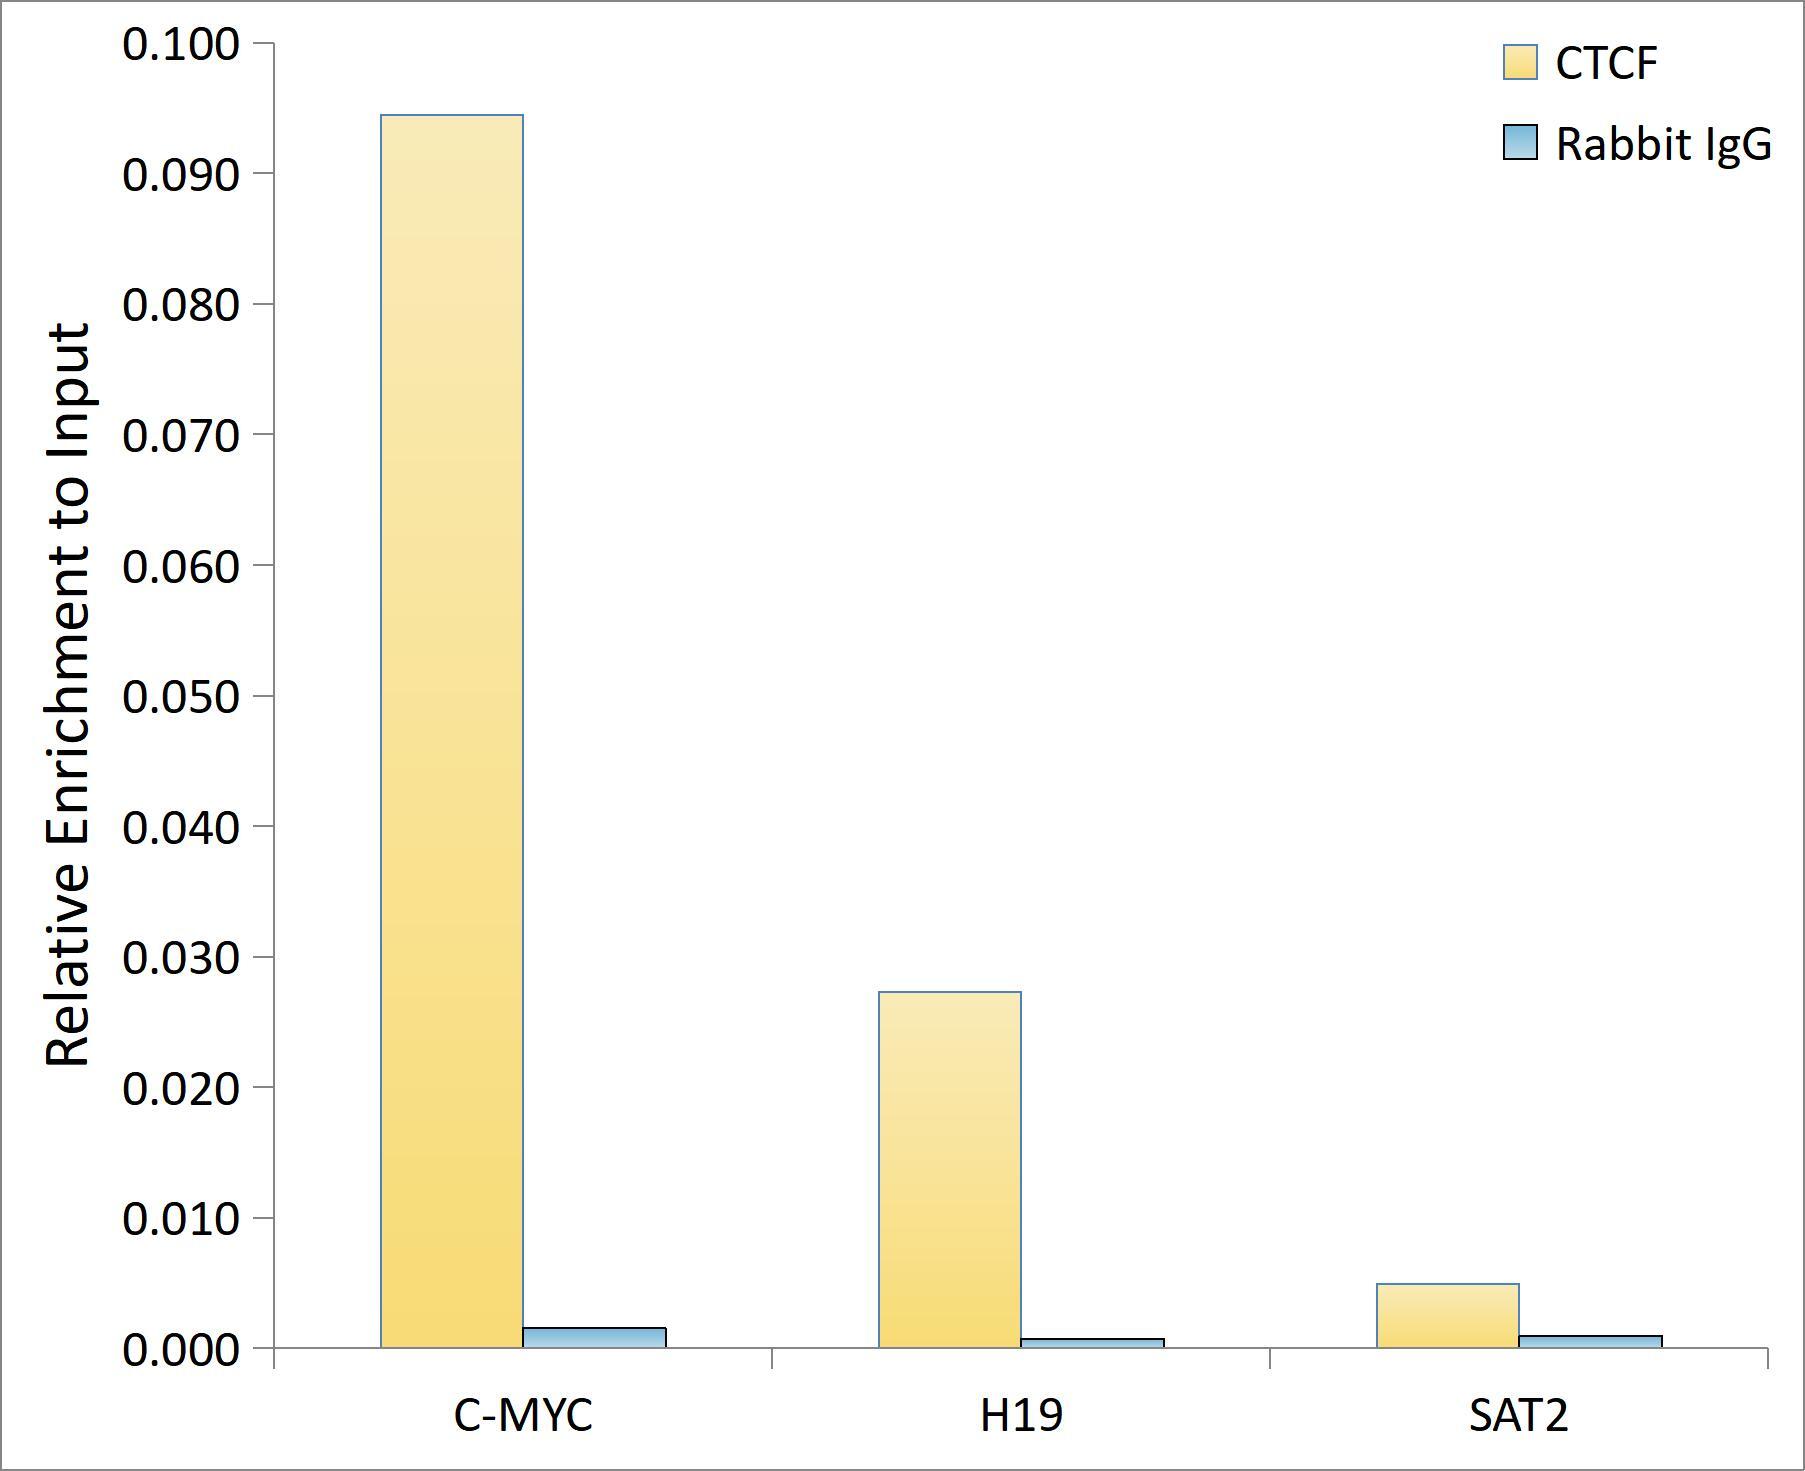
- Chromatin immunoprecipitation analysis of CTCF in HCT116 using CTCF Polyclonal Antibody (Product # PA5-88115) and rabbit IgG. The amount of immunoprecipitated DNA was checked by quantitative PCR. Histogram was constructed by the ratios of the immunoprecipitated DNA to the input.
- Submitted by
- Invitrogen Antibodies (provider)
- Main image
- Experimental details
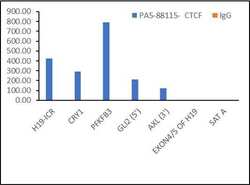
- Chromatin Immunoprecipitation (ChIP) of CTCF protein was performed using CTCF Polyclonal Antibody (Product # PA5-88115, 5 µg) on sheared chromatin from MCF7 cells using the MAGnify ChIP System kit (Product # 49-2024). Normal Rabbit IgG was used as a negative IP control. The purified DNA was analyzed by qPCR using primers binding to H19-ICR, CRY1, PFKFB3, GLI2 (5'), AXL (3') (Active), EXON4/5 OF H19 and SAT2 satellite repeats (Inactive). Data is presented as fold enrichment of the antibody signal versus the negative control IgG using the comparative CT method.

- Submitted by
- Invitrogen Antibodies (provider)
- Main image
- Experimental details
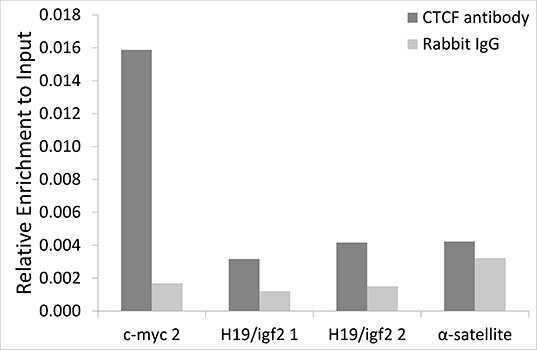
- ChIP analysis of CTCF in extracts of HeLa cells. Samples were incubated with CTCF Polyclonal antibody (Product # PA5-88115) and rabbit IgG. The amount of immunoprecipitated DNA was checked by quantitative PCR. Histogram was constructed by the ratios of the immunoprecipitated DNA to the input.
Supportive validation
- Submitted by
- Invitrogen Antibodies (provider)
- Main image
- Experimental details
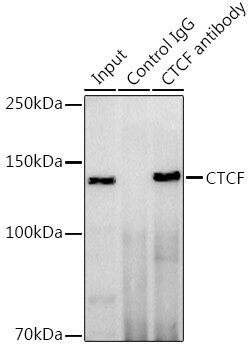
- Immunoprecipitation analysis of CTCF was performed in 200 µg extracts of HeLa cells using CTCF Polyclonal Antibody (Product # PA5-88115). Western blot was performed from the immunoprecipitate using CTCF Polyclonal Antibody.
- Submitted by
- Invitrogen Antibodies (provider)
- Main image
- Experimental details
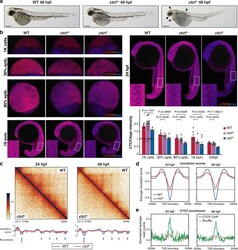
- Fig. 1 Knockout of ctcf in zebrafish embryos disrupts chromatin structure. a Pictures of wild-type (WT), ctcf +/- and ctcf -/- zebrafish embryos at 48 h post fertilization (hpf) showing homozygous mutant phenotypes, including the reduced size of head and eyes, heart edema, and defective pigmentation (arrow heads). Scale bars represent 250 mum. b Whole-mount embryo immunofluorescence of CTCF (red) and dapi (blue) in WT, ctcf +/- and ctcf -/- zebrafish embryos at the stages of 1000 cells (1 K cells), 30% of epiboly (30% epib. ), 80% of epiboly (80% epib. ), 18 somites (18 som.) and 24 hpf showing the maternal contribution of CTCF protein. Relative quantification of CTCF/dapi signal with average values +- standard error is shown. Statistical significance was measured using a two-sided Student's t test. The number of embryos for WT, ctcf +/- and ctcf -/- used for quantification are as follows: 1 K cells ( n = 3, n = 12, n = 3); 30% epib. ( n = 4, n = 8, n = 5); 80% epib. ( n = 3, n = 10, n = 5); 18 som. ( n = 5, n = 5, n = 7) and 24 hpf ( n = 5, n = 17, n = 5). Source data are provided as a Source Data file. c HiC normalized contact maps at 10-kb resolution from WT and ctcf -/- zebrafish embryos at 24 and 48 hpf. A 3-Mb genomic region in chr11 is plotted, aligned with the insulation scores and the called topologically associating domain (TAD) boundaries. d Average insulation score profiles of WT and ctcf -/- zebrafish embryos at 24 and 48 hpf around the TAD boundaries called in t