 Explore
 Validate
 Learn
Learn Western blot
 Immunohistochemistry
Antibody data
- Antibody Data
- Antigen structure
- References [2]
- Comments [0]
- Validations
- Immunohistochemistry [2]
- Other assay [3]
Submit
Validation data
Reference
Comment
Report error
- Product number
- PA5-34360 - Provider product page

- Provider
- Invitrogen Antibodies
- Product name
- TFEB Polyclonal Antibody
- Antibody type
- Polyclonal
- Antigen
- Synthetic peptide
- Description
- A suggested positive control is A549 cell lysate. PA5-34360 can be used with blocking peptide PEP-1403.
- Reactivity
- Human
- Host
- Rabbit
- Isotype
- IgG
- Vial size
- 100 μg
- Concentration
- 1 mg/mL
- Storage
- 4°C
Submitted references Transcriptional regulation of autophagy-lysosomal function in BRAF-driven melanoma progression and chemoresistance.
HSPA5 negatively regulates lysosomal activity through ubiquitination of MUL1 in head and neck cancer.
Li S, Song Y, Quach C, Guo H, Jang GB, Maazi H, Zhao S, Sands NA, Liu Q, In GK, Peng D, Yuan W, Machida K, Yu M, Akbari O, Hagiya A, Yang Y, Punj V, Tang L, Liang C
Nature communications 2019 Apr 12;10(1):1693
Nature communications 2019 Apr 12;10(1):1693
HSPA5 negatively regulates lysosomal activity through ubiquitination of MUL1 in head and neck cancer.
Kim SY, Kim HJ, Kim HJ, Kim DH, Han JH, Byeon HK, Lee K, Kim CH
Autophagy 2018;14(3):385-403
Autophagy 2018;14(3):385-403
No comments: Submit comment
Supportive validation
- Submitted by
- Invitrogen Antibodies (provider)
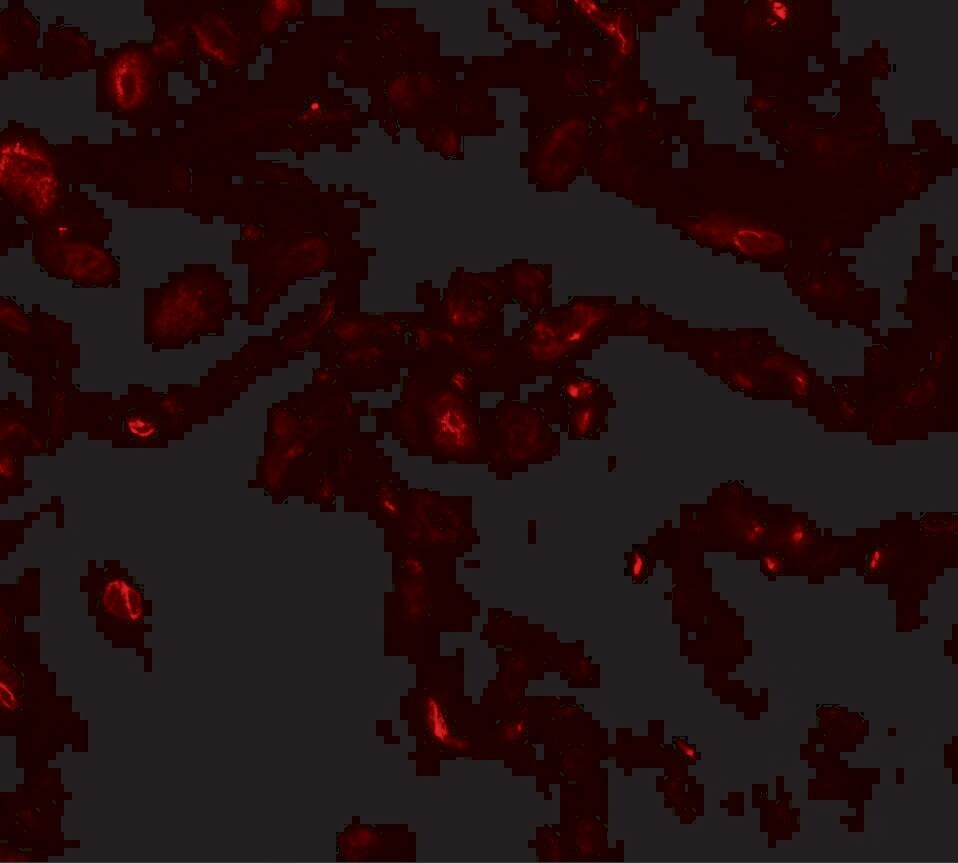
- Main image
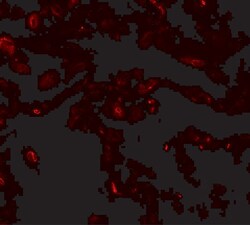
- Experimental details
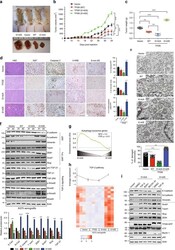
- Immunofluorescence of TFEB in human lung tissue with TFEB Polyclonal Antibody (Product # PA5-34360) at 20 µg/mL.
- Submitted by
- Invitrogen Antibodies (provider)
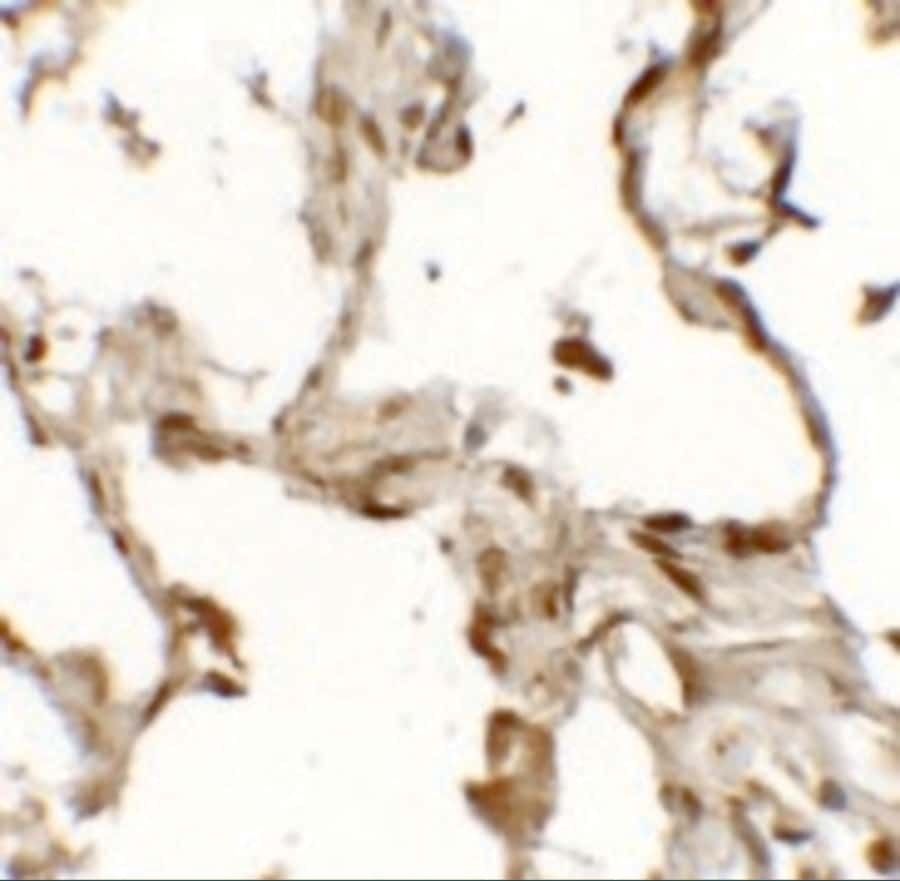
- Main image

- Experimental details
- Immunohistochemistry of TFEB (NT) in human lung tissue with TFEB Polyclonal Antibody (Product # PA5-34360) at 2.5 µg/mL.
Supportive validation
- Submitted by
- Invitrogen Antibodies (provider)
- Main image
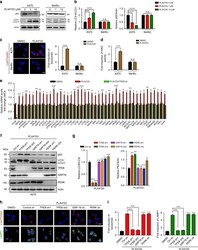
- Experimental details
- Fig. 1 BRAF V600E inhibitor triggers autophagy-lysosomal activation through TFEB. a , b Western blot analysis ( a ) and densitometric quantification ( b ) of the LC3-II/LC3-I and the p62/Actin ratios in A375 and MeWo cells treated with the indicated concentrations of PLX4720 for 12 h. Actin served as a loading control. n = 4 independent experiments. c Representative images of LysoTracker Red staining of A375 and MeWo cells treated for 12 h with DMSO or PLX4720 (1 muM). Quantification of relative fold induction of lysosomes by PLX4720 is shown in the right panel. n = 3 independent experiments. d Relative lysosome NAG activity in PLX4720-treated A375 cells. n = 3 independent experiments. e Expression analysis of the autophagy-lysosome relevant genes in PLX4720-treated A375 cells in the presence or absence of TFEB (shRNA). n = 3 independent experiments. f , g Western blot analysis ( f ) and densitometric quantification ( g ) of the LC3-II/LC3-I and p62/Actin ratios in PLX4720-treated A375 cells with shRNA-mediated depletion of the indicated genes. Expression of indicated proteins is also shown. Actin served as a loading control. n = 3 independent experiments. h , i Representative images ( h ) and quantification ( i ) of LysoTracker Red (red) and LAMP1 (green) immunostaining of PLX4720 (1 muM, 12 h-treated) A375 cells with depletion of the indicated genes. Note the reduced lysosome staining in PLX4720-treated cells upon TFEB depletion. n =

- Submitted by
- Invitrogen Antibodies (provider)
- Main image
- Experimental details
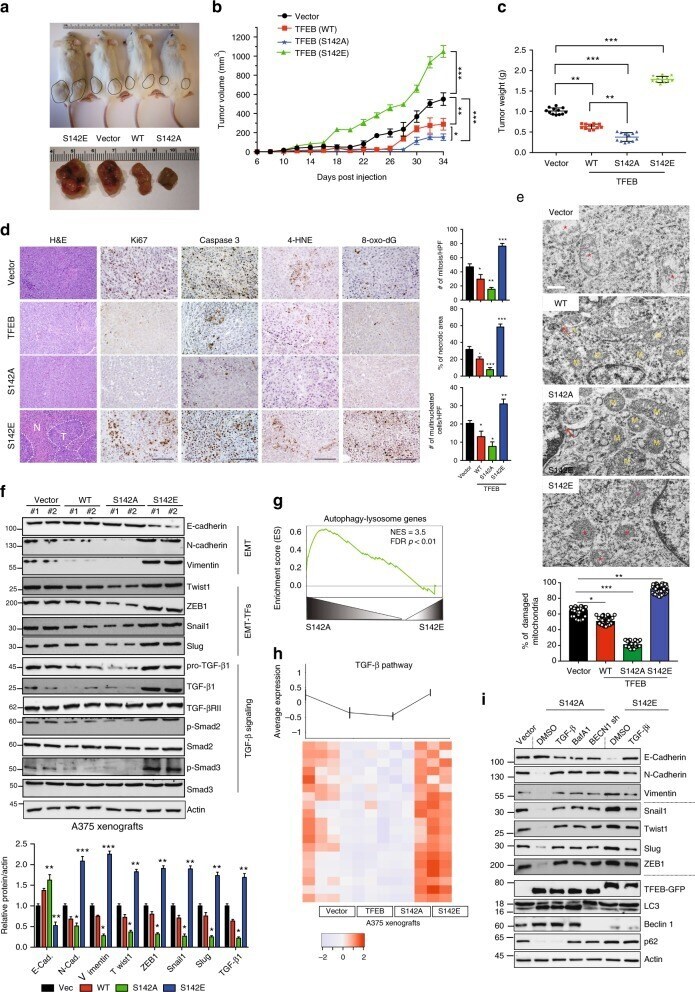
- Fig. 5 Effect of TFEB S142 phosphorylation on BRAF V600E melanoma progression. a NOD/SCID mice bearing A375 xenografts tumors stably expressing vector, WT, TFEB S142A or TFEB S142E isolated on day 34 post-injection. b , c Tumor volume ( b ) and Tumor weight (g) upon autopsy at day 34 of A375 xenografts stably expressing the indicated TFEB. n = 5-6 mice per group per time point. d H&E and immunohistochemical (IHC) staining of Ki67, active Caspase 3, 4-HNE, and 8-oxo-dG in indicated A375 tumor genotypes. The levels of mitotic figures, necrosis, and multinucleated cells were quantified (right panels; n = 5-6 mice per group). N necrotic area, T tumor. Scale bars, 100 mum. e EM images of the indicated xenograft tumor genotypes. M mitochondria. Asterisks denote damaged mitochondria. Arrows denote autophagic vacuoles. Damaged mitochondria is quantified (bottom; n = 50). Scale bar, 200 nm. f IB of EMT-related factors and TGF-beta/TGF-betaR2/Smad2/3 signaling in indicated A375 xenograft tumor genotypes (two randomly chosen samples per group). Also shown (bottom) is the relative expression of indicated proteins in xenograft tumors. n = 3 independent experiments. g GSEA plot of A375 tumors showing the significantly changed autophagy-lysosome genes. The relevant complete GSEA data are in Supplementary Data 1a . FDR false discovery rate, NES normalized enrichment score. h Heat map depicting the expression of TGF-beta target genes in indicated xenograft tum
- Submitted by
- Invitrogen Antibodies (provider)
- Main image
- Experimental details
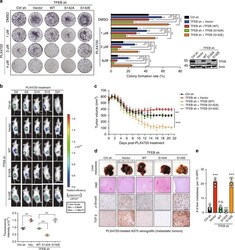
- Fig. 8 TFEB S142 phosphorylation confers BRAFi resistance in melanoma cells. a Representative images (left) and quantification (right) of the colonogenic survival of A375 cells stably expressing control shRNA (pGIPZ) or TFEB shRNA complemented with empty vector, WT TFEB, and S142A or S142E TFEB mutants that are shRNA-resistant, after treatment with DMSO or PLX4720 at the indicated concentrations. Endogenous and reconstituted TFEB expression was confirmed by immunoblotting (bottom right). n = 3 independent experiments. b Bioluminescence images (top) of tumor regression of the indicated A375 R xenograft tumor genotype in live NOD/SCID mice at the indicated time after inoculation. Radiant efficiency expressed as p/s/cm 2 /sr/(muW/cm 2 ) was quantified (bottom). c Effect of PLX4720 on tumor response of xenografts formed by the indicated A375 cell lines. After tumor establishment (~ 500 mm 3 ), mice bearing A375 xenografts were treated with PLX4720 (20 mg/kg, i.p.) daily for 21 days. Values are the mean tumor volume +- SD per time point for 6-7 mice per group. d , e Representative gross images ( d ) of livers with metastatic nodules (top), H&E-stained sections (second row) and IHC analysis of TGF-beta and p-Smad3 of the indicated A375 xenograft genotypes 21 days after PLX4720 treatment (20 mg/kg, i.p., daily). Scale bars, 100 mum. The numbers of metastatic nodules in the liver in ( d ) was quantified in ( e ) ( n = 5-6 mice per group). For all quantification, data
