Explore
 Validate
 Learn
Learn Western blot
 Immunohistochemistry
 Other assay
Antibody data
- Antibody Data
- Antigen structure
- References [1]
- Comments [0]
- Validations
- Other assay [5]
Submit
Validation data
Reference
Comment
Report error
- Product number
- PA5-100993 - Provider product page

- Provider
- Invitrogen Antibodies
- Product name
- RGR Polyclonal Antibody
- Antibody type
- Polyclonal
- Antigen
- Synthetic peptide
- Description
- Antibody detects endogenous levels of total RGR.
- Reactivity
- Human
- Host
- Rabbit
- Isotype
- IgG
- Vial size
- 100 μL
- Concentration
- 1 mg/mL
- Storage
- -20°C
Submitted references Expression of Retinal G Protein-Coupled Receptor, a Member of the Opsin Family, in Human Skin Cells and Its Mediation of the Cellular Functions of Keratinocytes.
Gu Y, Wang Y, Lan Y, Feng J, Zeng W, Zhang W, Lu H
Frontiers in cell and developmental biology 2022;10:787730
Frontiers in cell and developmental biology 2022;10:787730
No comments: Submit comment
Supportive validation
- Submitted by
- Invitrogen Antibodies (provider)
- Main image
- Experimental details
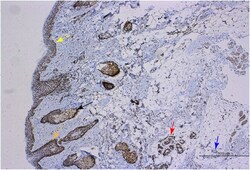
- FIGURE 1 RGR expression in human skin tissue. Immunohistochemical methods were used to show positive RGR staining in the epithelial layer (yellow arrow), sebaceous gland (black arrow), hair follicle (orange arrow), sweat gland (red arrow), and blood vessel (blue arrow) of skin tissue. Scale bar = 500 mum.

- Submitted by
- Invitrogen Antibodies (provider)
- Main image
- Experimental details
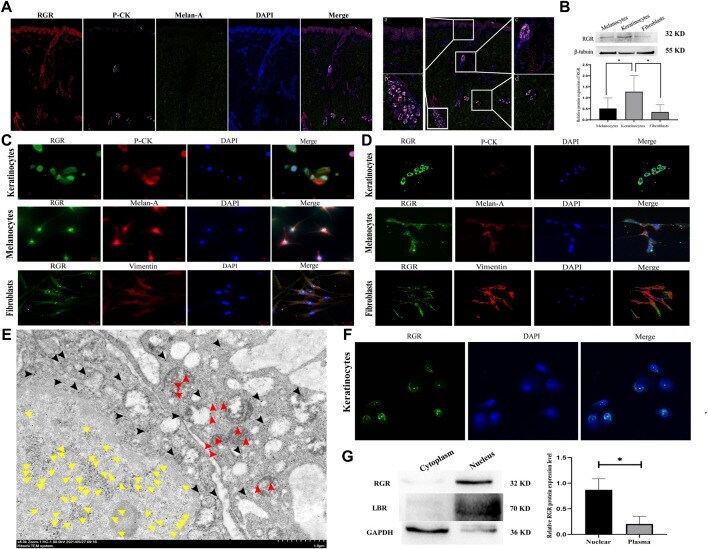
- FIGURE 2 RGR expression level and subcellular localization in human skin cells. (A) In normal human skin tissue, coimmunostaining of RGR (red) with the melanocyte marker melan-A (green) and keratinocyte marker P-CK (pink) is shown. Scale bar = 20 mum. The results showed positive staining of the RGR in the basal layer of the skin, large sudoriferous glands, hair follicles, and eccrine glands. Scale bar = 200 mum. (B) Representative expression of RGR and beta -tubulin (loading control) in melanocytes, keratinocytes, and fibroblasts, as measured by the Western blot assay (anti-RGR antibody: a band of ~32 kDa; beta -tubulin antibody: a band of ~55 kDa). The relative protein levels of RGR and beta -tubulin were measured by ImageJ software (n = 3 independent experiments). (C) In cultured cells, the colocalization of the RGR (green) and melan-A (red) in melanocytes, colocalization of RGR (green) and CK-pan (red) in keratinocytes, and colocalization of RGR (green) and vimentin (red) in fibroblasts were detected by immunofluorescence double staining. Scale bar = 20 mum. (D) Localization and expression of the RGR (green) in human skin cells (melanocytes, keratinocytes, and fibroblasts) were observed by a confocal microscope. Scale bar = 20 mum. (E) IEM staining of the normal skin tissue. Representative protein A-gold probe represents RGR (RGR is mainly located in the nucleoplasm (yellow arrow) and mitochondria (red arrow) and scattered in the cytoplasm and other organelles (black arrow
- Submitted by
- Invitrogen Antibodies (provider)
- Main image
- Experimental details
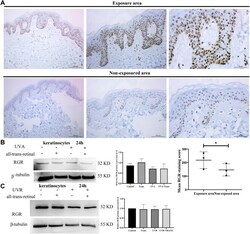
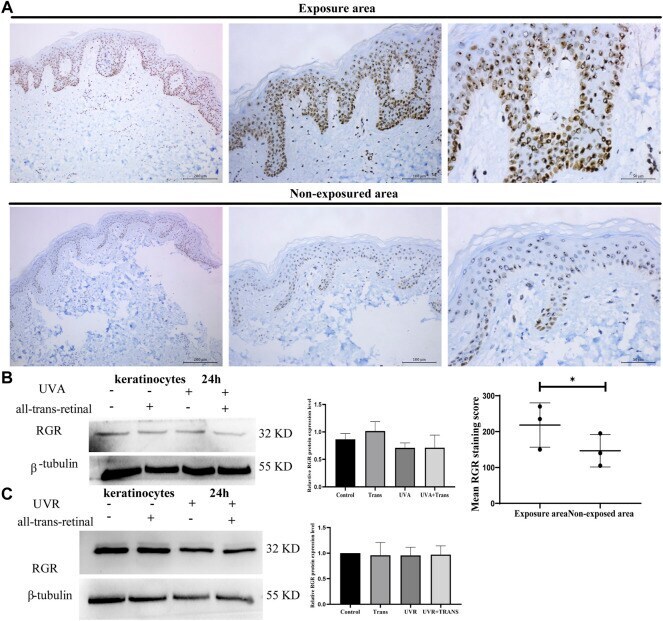
- FIGURE 3 UVA and UVR may not induce RGR expression in human keratinocytes. (A) The differential RGR expression in the exposed and unexposed skin tissues was analyzed by immunohistochemistry. The RGR was highly expressed in the epithelial layer of light-exposed sites, particularly in the basal cell layer and spinous cell layer of the epidermis and cells of the skin appendages. Exposed area vs unexposed area, * p < 0.05. Scale bar = 100 mum (right), 50 mum (middle), 20 mum (left). (B) Keratinocytes with all-trans-retinal were irradiated with 3 J/cm 2 UVA. Representative expression of RGR and beta -tubulin (loading control) by Western blot analysis. The relative protein levels of RGR and beta -tubulin were measured using ImageJ software (n = 3 independent experiments). (C) Keratinocytes with all-trans-retinal were irradiated with 1.5 J/cm 2 UVR. Representative expression of RGR and beta -tubulin (loading control) was detected by Western blot analysis. The relative protein levels of RGR and beta -tubulin were measured using ImageJ software (n = 3 independent experiments).
- Submitted by
- Invitrogen Antibodies (provider)
- Main image
- Experimental details
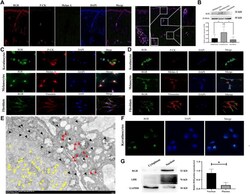
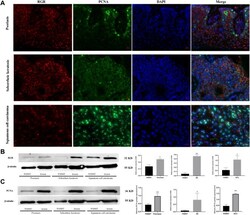
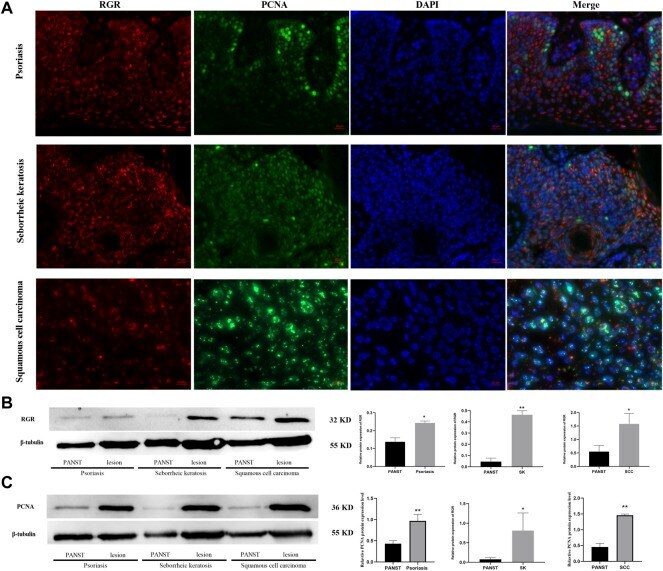
- FIGURE 4 RGR is highly expressed in proliferative diseases and tumor tissues. (A) RGR expression (red) is colocalized with the proliferative marker PCNA (green) in psoriasis, seborrheic keratosis, and squamous cell carcinoma. Scale bar = 20 mum. (B) Representative expression of RGR and beta -tubulin (loading control) in lesion areas and non-lesion areas was detected by WB analysis. The relative protein levels of RGR and beta -tubulin were measured using ImageJ software (n = 3 independent experiments). * p < 0.05. (C) Representative expression of PCNA and beta -tubulin (loading control) was detected by WB analysis. The relative protein levels of RGR and beta -tubulin were measured using ImageJ software (n = 3 independent experiments). ** p < 0.01.
- Submitted by
- Invitrogen Antibodies (provider)
- Main image
- Experimental details
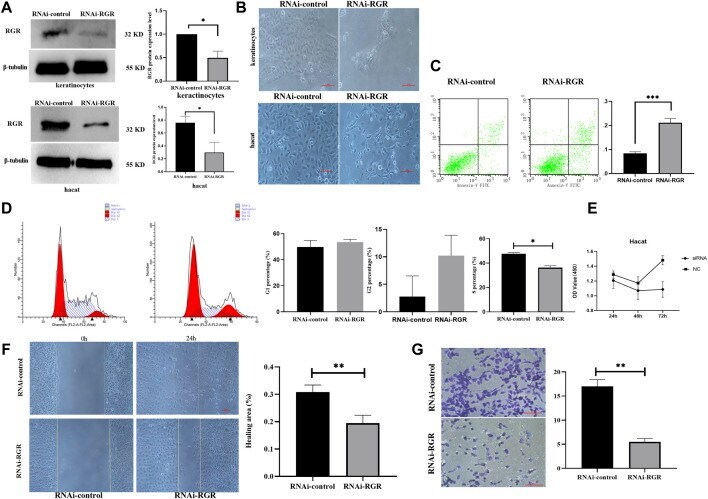
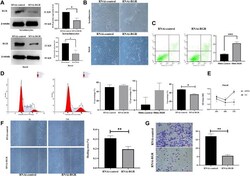
- FIGURE 5 RGR regulates the proliferation, migration, and apoptosis of keratinocytes. (A) Representative keratinocyte defects in RGR (with small siRNA) and beta -tubulin (loading control) were detected by WB analysis. The relative protein levels of RGR and beta -tubulin were measured using ImageJ software (n = 3 independent experiments). * p < 0.05, ** p < 0.01, *** p < 0.001. (B) Representative images of cell fragmentation and cell contraction observed under a light microscope in the si-RGR transfection group. No significant morphological change was detected in the si-control group. Scale bar = 20 mum * p < 0.05, ** p < 0.01, *** p < 0.001 vs the control group. (C) Flow cytometry with annexin V FITC/PI double staining was used to determine apoptotic cells. Following RGR knockdown, a significant decrease in apoptosis was detected in the keratinocytes transfected with si-RGR compared with the control. * p < 0.05, ** p < 0.01, *** p < 0.001 vs the control group. (D) Flow cytometry was used to detect the cell cycle after RGR knockdown in keratinocytes. Following RGR knockdown, a significant decrease in the S phase at 48 h was detected in keratinocytes transfected with si-RGR compared with the control. * p < 0.05 vs the control group. (E) RGR in keratinocytes was inhibited via Si-RGR, and cell viability was measured after 48 h. (F) Representative images from wound healing experiments showed low expression of the RGR and decreased mobility relative to controls. Scale bar = 50 mum *