Explore
 Validate
 Learn
Learn Western blot
 Immunocytochemistry
Antibody data
- Antibody Data
- Antigen structure
- References [1]
- Comments [0]
- Validations
- Immunocytochemistry [2]
- Flow cytometry [1]
- Other assay [1]
Submit
Validation data
Reference
Comment
Report error
- Product number
- 44-1072G - Provider product page

- Provider
- Invitrogen Antibodies
- Product name
- Phospho-Cofilin (Ser3) Polyclonal Antibody
- Antibody type
- Polyclonal
- Antigen
- Synthetic peptide
- Reactivity
- Human, Mouse, Rat, Canine
- Host
- Rabbit
- Isotype
- IgG
- Vial size
- 100 μL
- Storage
- -20°C
Submitted references Developmentally regulated GTP-binding protein 1 modulates ciliogenesis via an interaction with Dishevelled.
Lee M, Hwang YS, Yoon J, Sun J, Harned A, Nagashima K, Daar IO
The Journal of cell biology 2019 Aug 5;218(8):2659-2676
The Journal of cell biology 2019 Aug 5;218(8):2659-2676
No comments: Submit comment
Supportive validation
- Submitted by
- Invitrogen Antibodies (provider)
- Main image
- Experimental details
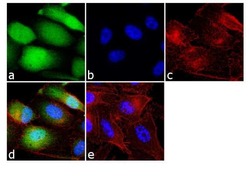
- Immunofluorescence analysis of Phospho-Cofilin pSer3 was done on 70% confluent log phase PC-3 cells. The cells were fixed with 4% paraformaldehyde for 10 minutes, permeabilized with 0.1% Triton™ X-100 for 10 minutes, and blocked with 1% BSA for 1 hour at room temperature. The cells were labeled with Phospho-Cofilin pSer3 Rabbit Polyclonal Antibody (Product # 44-1072G) at 1:250 dilution in 0.1% BSA and incubated for 3 hours at room temperature and then labeled with Goat anti-Rabbit IgG (H+L) Superclonal™ Secondary Antibody, Alexa Fluor® 488 conjugate (Product # A27034) at a dilution of 1:2000 for 45 minutes at room temperature (Panel a: green). Nuclei (Panel b: blue) were stained with SlowFade® Gold Antifade Mountant with DAPI (Product # S36938). F-actin (Panel c: red) was stained with Rhodamine Phalloidin (Product # R415, 1:300). Panel d is a merged image showing cytoplasmic and nuclear localization. Panel e is a no primary antibody control. The images were captured at 60X magnification.
- Submitted by
- Invitrogen Antibodies (provider)
- Main image

- Experimental details
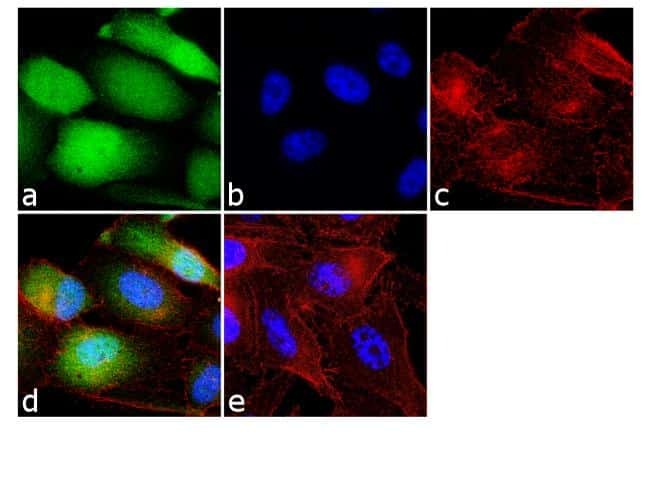
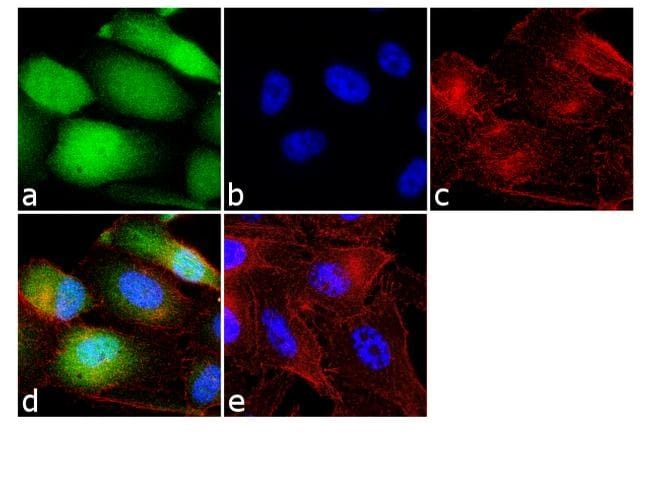
- Immunofluorescence analysis of Phospho-Cofilin pSer3 was done on 70% confluent log phase PC-3 cells. The cells were fixed with 4% paraformaldehyde for 10 minutes, permeabilized with 0.1% Triton™ X-100 for 10 minutes, and blocked with 1% BSA for 1 hour at room temperature. The cells were labeled with Phospho-Cofilin pSer3 Rabbit Polyclonal Antibody (Product # 44-1072G) at 1:250 dilution in 0.1% BSA and incubated for 3 hours at room temperature and then labeled with Goat anti-Rabbit IgG (Heavy Chain) Superclonal™ Secondary Antibody, Alexa Fluor® 488 conjugate (Product # A27034) at a dilution of 1:2000 for 45 minutes at room temperature (Panel a: green). Nuclei (Panel b: blue) were stained with SlowFade® Gold Antifade Mountant with DAPI (Product # S36938). F-actin (Panel c: red) was stained with Rhodamine Phalloidin (Product # R415, 1:300). Panel d is a merged image showing cytoplasmic and nuclear localization. Panel e is a no primary antibody control. The images were captured at 60X magnification.
Supportive validation
- Submitted by
- Invitrogen Antibodies (provider)
- Main image
- Experimental details
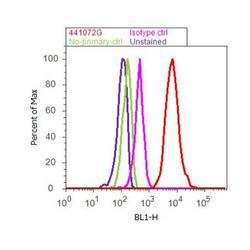
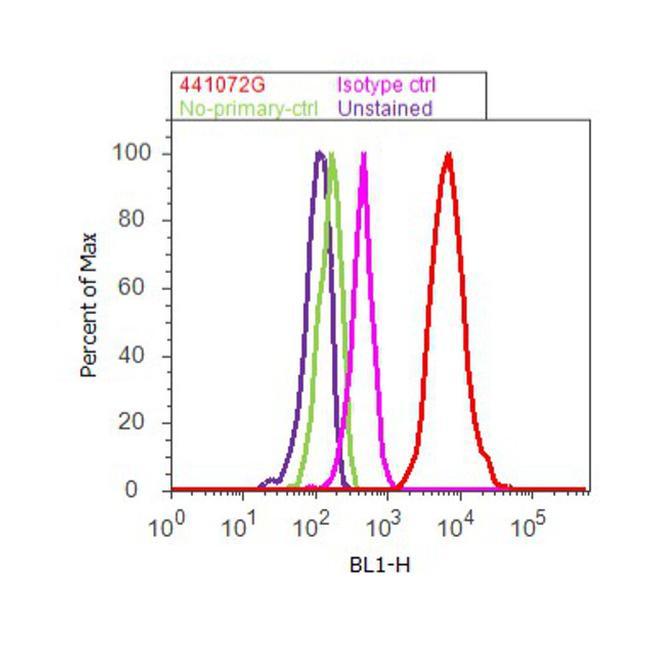
- Flow cytometry analysis of Cofilin [pSer3] was done on U-87 MG cells. Cells were fixed with 70% ethanol for 10 minutes, permeabilized with 0.25% Triton™ X-100 for 20 minutes, and blocked with 5% BSA for 30 minutes at room temperature. Cells were labeled with Cofilin [pSer3] Rabbit Polyclonal Antibody (441072G, red histogram) or with rabbit isotype control (pink histogram) at 3-5 ug/million cells in 2.5% BSA. After incubation at room temperature for 2 hours, the cells were labeled with Alexa Fluor® 488 Goat Anti-Rabbit Secondary Antibody (A11008) at a dilution of 1:400 for 30 minutes at room temperature. The representative 10,000 cells were acquired and analyzed for each sample using an Attune® Acoustic Focusing Cytometer. The purple histogram represents unstained control cells and the green histogram represents no-primary-antibody control.
Supportive validation
- Submitted by
- Invitrogen Antibodies (provider)
- Main image
- Experimental details
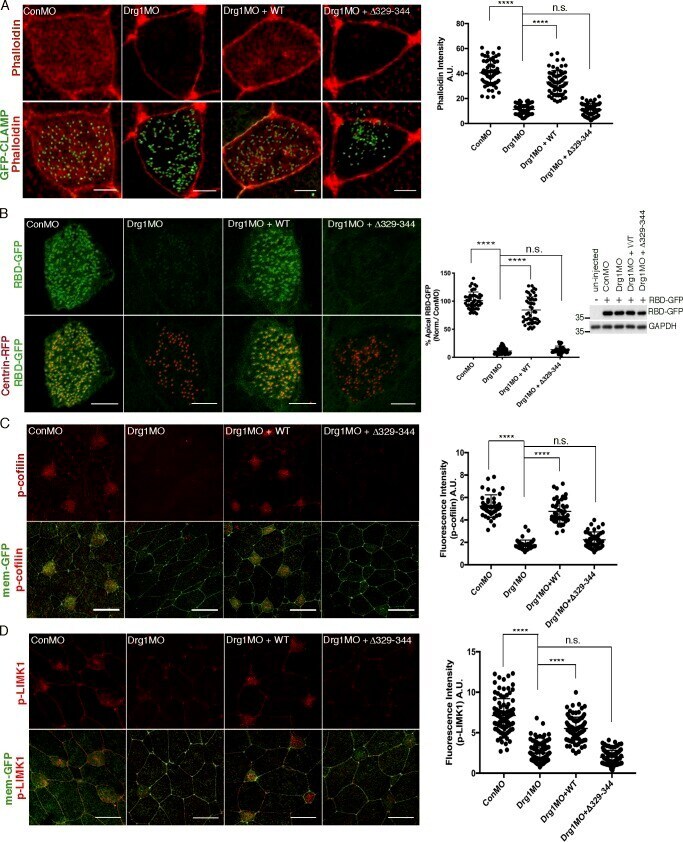
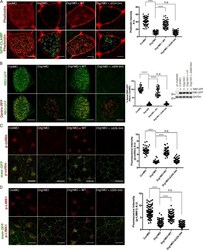
- Figure 4. Drg1-Dvl interaction modulates apical actin enrichment in MCCs through Rho activation. (A) Apical actin meshwork decreases upon Drg1 knockdown. The loss of apical actin signal is rescued by expression of Drg1 WT, but not by the Drg1 Delta329-344 mutant. The embryos were injected with the indicated MOs and mRNAs, fixed at stage 25, and stained with phalloidin (red) to visualize cortical F-actin in apical region of MCCs. GFP-CLAMP (green) marks rootlets. ****, P < 0.0001, one-way ANOVA; n = 65. Scale bars, 5 um. Error bars indicate +- SD. (B) Drg1 knockdown decreases Rho activity. Synthetic mRNAs of RBD-GFP (green) and centrin-RFP (red) were coinjected with the indicated MOs and mRNAs, and embryos were fixed at stage 25. Fluorescence intensity of experimental groups is normalized to the control MCCs and expressed as a percentage relative to control. Expression level of RBD-GFP was tested by Western blot. Images are generated by maximum intensity projection of serial z-stack confocal images from apical (0 um) to subapical region (-2.5 um). ****, P < 0.0001, one-way ANOVA; n = 49. Scale bars, 5 um. Error bars indicate +- SD. (C and D) Phosphorylation of Rho downstream targets is decreased by Drg1 knockdown. The embryos injected with the indicated MOs and mRNAs were stained for phospho-cofilin (C) and phospho-LIMK1 (D). Statistical analysis by one-way ANOVA with post hoc Turkey's multiple range tests. All results are derived from three independe