Explore
 Validate
 Learn
Learn Western blot
 Immunocytochemistry
Antibody data
- Antibody Data
- Antigen structure
- References [7]
- Comments [0]
- Validations
- Immunocytochemistry [1]
- Immunohistochemistry [1]
- Flow cytometry [2]
- Other assay [11]
Submit
Validation data
Reference
Comment
Report error
- Product number
- PA1-16893 - Provider product page

- Provider
- Invitrogen Antibodies
- Product name
- SLC7A11 Polyclonal Antibody
- Antibody type
- Polyclonal
- Antigen
- Synthetic peptide
- Description
- This antibody is not recommended for Immunoprecipitation. Permeablization is recommended prior to performing Flow analysis. Suggested positive control: antigen standard for SLC7A11 (transient overexpression lysate), human stomach protein or stomach tissue lysate.
- Reactivity
- Human, Mouse, Rat
- Host
- Rabbit
- Isotype
- IgG
- Vial size
- 100 μL
- Concentration
- 1 mg/mL
- Storage
- Store at 4°C short term. For long term storage, store at -20°C, avoiding freeze/thaw cycles.
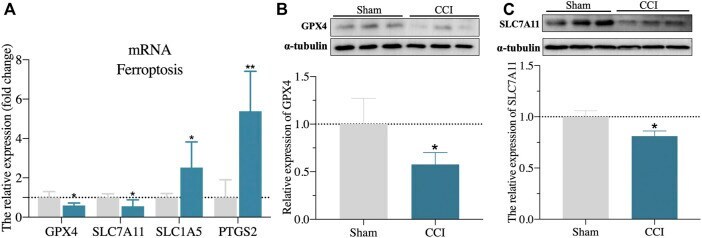
Submitted references Transcriptome Profiles of IncRNA and mRNA Highlight the Role of Ferroptosis in Chronic Neuropathic Pain With Memory Impairment.
TRIM26 Induces Ferroptosis to Inhibit Hepatic Stellate Cell Activation and Mitigate Liver Fibrosis Through Mediating SLC7A11 Ubiquitination.
Overexpression of Cystine/Glutamate Antiporter xCT Correlates with Nutrient Flexibility and ZEB1 Expression in Highly Clonogenic Glioblastoma Stem-like Cells (GSCs).
Mitochondrial fusion supports increased oxidative phosphorylation during cell proliferation.
Participation of xCT in melanoma cell proliferation in vitro and tumorigenesis in vivo.
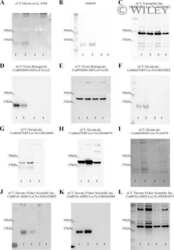
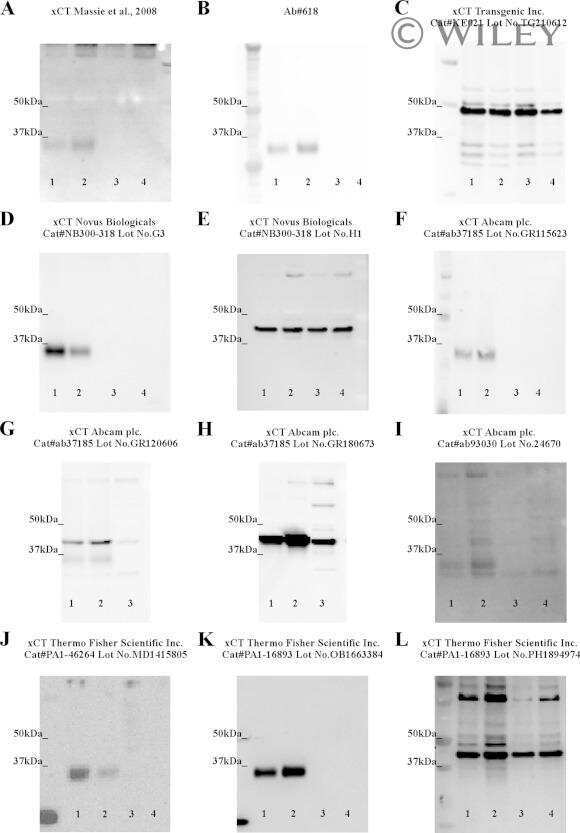
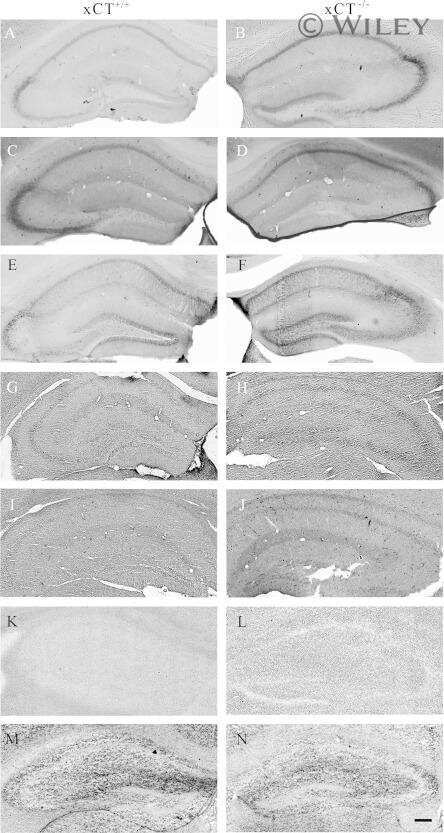
Comparative analysis of antibodies to xCT (Slc7a11): Forewarned is forearmed.
Reduced expression of miRNA-27a modulates cisplatin resistance in bladder cancer by targeting the cystine/glutamate exchanger SLC7A11.
Tang Y, Liu C, Zhu T, Chen H, Sun Y, Zhang X, Zhao Q, Wu J, Fei X, Ye S, Chen C
Frontiers in cell and developmental biology 2022;10:843297
Frontiers in cell and developmental biology 2022;10:843297
TRIM26 Induces Ferroptosis to Inhibit Hepatic Stellate Cell Activation and Mitigate Liver Fibrosis Through Mediating SLC7A11 Ubiquitination.
Zhu Y, Zhang C, Huang M, Lin J, Fan X, Ni T
Frontiers in cell and developmental biology 2021;9:644901
Frontiers in cell and developmental biology 2021;9:644901
Overexpression of Cystine/Glutamate Antiporter xCT Correlates with Nutrient Flexibility and ZEB1 Expression in Highly Clonogenic Glioblastoma Stem-like Cells (GSCs).
Koch K, Hartmann R, Suwala AK, Rios DH, Kamp MA, Sabel M, Steiger HJ, Willbold D, Sharma A, Kahlert UD, Maciaczyk J
Cancers 2021 Nov 29;13(23)
Cancers 2021 Nov 29;13(23)
Mitochondrial fusion supports increased oxidative phosphorylation during cell proliferation.
Yao CH, Wang R, Wang Y, Kung CP, Weber JD, Patti GJ
eLife 2019 Jan 29;8
eLife 2019 Jan 29;8
Participation of xCT in melanoma cell proliferation in vitro and tumorigenesis in vivo.
Shin SS, Jeong BS, Wall BA, Li J, Shan NL, Wen Y, Goydos JS, Chen S
Oncogenesis 2018 Nov 14;7(11):86
Oncogenesis 2018 Nov 14;7(11):86
Comparative analysis of antibodies to xCT (Slc7a11): Forewarned is forearmed.
Van Liefferinge J, Bentea E, Demuyser T, Albertini G, Follin-Arbelet V, Holmseth S, Merckx E, Sato H, Aerts JL, Smolders I, Arckens L, Danbolt NC, Massie A
The Journal of comparative neurology 2016 Apr 1;524(5):1015-32
The Journal of comparative neurology 2016 Apr 1;524(5):1015-32
Reduced expression of miRNA-27a modulates cisplatin resistance in bladder cancer by targeting the cystine/glutamate exchanger SLC7A11.
Drayton RM, Dudziec E, Peter S, Bertz S, Hartmann A, Bryant HE, Catto JW
Clinical cancer research : an official journal of the American Association for Cancer Research 2014 Apr 1;20(7):1990-2000
Clinical cancer research : an official journal of the American Association for Cancer Research 2014 Apr 1;20(7):1990-2000
No comments: Submit comment
Supportive validation
- Submitted by
- Invitrogen Antibodies (provider)
- Main image
- Experimental details
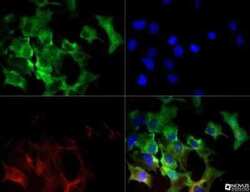
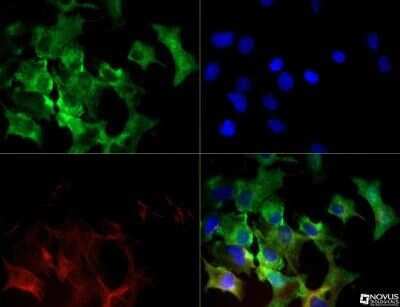
- Immunocytochemistry analysis of SLC7A11 in HepG2 cells. Samples were incubated in SLC7A11 polyclonal antibody (Product # PA1-16893) followed by DyLight 488 (green). Nuclei and alpha-tubulin were counterstained with DAPI (blue) and DyLight 550 (red).
Supportive validation
- Submitted by
- Invitrogen Antibodies (provider)
- Main image
- Experimental details
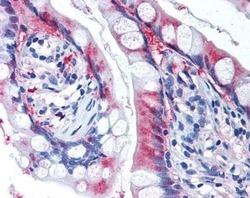
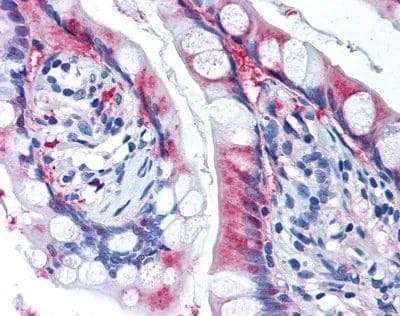
- Immunohistochemical analysis of SLC7A11 in the absorptive epithelia of small intestinal villi. Samples were incubated in SLC7A11 polyclonal antibody (Product # PA1-16893).
Supportive validation
- Submitted by
- Invitrogen Antibodies (provider)
- Main image
- Experimental details
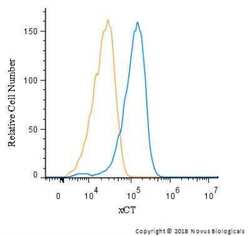
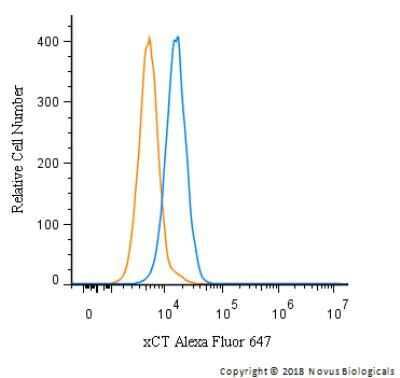
- Flow cytometry of SLC7A11 in HeLa cells. Samples were incubated in SLC7A11 polyclonal antibody (Product # PA1-16893) and a matched isotype control using a dilution of 2.5 µg/mL for 30 minutes at room temperature followed by Rabbit IgG APC-conjugated Secondary Antibody. Cells were fixed with 4% PFA and then permeablized with 0.1% saponin.
- Submitted by
- Invitrogen Antibodies (provider)
- Main image
- Experimental details
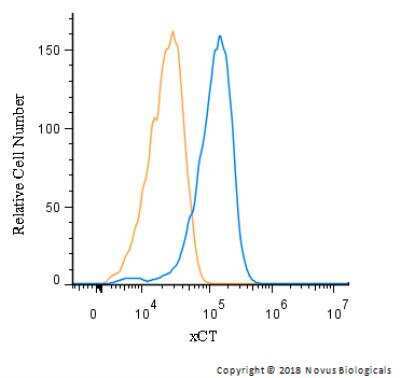
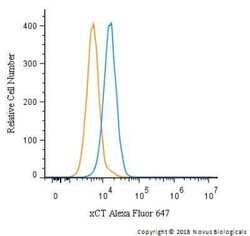
- Flow cytometry of SLC7A11 in HeLa cells. Samples were incubated in SLC7A11 polyclonal antibody (Product # PA1-16893) using a dilution of 2.5 µg/mL for 30 minutes at room temperature. Antibody (blue) and a matched isotype control (orange). Cells were fixed with 4% PFA and then permeabilized with 0.1% saponin. Both antibodies were conjugated to Alexa Fluor 647.
Supportive validation
- Submitted by
- Invitrogen Antibodies (provider)
- Main image
- Experimental details
- NULL
- Submitted by
- Invitrogen Antibodies (provider)
- Main image

- Experimental details
- NULL
- Submitted by
- Invitrogen Antibodies (provider)
- Main image

- Experimental details
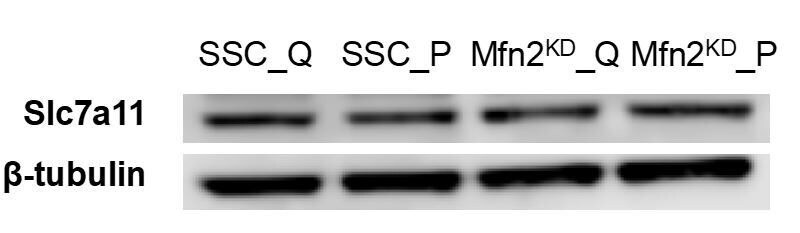
- Author response image 2. Immunoblot of SLC7A11 from whole-cell lysates for scrambled siRNA control cells in the quiescent state (SSC_Q), siRNA control cells in the proliferating state (SSC_P), Mfn2 knockdown cells in the quiescent state (Mfn2 KD _Q), and Mfn2 knockdown cells in the proliferating state (Mfn2 KD _P).
- Submitted by
- Invitrogen Antibodies (provider)
- Main image

- Experimental details
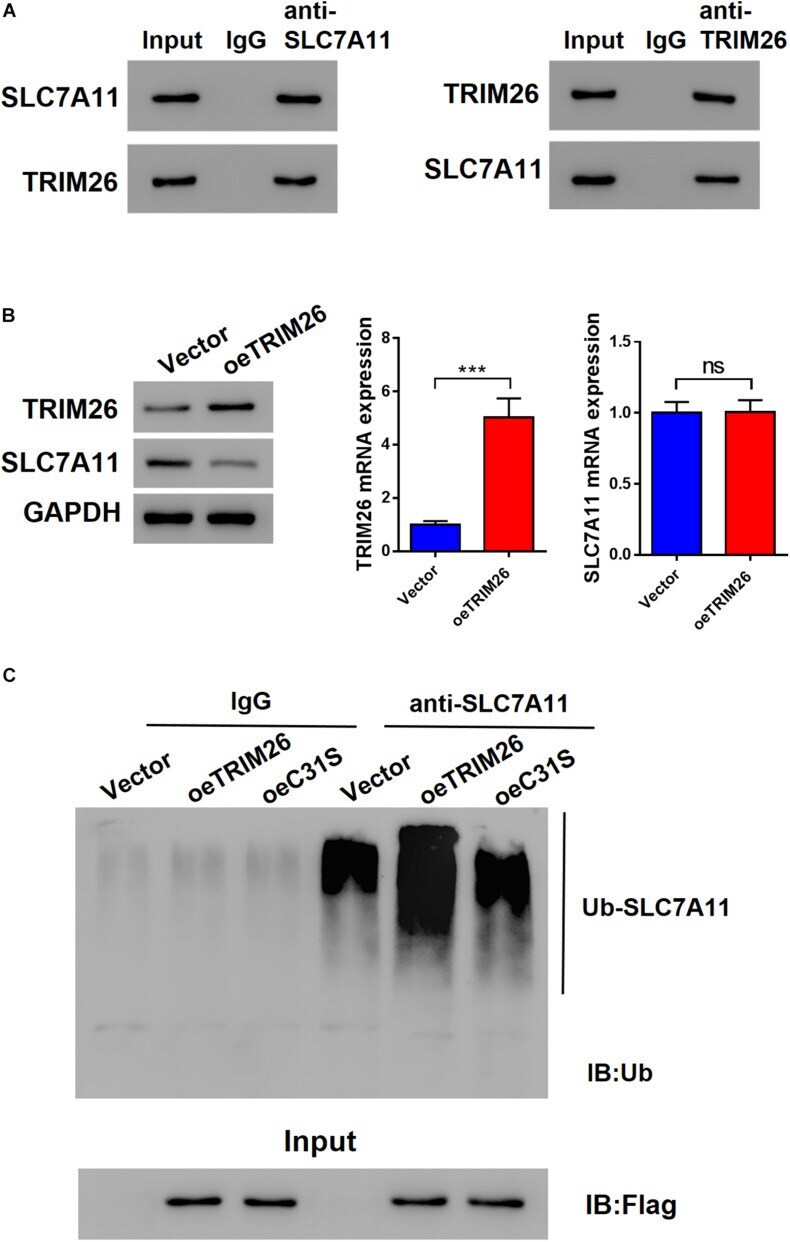
- FIGURE 4 Interactions between TRIM26 and SLC7A11. (A) Co-immunoprecipitation of TRIM26 and SLC7A11 in LX-2 cells. (B) Protein and mRNA expressions of TRIM26 and SLC7A11 in Vector- or oe TRIM26 plasmid-transfected LX-2 cells. (C) SLC7A11 ubiquitination in Vector-, oe TRIM26 plasmid, or oe C31S plasmid-transfected LX-2 cells. *** P < 0.001. ns: not significant.
- Submitted by
- Invitrogen Antibodies (provider)
- Main image

- Experimental details
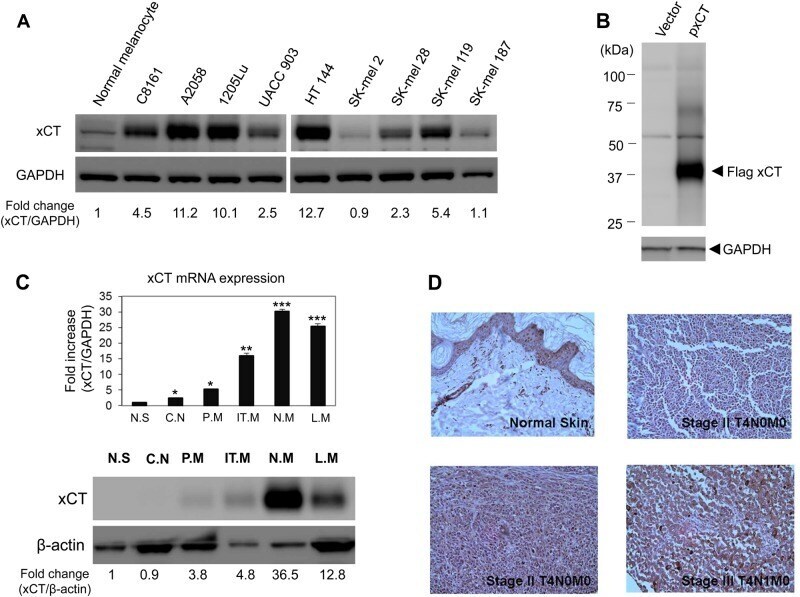
- Fig. 1 Expression of xCT in human melanoma cell lines and tumors. a Western immunoblots were conducted to assess xCT protein expression from one normal human melanocytes and a panel of human melanoma cell lines. Two out of nine melanoma cell lines demonstrated relatively low levels of endogenous xCT protein (SK-mel2 and SK-mel187). Relative expression of xCT was presented as a fold change compared to normal melanocytes. b Transient transfection of empty vector and exogenous xCT cDNA in HEK293T cells was performed, followed by western analysis at 48 h post-transfection. GAPDH was used as loading control. c An example of xCT expression in human melanoma tumor specimens at various stages. Quantitative RT-PCR was performed to evaluate mRNA expression of xCT in tumor samples. In the bar graph (top panel), the values were presented as the mean +- SEM of three independent experiments. * P < 0.05, ** P < 0.01, and *** P < 0.001. Normalization of xCT mRNA to GAPDH levels showed an increase of xCT as the disease progressed. N.S., normal skin, C.N., congenital nevi, P.M., primary melanoma, IT.M., in-transit melanoma, N.M., nodal metastatic melanoma, L.M., lymph node metastatic melanoma. Bottom panel: western immunoblots were conducted to assess levels of xCT protein expression. Relative expression of xCT was presented as a fold change compared to normal skin. N.S., normal skin, C.N., congenital nevi, P.M., primary melanoma, IT.M., in-transit melanoma, N.M., nodal metastatic melanoma, L.
- Submitted by
- Invitrogen Antibodies (provider)
- Main image

- Experimental details
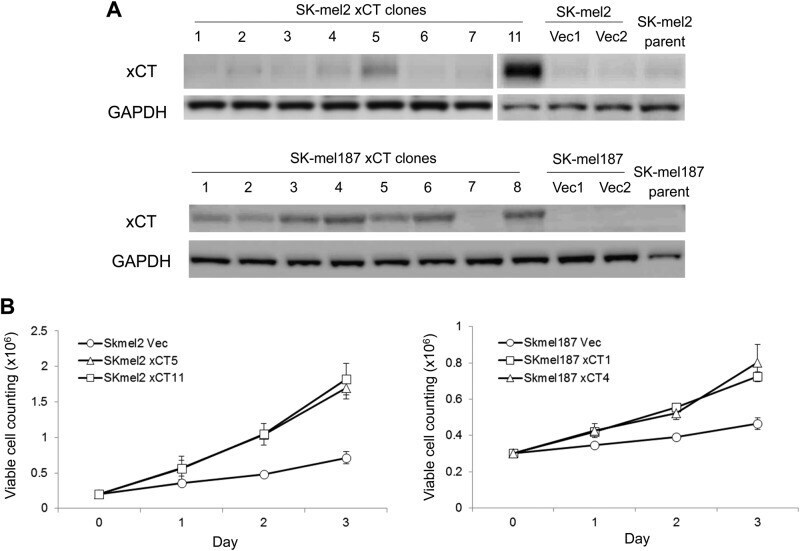
- Fig. 2 The pro-proliferative effect of xCT in human melanomas. a Western immunoblots on protein lysates from several stable clones that have been transfected with either empty vector or exogenous xCT cDNA in two melanoma cell lines (SK-mel2 and SK-mel187) with the lowest endogenous xCT expression (Fig. 1a) . b Cellular growth was measured on stable xCT or empty vector clones derived from SK-mel2 and SK-mel187 cells. Viable cells were counted using trypan blue exclusion method
- Submitted by
- Invitrogen Antibodies (provider)
- Main image
- Experimental details
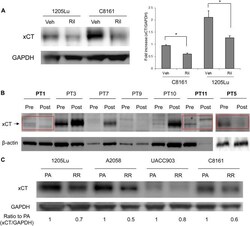
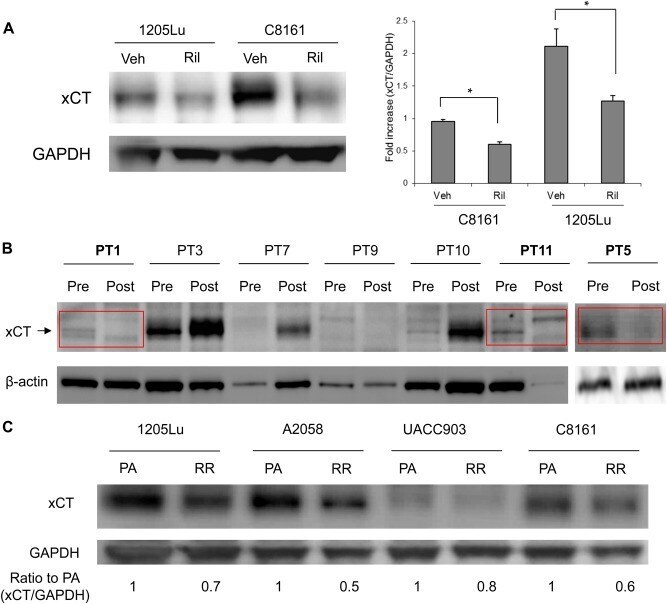
- Fig. 5 The effect of riluzole on xCT expression in xenograft tumors, riluzole resistant human cell lines, and tumor biopsies from a riluzole monotherapy phase II clinical study. a Quantification of endogenous xCT protein expression by western immunoblots using excised xenografts derived from human melanoma cell lines, C8161 and 1205Lu. Xenografted tumors were treated with vehicle (DMSO) or riluzole (7.5 mg/kg) daily by oral gavage for 3 weeks. Western blot data shows decreased level of endogenous xCT protein in riluzole treated samples compared to vehicle-treated ones (left panel). Quantifications were done and normalized to GAPDH (right panel). For the bar graphs, values are presented as the mean +- SEM from three independent experiments; * P < 0.05, compared with each control (Veh). b Western immunoblots assessing endogenous xCT levels in pre- and post-riluzole treated patient tumors from phase II riluzole monotherapy clinical trial. High endogenous level of xCT in post-treatment tumors are generally correlated with poor prognosis (4/7). Three clinically responded stable disease patients (PT1, PT11, PT5) showed a decreased level of xCT protein in post-treatment compared to that of pre-treatment samples. beta-actin was used as loading control. c Melanoma cells resistant to riluzole were selected by growing cells in the presence of low concentration of riluzole (5 muM) for 3 passages. Protein lysates were prepared and subjected to western immunoblots. Relative expression of
- Submitted by
- Invitrogen Antibodies (provider)
- Main image
- Experimental details
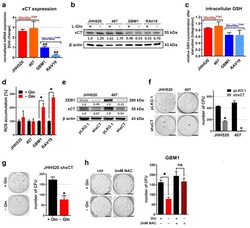
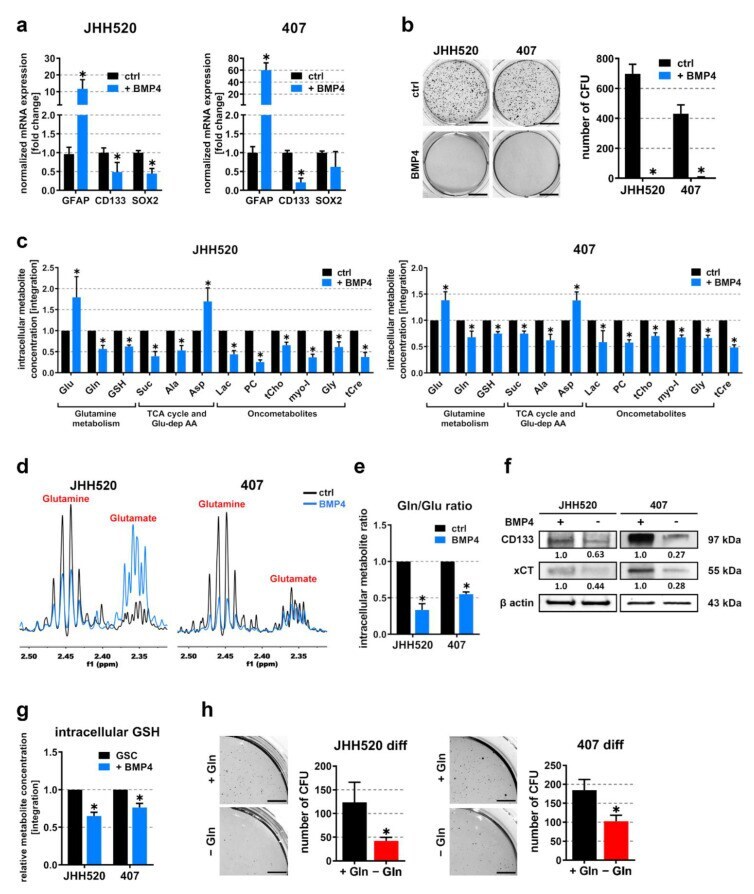
- Figure 3 xCT-dependent ROS clearance mediates starvation resistance. Both mRNA ( a ) and protein ( b ) expression of the glutamate/cystine antiporter xCT were elevated in GSCs with high Gln/Glu ratios (JHH520 and 407) (loading control = beta actin) ( n = 3, significance was calculated with a one-way ANOVA, * significantly decreased ( p < 0.05) compared to JHH520, # significantly decreased ( p < 0.05) compared to 407). ( c ) Relative GSH concentrations of L-Gln-starved cells (compared to controls in full medium) assessed with 1 H-NMR spectroscopy of metabolic extracts ( n = 3, significance calculated with one-way ANOVA). ( d ) ROS accumulation in L-Gln-starved and control cells measured by means of DCF fluorescence intensity ( n >= 3). ( e ) Immunoblotting verification of shRNA-based xCT knockdown and ZEB1 expression in shxCT and pLKO.1 (control) cells (loading control = beta actin). ( f ) Soft agar colony formation in shxCT and pLKO.1 (control) cells ( n = 3). ( g ) Soft agar colony formation in JHH shxCT cells cultured in the presence or absence of L-Gln ( n = 3). ( h ) Soft agar colony formation in GBM1 cells starved for L-Gln in either the presence or absence of 3 mM NAC. For all soft agar assays, representative pictures of NBT-stained colonies and quantifications of three assays are shown ( n = 3, scale bar equals 1 cm). For all assays, the data are presented as mean +- SD. Significance was calculated with a one-sided t -test if not specified elsewhere, * p < 0.05. Abbrev

- Submitted by
- Invitrogen Antibodies (provider)
- Main image
- Experimental details
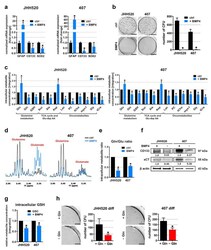
- Figure 4 Differentiation of GSCs restores starvation sensitivity. ( a ) Differentiation of highly clonogenic GSC neurospheres (JHH520 and 407) was verified by means of quantitative real-time PCR, showing increased expression of GFAP and reduced expression of CD133 and SOX2 after 48 h treatment with 50 ng/mL BMP4 and ( b ) by soft agar colony formation assays, showing diminished in vitro clonogenicity upon 50 ng/mL BMP4 treatment ( n = 3). Scale bar equals 1 cm. ( c ) Relative metabolite concentrations from metabolic extracts of GSC neurospheres cultured in the presence of solvent control (black) or 50 ng/mL BMP4 (blue) ( n = 3). ( d ) Expanded regions from 1 H-NMR spectra showing Gln and Glu multiplets and ( e ) corresponding Gln/Glu ratios of differentiated (BMP4) and control GSC cultures ( n = 3). ( f ) Differentiation of GSCs with 50 ng/mL BMP4 for 48 h reduced CD133 and xCT protein levels, as assessed with immunoblotting (loading control = beta actin). ( g ) Relative GSH concentrations in differentiated (BMP4) and control GSCs as assessed with 1 H-NMR spectroscopy of metabolic extracts ( n = 3). ( h ) Soft agar colony formation in differentiated (50 ng/mL BMP4) GSCs cultured in either the presence or absence of L-Gln. Due to the small colony size of differentiated GSCs, expanded regions of wells were chosen. Scale bar equals 0.5 cm. For all soft agar assays, representative pictures of NBT stained colonies and quantifications are shown ( n = 3). For all assays, the data ar
- Submitted by
- Invitrogen Antibodies (provider)
- Main image
- Experimental details
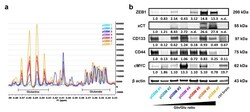
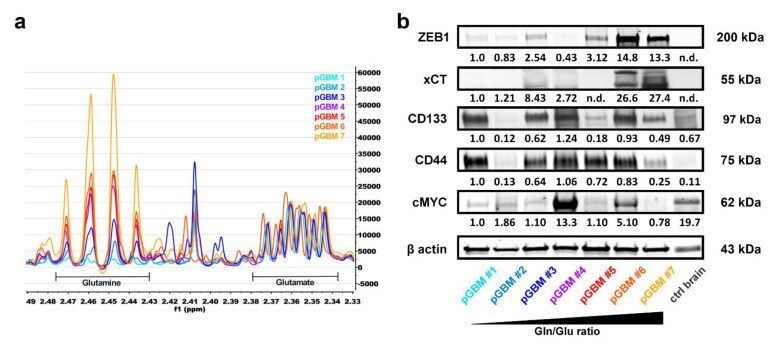
- Figure 5 High Gln/Glu ratios predict ZEB1 and xCT expression in primary GBM tumors. ( a ) Expanded regions from 1 H-NMR spectra showing Gln and Glu multiplets of metabolic extracts from seven primary glioblastoma (pGBM) patient samples. Spectra were normalized to the Glu content to visualize the differences in Gln/Glu ratios. ( b ) Immunoblotting of ZEB1, xCT, CD133, CD44, and cMYC protein in GBM patient samples arranged according to their Gln/Glu ratios in ascending order (loading control = beta actin). A non-neoplastic brain sample of a trauma patient was blotted as a control. Abbreviations: ctrl, control; Gln, glutamine; Glu, glutamate; n.d., not detectable; pGBM, primary glioblastoma; ppm, parts per million. Supplementary Figures 5 (S5) and 6 (S6) correspond to Figure 5 b.
- Submitted by
- Invitrogen Antibodies (provider)
- Main image

- Experimental details
- FIGURE 6 Validation of ferroptosis-associated gene markers. (A) : validation of gene marker mRNA levels in the hippocampus for ferroptosis by qRT-PCR. (B,C) : Validation of GPX4 and SLC7A11 protein expression level in the hippocampus by western blot. n = 3-6 rats/group, * p < 0.05 vs sham group. The student's t test was used for comparisons.