 Explore
 Validate
 Learn
Learn Western blot
 Immunohistochemistry
 Flow cytometry
Antibody data
- Antibody Data
- Antigen structure
- References [1]
- Comments [0]
- Validations
- Flow cytometry [4]
- Other assay [2]
Submit
Validation data
Reference
Comment
Report error
- Product number
- PA5-95477 - Provider product page

- Provider
- Invitrogen Antibodies
- Product name
- TREM1 Polyclonal Antibody
- Antibody type
- Polyclonal
- Antigen
- Recombinant full-length protein
- Description
- Reconstitute with 0.2 mL of distilled water to yield a concentration of 500 µg/mL. Positive Control - Flow: Human PBMC cell.|Store at -20°C for one year from date of receipt. After reconstitution, at 4°C for one month. It can also be aliquotted and stored frozen at -20°C for six months. Avoid repeated freeze-thaw cycles.
- Reactivity
- Human
- Host
- Rabbit
- Isotype
- IgG
- Vial size
- 100 μg
- Concentration
- 500 μg/mL
- Storage
- -20°C
Submitted references Identification of Immune-Related Genes Contributing to the Development of Glioblastoma Using Weighted Gene Co-expression Network Analysis.
Kong Y, Feng ZC, Zhang YL, Liu XF, Ma Y, Zhao ZM, Huang B, Chen AJ, Zhang D, Thorsen F, Wang J, Yang N, Li XG
Frontiers in immunology 2020;11:1281
Frontiers in immunology 2020;11:1281
No comments: Submit comment
Supportive validation
- Submitted by
- Invitrogen Antibodies (provider)
- Main image
- Experimental details
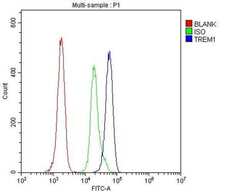
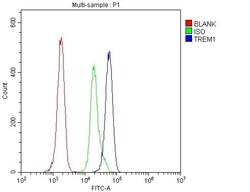
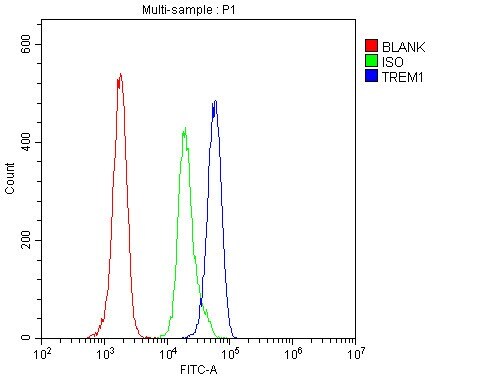
- Flow cytometry of TREM1 in H-PBMC cells (blue line), isotype control rabbit IgG (green line) and unlabeled (red line). Samples were blocked with 10% goat serum, incubated with TREM1 polyclonal antibody (Product # PA5-95477) at a dilution of 1 µg (per 1x10^6 cells), followed by 488 conjugated goat anti-rabbit IgG (30 min at 20°C) using a 5-10 µg (per 1x10^6 cells) dilution.
- Submitted by
- Invitrogen Antibodies (provider)
- Main image
- Experimental details
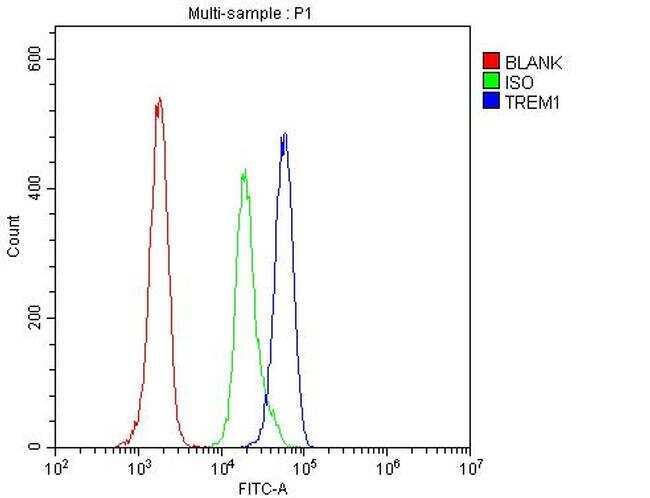
- Flow Cytometry of TREM1 in human PBMC cells (blue line), isotype control rabbit IgG (green line) and unlabeled (red line). Samples were blocked with 10% goat serum, incubated with TREM1 Polyclonal Antibody (Product # PA5-95477) at a dilution of 1 μg (per 1x10^6 cells), followed by DyLight®488 conjugated goat anti-rabbit IgG (for 30 minutes at 20°C) using 5-10 μg (per 1x10^6 cells) dilution.

- Submitted by
- Invitrogen Antibodies (provider)
- Main image

- Experimental details
- Flow Cytometry of TREM1 in human PBMC cells (blue line), isotype control rabbit IgG (green line) and unlabeled (red line). Samples were blocked with 10% goat serum, incubated with TREM1 Polyclonal Antibody (Product # PA5-95477) at a dilution of 1 μg (per 1x10^6 cells), followed by DyLight®488 conjugated goat anti-rabbit IgG (for 30 minutes at 20°C) using 5-10 μg (per 1x10^6 cells) dilution.
- Submitted by
- Invitrogen Antibodies (provider)
- Main image
- Experimental details
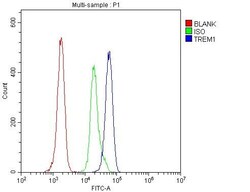
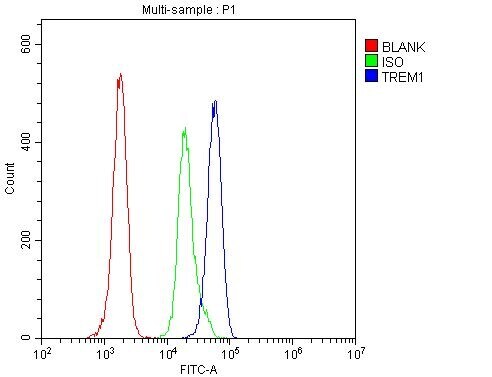
- Flow cytometry analysis of TREM1 in H-PBMC cells using TREM1 Polyclonal Antibody (Product # PA5-95477), shown in overlay histogram (blue line). The cells were fixed with 4% paraformaldehyde and blocked with 10% normal goat serum, and incubated with the primary antibody (1 μg/1x10^6 cells) for 30 min at 20°C. DyLight 488 conjugated goat anti-rabbit IgG (5-10 µg/1x10^6 cells) was used as secondary antibody for 30 minutes at 20°C. Isotype control antibody (Green line) was rabbit IgG (1 µg/1x10^6) used under the same conditions. Unlabelled sample without incubation with primary antibody and secondary antibody (Red line) was used as a blank control.
Supportive validation
- Submitted by
- Invitrogen Antibodies (provider)
- Main image

- Experimental details
- NULL
- Submitted by
- Invitrogen Antibodies (provider)
- Main image
- Experimental details
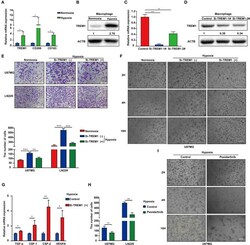
- Figure 6 Inhibition of TREM1 suppresses migration and vasculary mimicry formation of GBM cells in vitro . (A) RT-qPCR results for TREM1, CD206 , and CD163 in macrophages derived from the THP1 cell line under normoxia and hypoxia. (B) Western blot analysis of TREM1 protein levels under normoxia and hypoxia. (C) Graphical representation of qRT-PCR after siRNA knockdown of TREM1. ACTB was used as an internal reference. (D) Western blot to validate the efficiency of si-TREM1 knockdown in macrophages derived from the THP1 cell line. ACTB was used as a protein loading control. (E) Representative images of Transwell migration for U87MG and LN229 under normoxia, hypoxia plus control, and hypoxia plus si-TREM1 (scale bar: 200 mum). Statistical results of the invasive ratio with corresponding treatment for 24 h in the Transwell assay. (F) Representative images of VM formation assay for U87MG in normoxia, hypoxia plus control, and hypoxia plus si-TREM1. (G) RT-qPCR to detect mRNA expression of TGF- alpha, CSF1, CSF2 , and VEGFA after knockdown of TREM1 under hypoxia. (H) Statistical results of the invasive ratio for U87MG and LN229 in both control and pexidartinib (10 muM) treatment under hypoxia. (I) Representative images of VM formation assay for U87MG in both control and pexidartinib (10 muM) groups under hypoxic conditions. Significant difference between the two groups: * P < 0.05; ** P < 0.01; *** P < 0.001.
