 Explore
 Validate
 Learn
Learn Western blot
 Immunohistochemistry
Antibody data
- Antibody Data
- Antigen structure
- References [1]
- Comments [0]
- Validations
- Immunohistochemistry [1]
- Flow cytometry [2]
- Other assay [3]
Submit
Validation data
Reference
Comment
Report error
- Product number
- PA5-14896 - Provider product page

- Provider
- Invitrogen Antibodies
- Product name
- CYP3A4 Polyclonal Antibody
- Antibody type
- Polyclonal
- Antigen
- Synthetic peptide
- Reactivity
- Human
- Host
- Rabbit
- Isotype
- IgG
- Vial size
- 200 μL
- Concentration
- 0.5 mg/mL
- Storage
- Store at 4°C short term. For long term storage, store at -20°C, avoiding freeze/thaw cycles.
Submitted references β-Naphtoflavone and Ethanol Induce Cytochrome P450 and Protect towards MPP⁺ Toxicity in Human Neuroblastoma SH-SY5Y Cells.
Fernandez-Abascal J, Ripullone M, Valeri A, Leone C, Valoti M
International journal of molecular sciences 2018 Oct 28;19(11)
International journal of molecular sciences 2018 Oct 28;19(11)
No comments: Submit comment
Supportive validation
- Submitted by
- Invitrogen Antibodies (provider)
- Main image
- Experimental details
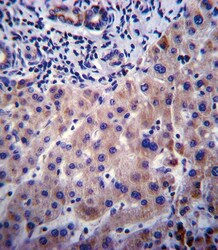
- Immunohistochemistry analysis of CYP3A4 in formalin fixed and paraffin embedded human liver tissue. Samples were incubated with CYP3A4 polyclonal antibody (Product # PA5-14896) followed by peroxidase conjugation of the secondary antibody and DAB staining. This data demonstrates the use of this antibody for immunohistochemistry. Clinical relevance has not been evaluated.

Supportive validation
- Submitted by
- Invitrogen Antibodies (provider)
- Main image
- Experimental details
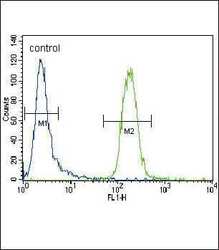
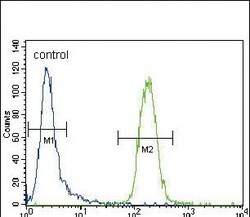
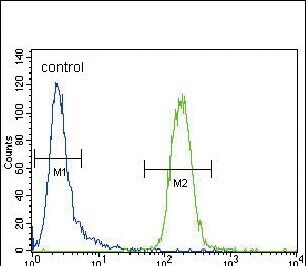
- Flow cytometry analysis of CEM cells using a CYP3A4 polyclonal antibody (Product # PA5-14896) (right) compared to a negative control cell (left) at a dilution of 1:10-50, followed by a FITC-conjugated goat anti-rabbit antibody
- Submitted by
- Invitrogen Antibodies (provider)
- Main image
- Experimental details
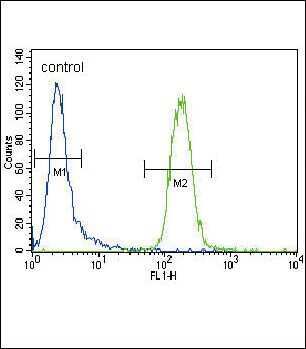
- Flow cytometry of CYP3A4 in CEM cells (right histogram). Samples were incubated with CYP3A4 polyclonal antibody (Product # PA5-14896) followed by FITC-conjugated goat-anti-rabbit secondary antibody. Negative control cell (left histogram).
Supportive validation
- Submitted by
- Invitrogen Antibodies (provider)
- Main image
- Experimental details
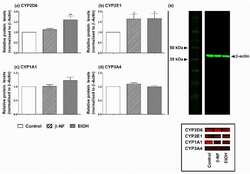
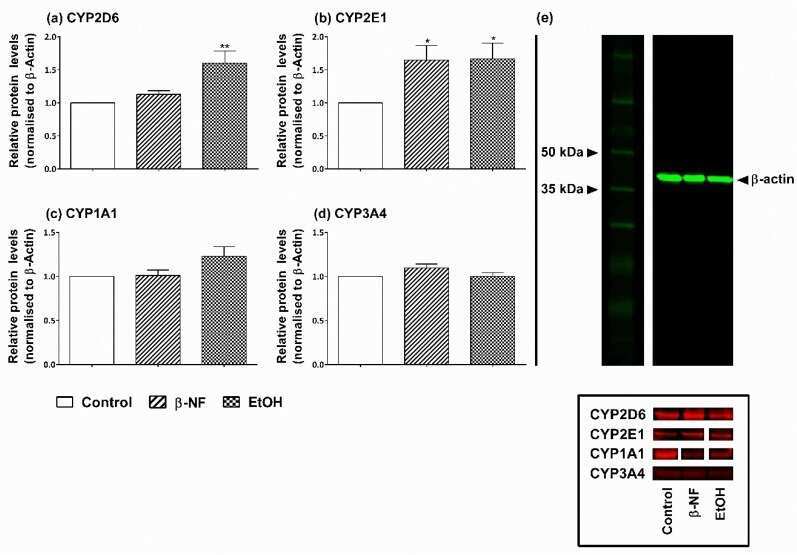
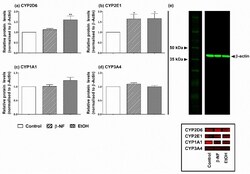
- Figure 2 Effect of beta-NF and EtOH treatment on cytochrome P450 (CYP) isoforms' expression in undifferentiated SH-SY5Y cells. ( a - d ) The graphs show the relative protein levels quantification by Western blot for the CYP2D6 ( a ), 2E1 ( b ), 1A1 ( c ), and 3A4 ( d ) isoforms after treating cells with the inducers for 48 h (see Section 4 ). Data was acquired by measuring the fluorescent intensity per pixel on each band. The relative amount of protein normalised with beta-actin as a housekeeping protein for each condition was plotted as fold-increase and compared to the control, which was given a value of 1. Columns represent the mean +- SEM of at least three different experiments. Statistical significance was analyzed by one-way ANOVA followed by a Tukey post-test (* p < 0.05; ** p < 0.01). ( e ) Top panel shows a representative blot of beta-actin housekeeping protein detected with secondary antibody Cy3 (green) in control (2nd lane), beta-NF (3rd lane) and EtOH (4th lane) treatments. ( e ) Bottom panel shows representative blots of each isoform detected with secondary antibody Cy5 (red) in the mentioned conditions.
- Submitted by
- Invitrogen Antibodies (provider)
- Main image
- Experimental details
- Figure 2 Effect of beta-NF and EtOH treatment on cytochrome P450 (CYP) isoforms' expression in undifferentiated SH-SY5Y cells. ( a - d ) The graphs show the relative protein levels quantification by Western blot for the CYP2D6 ( a ), 2E1 ( b ), 1A1 ( c ), and 3A4 ( d ) isoforms after treating cells with the inducers for 48 h (see Section 4 ). Data was acquired by measuring the fluorescent intensity per pixel on each band. The relative amount of protein normalised with beta-actin as a housekeeping protein for each condition was plotted as fold-increase and compared to the control, which was given a value of 1. Columns represent the mean +- SEM of at least three different experiments. Statistical significance was analyzed by one-way ANOVA followed by a Tukey post-test (* p < 0.05; ** p < 0.01). ( e ) Top panel shows a representative blot of beta-actin housekeeping protein detected with secondary antibody Cy3 (green) in control (2nd lane), beta-NF (3rd lane) and EtOH (4th lane) treatments. ( e ) Bottom panel shows representative blots of each isoform detected with secondary antibody Cy5 (red) in the mentioned conditions.

- Submitted by
- Invitrogen Antibodies (provider)
- Main image
- Experimental details
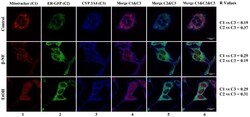
- Figure 7 Immunostaining of CYP3A4 in SH-SY5Y cells after beta-NF and EtOH treatment. Representative immunofluorescence images of each experimental condition. Column 1 represents mitochondrial stain (red), column 2 represents ER-Green Fluorescent Protein (GFP) stain (green), and column 3 reports the CYP3A4 staining (blue). Column 4 represents the merge between CYP3A4 and mitochondria channel, column 5 represents the merge between CYP3A4 and ER-GFP, and column 6 represents the merge of the three channels. R Values: Pearson's correlation coefficient. Scale bar: 20 um.
