Explore
 Validate
 Learn
LearnPA5-29865
antibody from Invitrogen Antibodies
Targeting: NR1D1
ear-1, hRev, Rev-ErbAalpha, REVERBA, REVERBalpha, THRA1, THRAL
 Western blot
 Immunocytochemistry
Antibody data
- Antibody Data
- Antigen structure
- References [2]
- Comments [0]
- Validations
- Immunocytochemistry [3]
- Immunohistochemistry [2]
- Other assay [6]
Submit
Validation data
Reference
Comment
Report error
- Product number
- PA5-29865 - Provider product page

- Provider
- Invitrogen Antibodies
- Product name
- NR1D1 Polyclonal Antibody
- Antibody type
- Polyclonal
- Antigen
- Recombinant full-length protein
- Description
- Recommended positive controls: Human NR1D1-transfected 293T cells. Predicted reactivity: Mouse (93%), Rat (93%), Sheep (92%), Bovine (91%). Store product as a concentrated solution. Centrifuge briefly prior to opening the vial.
- Reactivity
- Human, Mouse
- Host
- Rabbit
- Isotype
- IgG
- Vial size
- 100 μL
- Concentration
- 0.77 mg/mL
- Storage
- Store at 4°C short term. For long term storage, store at -20°C, avoiding freeze/thaw cycles.
Submitted references Circadian control of hepatitis B virus replication.
Novel Function of Rev-erbα in Promoting Brown Adipogenesis.
Zhuang X, Forde D, Tsukuda S, D'Arienzo V, Mailly L, Harris JM, Wing PAC, Borrmann H, Schilling M, Magri A, Rubio CO, Maidstone RJ, Iqbal M, Garzon M, Minisini R, Pirisi M, Butterworth S, Balfe P, Ray DW, Watashi K, Baumert TF, McKeating JA
Nature communications 2021 Mar 12;12(1):1658
Nature communications 2021 Mar 12;12(1):1658
Novel Function of Rev-erbα in Promoting Brown Adipogenesis.
Nam D, Chatterjee S, Yin H, Liu R, Lee J, Yechoor VK, Ma K
Scientific reports 2015 Jun 10;5:11239
Scientific reports 2015 Jun 10;5:11239
No comments: Submit comment
Supportive validation
- Submitted by
- Invitrogen Antibodies (provider)
- Main image

- Experimental details
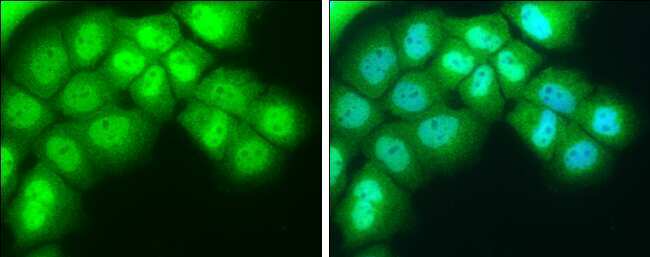
- Immunocytochemistry-Immunofluorescence analysis of NR1D1 was performed in A431 cells fixed in 4% paraformaldehyde at RT for 15 min. Green: NR1D1 Polyclonal Antibody (Product # PA5-29865) diluted at 1:400. Blue: Hoechst 33342 staining.
- Submitted by
- Invitrogen Antibodies (provider)
- Main image

- Experimental details
- Immunocytochemistry-Immunofluorescence analysis of NR1D1 was performed in A431 cells fixed in 4% paraformaldehyde at RT for 15 min. Green: NR1D1 Polyclonal Antibody (Product # PA5-29865) diluted at 1:400. Blue: Hoechst 33342 staining.

Supportive validation
- Submitted by
- Invitrogen Antibodies (provider)
- Main image
- Experimental details
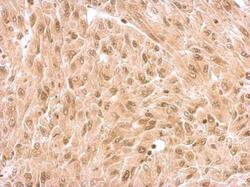
- NR1D1 Polyclonal Antibody detects NR1D1 protein at nucleus on U87 xenograft by immunohistochemical analysis. Sample: Paraffin-embedded U87 xenograft. NR1D1 Polyclonal Antibody (Product # PA5-29865) dilution: 1:500. Antigen Retrieval: EDTA based buffer, pH 8.0, 15 min.
- Submitted by
- Invitrogen Antibodies (provider)
- Main image
- Experimental details
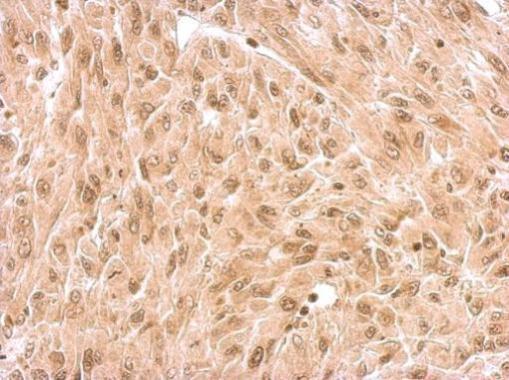
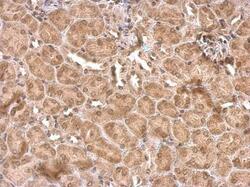
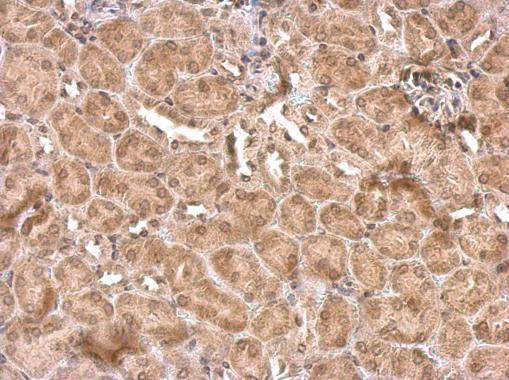
- NR1D1 Polyclonal Antibody detects NR1D1 protein at cytosol and nucleus on mouse kidney by immunohistochemical analysis. Sample: Paraffin-embedded mouse kidney. NR1D1 Polyclonal Antibody (Product # PA5-29865) dilution: 1:500. Antigen Retrieval: EDTA based buffer, pH 8.0, 15 min.
Supportive validation
- Submitted by
- Invitrogen Antibodies (provider)
- Main image
- Experimental details
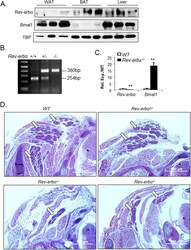
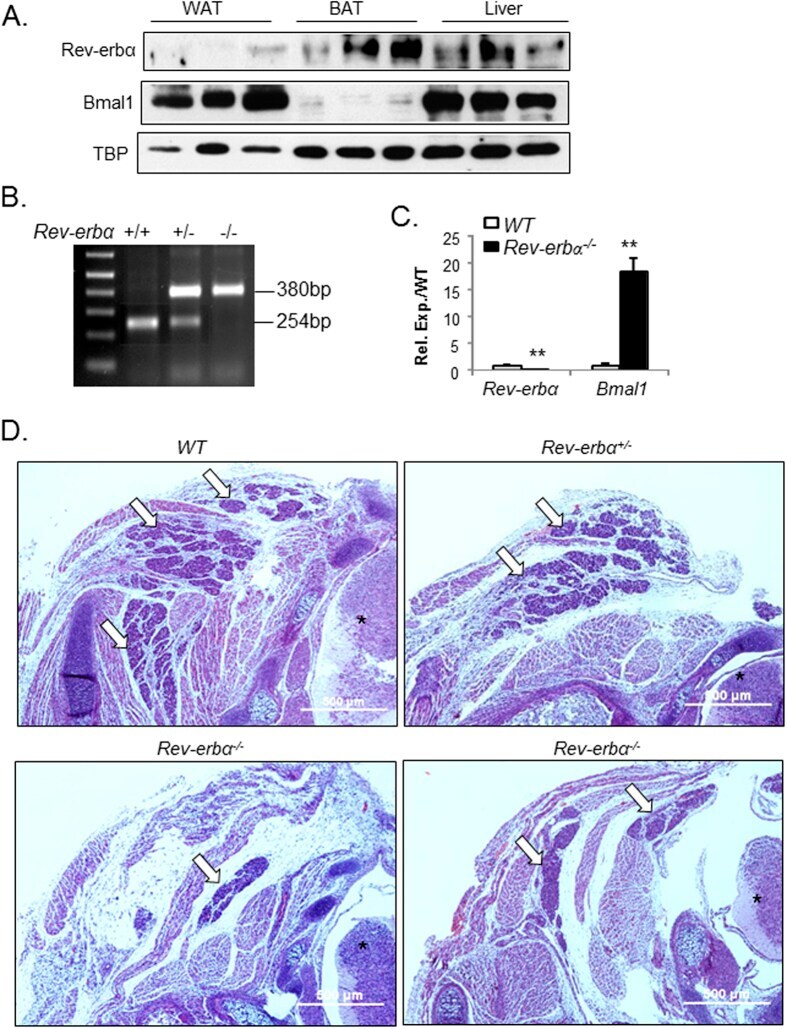
- Figure 1 Genetic ablation of Rev-erbalpha impairs brown adipose tissue development. ( A ) Cropped images of immunoblot analysis of Rev-erbalpha and Bmal1 protein in normal control mice brown fat under ambient temperature at 5 pm. ( B ) PCR genotyping of wild-type, Rev-erba +/- and Rev-erbalpha -/- mice as indicated by the 380 bp and 254 bp wild-type alleles. ( C ) RT-qPCR analysis showing absence of Rev-erbalpha expression and up-regulation of Bmal1 in Rev -erbalpha -/- mice brown fat (n = 5-6). **: P < 0.01 Rev-erbalpha -/- vs. WT. ( D ) Representative images of H/E histology of interscapular brown fat (one side, 4X) of E18.5 embryos. Serial sections through the neck were obtained, and images of the same anatomical position were compared in Rev-erbalpha -/- , Rev-erbalpha +/- and WT mice. Arrows denote brown fat and asterisks indicate spinal cord.
- Submitted by
- Invitrogen Antibodies (provider)
- Main image
- Experimental details
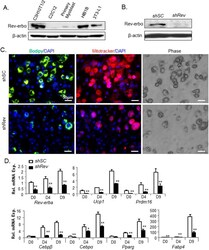
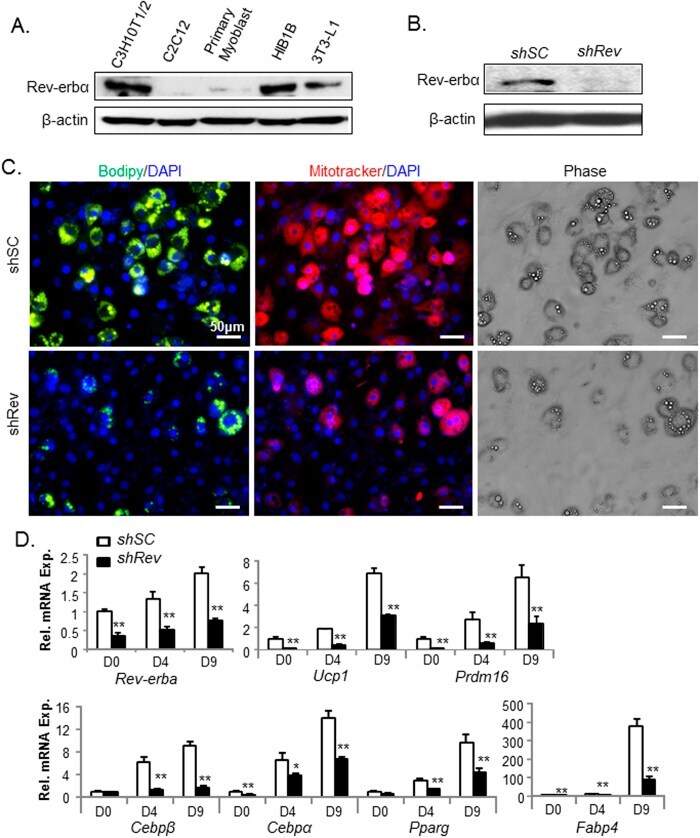
- Figure 3 Effect of stable Rev-erbalpha knockdown on C3H10T1/2 brown adipogenic differentiation. ( A ) Cropped image of Rev-erbalpha immunoblot in mesodermal lineage cell lines. Full-length images are shown in Fig. S7 . ( B ) Near absence of Rev-erbalpha protein in C3H10T1/2 cells with stable silencing of Rev-erbalpha ( shRev ) as compared to scrambled control ( shSC ). ( C ) Representative images of C3H10T1/2 lipid accumulation as shown by BODIPY staining, mitochondrial staining by Mitotracker, and phase contrast at day 9 of differentiation under a brown adipocyte induction condition. ( D ) RT-qPCR analysis of brown adipocyte marker gene expression in shSC and shRev 10T1/2 cells during brown differentiation induction time course at 0, 4 and 9 days of differentiation. *, **: P < 0.05 and 0.01 shRev vs. shSC .
- Submitted by
- Invitrogen Antibodies (provider)
- Main image

- Experimental details
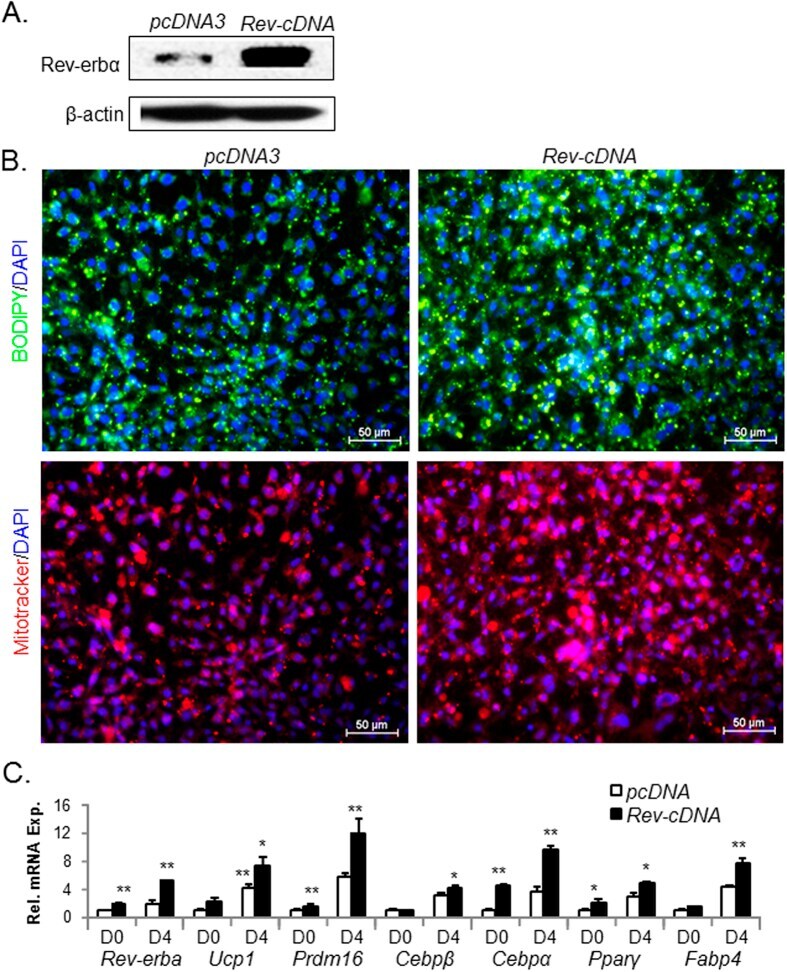
- Figure 5 Forced expression of Rev-erbalpha promotes HIB1B terminal differentiation. ( A ) Cropped image of Rev-erbalpha immunoblot analysis of HIB1B cells with stably expression of vector control (pcDNA3) or Rev-erbalpha cDNA (Rev-cDNA) construct. ( B ) Representative images of lipid accumulation as shown by BODIPY staining and mitochondrial staining by MitoTracker in day 6-differentiated pcDNA3 control or Rev-cDNA-expressing cells. ( C ) RT-qPCR analysis of brown adipocyte marker gene expression in day 4-differentiated pcDNA3 or Rev-cDNA cells. *, **: P < 0.05 and 0.01 or Rev-cDNA vs. pcDNA3.
- Submitted by
- Invitrogen Antibodies (provider)
- Main image
- Experimental details
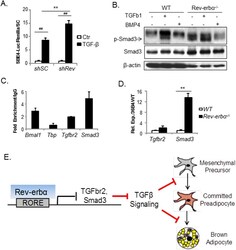
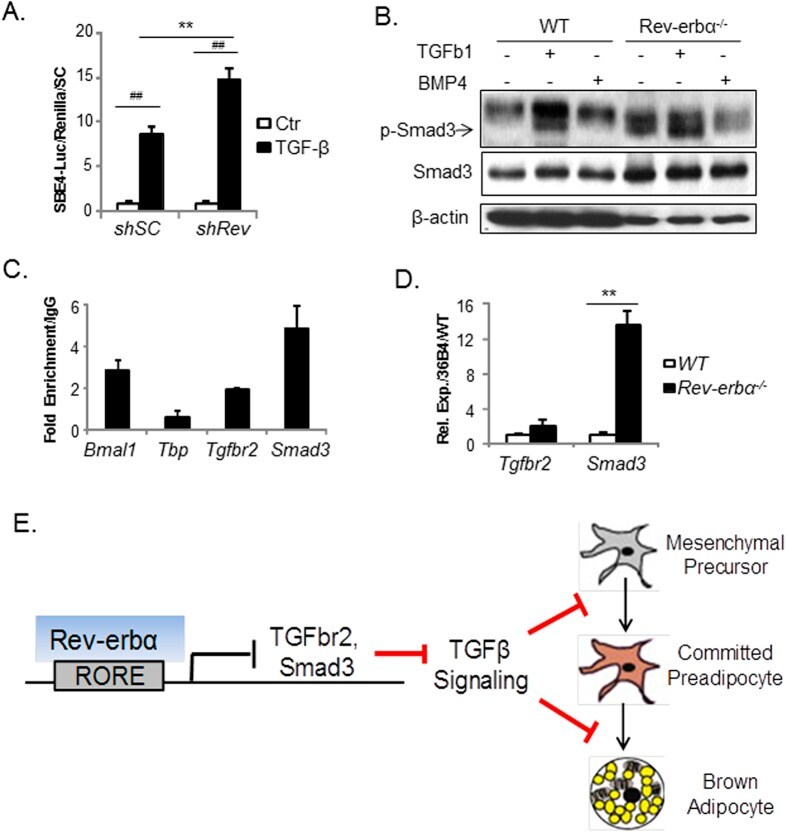
- Figure 8 Rev-erbalpha suppresses TGF-beta signaling via transcriptional control of key components of this pathway. ( A ) Analysis of TGF-beta activity in shSC and shRev HIB-1B cells as assessed by TGF-beta-responsive SBE4-Luc luciferase reporter assay (n = 4). ##: P < 0.01 TGF-beta-treated vs. control; **: P < 0.01 shRev vs. shSC . ( B ) TGF-beta signaling as analyzed by Smad3 phosphorylation in response to ligand treatment in WT and Rev-erbalpha -/- brown preadipocytes, with cropped images of immunoblot analysis shown and full-length images included in Fig. S8 . shown. Smad3 phosphorylation is assessed 1 hour after indicated ligand treatment (TGF-beta, 10 ng/ml, BMP4 100 ng/ml). ( C ) ChIP-qPCR analysis of Rev-erbalpha occupancy of identified RORE sites in TGF-beta pathway gene promoters. Rev-erbalpha binding in Bmal1 intron was used as a positive control, and non-specific sites on Tbp promoter was used as negative control. Values were calculated as fold enrichment of percentage of total input normalized to IgG (n = 4). ( D ) RT-qPCR analysis of TGF-beta pathway gene expression in immortalized WT and Rev-erbalpha -/- brown preadipocytes (n = 3). ( E ) Proposed model of Rev-erbalpha control of brown adipocyte lineage commitment and terminal differentiation through transcriptional regulation of the TGF-beta pathway.
- Submitted by
- Invitrogen Antibodies (provider)
- Main image
- Experimental details
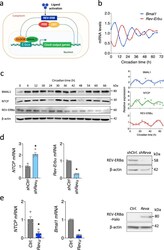
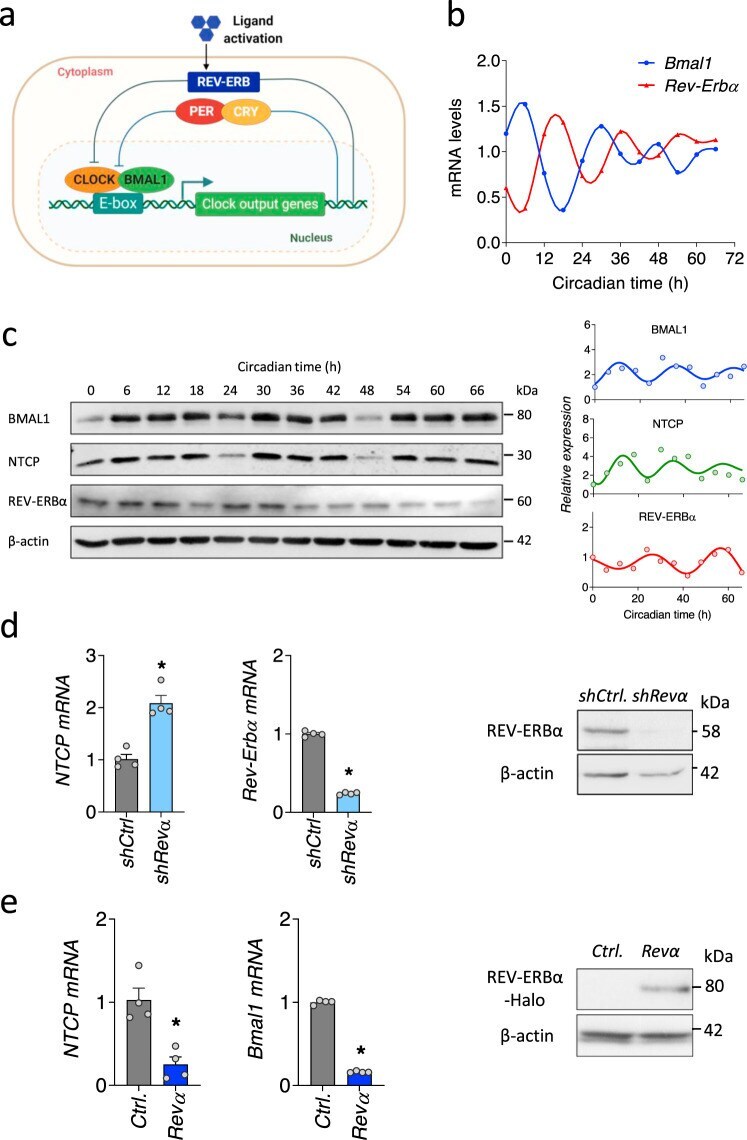
- Fig. 1 REV-ERBalpha coordinates the circadian expression of NTCP. a Circadian transcription-translation feedback loops generate daily rhythmic expression of circadian genes. The molecular clock generates a cycle of 24-hour periodicity when a heterodimeric transcription factor BMAL1-CLOCK activates the transcription from E-box sequences in target gene promoters. Gene products feedback to repress the transcriptional activity of the heterodimeric activator. Ligand activation of REV-ERB represses the transcription of Bmal1. b Synchronization of differentiated HepaRG cells (dHepaRG). dHepaRG cells were treated with dexamethasone at 100 nM for 2 h and samples collected at 6 h intervals. Bmal1 and Rev-Erbalpha mRNAs were measured by quantitative reverse transcription polymerase chain reaction (qRT-PCR) and expressed relative to the mean. Data are the average of two independent experiments. c Synchronized dHepaRG cells were assessed for BMAL1, NTCP and REV-ERBalpha expression together with housekeeping beta-actin by western blotting. Densitometric analysis quantified BMAL1, NTCP and REV-ERBalpha in individual samples and was normalized to their own beta-actin loading controls. Data are the average of two independent experiments. d Total RNA was extracted from control or Rev-Erbalpha silenced HepaRG cells and NTCP and Rev-Erbalpha mRNA levels measured by qRT-PCR. REV-ERBalpha expression together with housekeeping gene beta-actin were assessed by western blotting. Data are expressed re
- Submitted by
- Invitrogen Antibodies (provider)
- Main image

- Experimental details
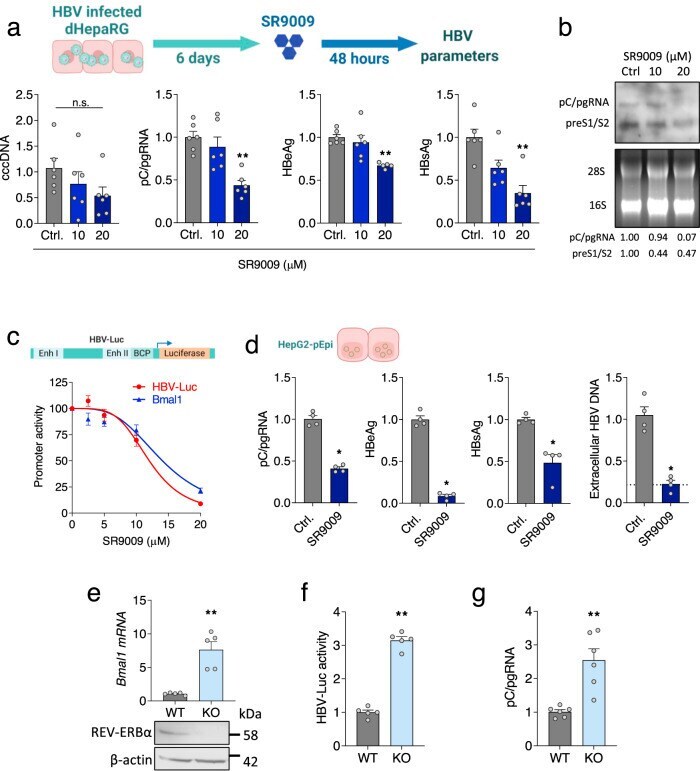
- Fig. 4 REV-ERBalpha regulates HBV transcription. a dHepaRG cells were infected with HBV for 6 days followed by SR9009 treatment (10 or 20 uM) for 48 h. HBV parameters: cccDNA, pC/gRNA, HBeAg and HBsAg were determined by qRT-PCR or ELISA assays. In all cases, data are expressed relative to untreated (Ctrl) cells (mean +- SEM, n = 6, Kruskal-Wallis ANOVA with Dunn's test). b HBV transcripts in the SR9009 treated dHepaRG cells were quantified by northern blotting. Densitometric analysis quantified pC/pgRNA and preS1/S2 transcripts and was normalized to the 28 S and 18 S rRNA loading controls. c HepG2-NTCP cells were transfected with HBV EnhI/II-BCP or Bmal1 promoter luciferase reporters for 48 h and treated with SR9009 for 24 h and promoter activity quantified by measuring luciferase activity (mean +- SEM, n = 4-6). d HepG2-pEpi cells were treated with SR9009 (20 uM) for 48 h. HBV parameters: pC/pgRNA, HBsAg, HBeAg and extracellular particle HBV DNA were determined by qRT-PCR or ELISA assays. The reverse transcriptase inhibitor Entecavir (ETV, 1 muM) was included as positive control for the genesis of de novo particles and is represented by the dashed line. In all cases, data are expressed relative to untreated (Ctrl) cells (mean +- SEM, n = 4, Mann-Whitney test, Two-sided). e Parental (WT) or Rev-erbalpha KO HepG2-NTCP cell lysates were assessed for REV-ERBalpha expression together with housekeeping gene beta-actin by western blotting. Total RNA was extracted and Bmal1 mRNA lev