Explore
 Validate
 Learn
LearnPA5-48353
antibody from Invitrogen Antibodies
Targeting: FADS2
D6D, DES6, FADSD6, LLCDL2, SLL0262, TU13
 Western blot
 Immunocytochemistry
Antibody data
- Antibody Data
- Antigen structure
- References [1]
- Comments [0]
- Validations
- Immunocytochemistry [1]
- Immunohistochemistry [1]
- Flow cytometry [2]
- Other assay [1]
Submit
Validation data
Reference
Comment
Report error
- Product number
- PA5-48353 - Provider product page

- Provider
- Invitrogen Antibodies
- Product name
- FADS2 Polyclonal Antibody
- Antibody type
- Polyclonal
- Antigen
- Synthetic peptide
- Description
- Predicted to react with monkey based on sequence homology.
- Reactivity
- Human
- Host
- Rabbit
- Isotype
- IgG
- Vial size
- 200 μL
- Concentration
- 0.48 mg/mL
- Storage
- Store at 4°C short term. For long term storage, store at -20°C, avoiding freeze/thaw cycles.
Submitted references Expression of SCD and FADS2 Is Lower in the Necrotic Core and Growing Tumor Area than in the Peritumoral Area of Glioblastoma Multiforme.
Korbecki J, Kojder K, Jeżewski D, Simińska D, Tarnowski M, Kopytko P, Safranow K, Gutowska I, Goschorska M, Kolasa-Wołosiuk A, Wiszniewska B, Chlubek D, Baranowska-Bosiacka I
Biomolecules 2020 May 7;10(5)
Biomolecules 2020 May 7;10(5)
No comments: Submit comment
Supportive validation
- Submitted by
- Invitrogen Antibodies (provider)
- Main image

- Experimental details
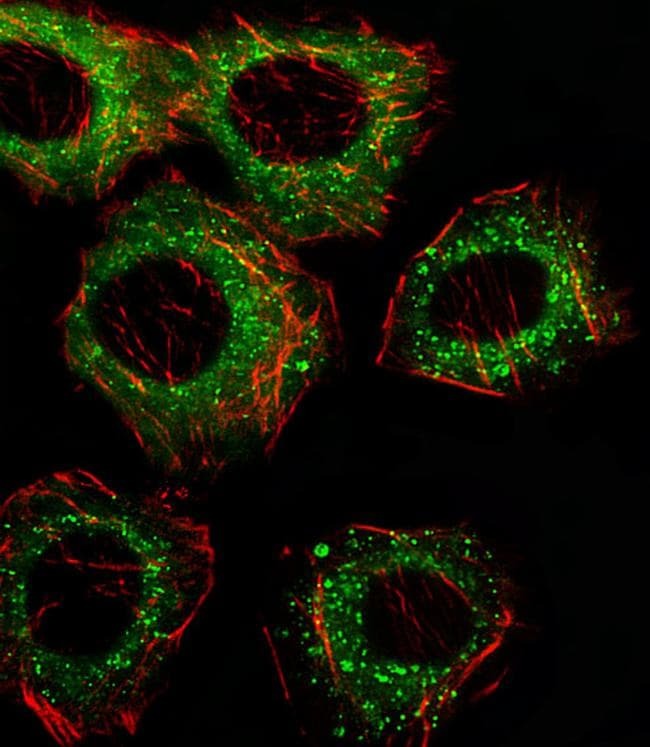
- Immunocytochemistry analysis of FADS2 in A549 cells. Samples were incubated with FADS2 polyclonal antibody (Product # PA5-48353) using a dilution of 1:25 for 1 h at 37°C followed by Alexa Fluor® 488 conjugated donkey anti-rabbit antibody (green) at a dilution of 1:400 for 50 min at 37°C. Cells were fixed with 4% PFA (20 min) and permeabilized with Triton X-100 (0.1%, 10 min). Cytoplasmic actin was counterstained with Alexa Fluor® 555 (red) conjugated Phalloidin (7 units/mL, 1 h at 37°C). FADS2 immunoreactivity is localized to Cytoplasm and Vesicles significantly.
Supportive validation
- Submitted by
- Invitrogen Antibodies (provider)
- Main image
- Experimental details
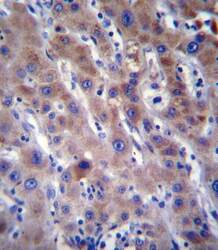
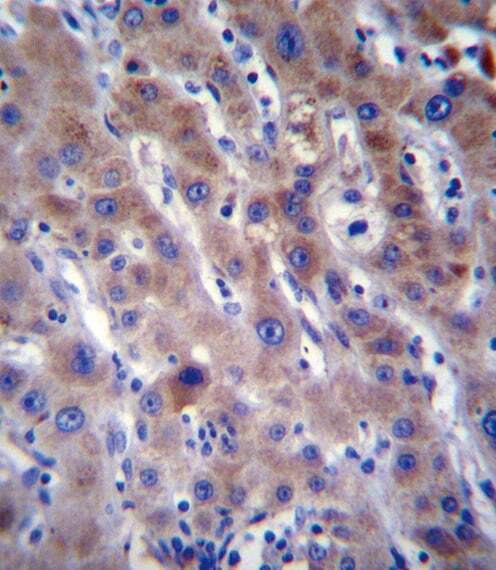
- Immunohistochemistry analysis of FADS2 in formalin fixed and paraffin embedded human liver tissue. Samples were incubated with FADS2 polyclonal antibody (Product # PA5-48353) followed by peroxidase conjugation of the secondary antibody and DAB staining. This data demonstrates the use of this antibody for immunohistochemistry. Clinical relevance has not been evaluated.
Supportive validation
- Submitted by
- Invitrogen Antibodies (provider)
- Main image
- Experimental details
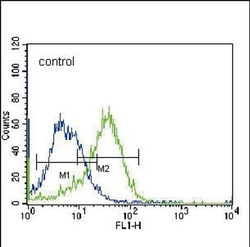
- Flow cytometric analysis of FADS2 in K562 cells (right histogram) compared to a negative control cell (left histogram). Samples were probed with a FADS2 Antibody (N-term) (Product # PA5-48353). FITC-conjugated donkey-anti-rabbit secondary antibodies were used for the analysis.

- Submitted by
- Invitrogen Antibodies (provider)
- Main image
- Experimental details
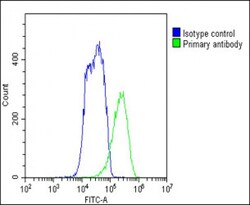
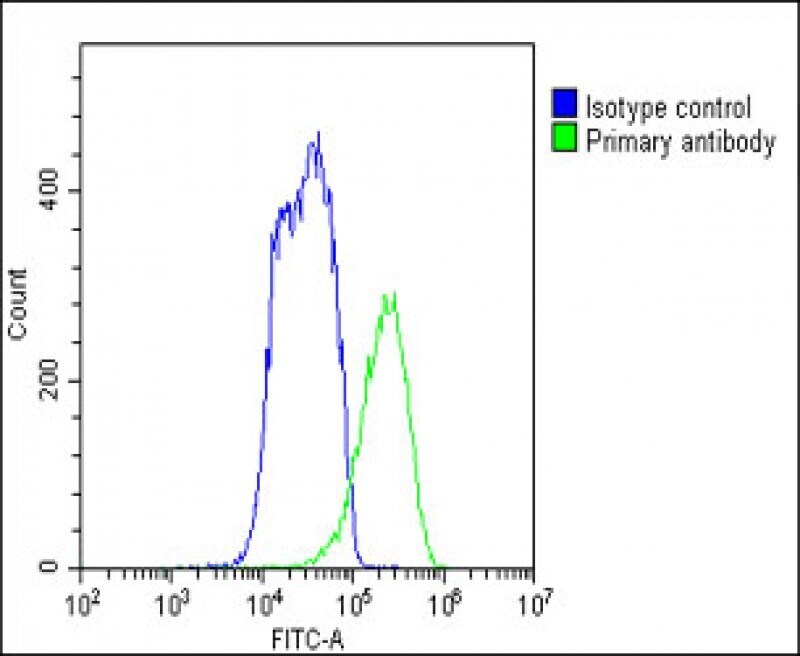
- Flow cytometry of (overlay histogram) of FADS2 in HepG2 cells (green line). Samples were incubated with FADS2 polyclonal antibody (Product # PA5-48353) using a dilution of 1:25 dilution for 60 min at 37°C followed by Goat-Anti-Rabbit IgG, DyLight® 488 Conjugated Highly Cross-Adsorbed at 1:200 dilution for 40 min at 37°C. The cells were fixed with 2% paraformaldehyde 10 min. The cells were then incubated in 2% bovine serum albumin to block non-specific protein-protein interactions followed by the primary antibody. Isotype control antibody (blue line) was rabbit IgG1 (1 μg/1x10^6 cells) used under the same conditions. Acquisition of >10, 000 events was performed.
Supportive validation
- Submitted by
- Invitrogen Antibodies (provider)
- Main image

- Experimental details
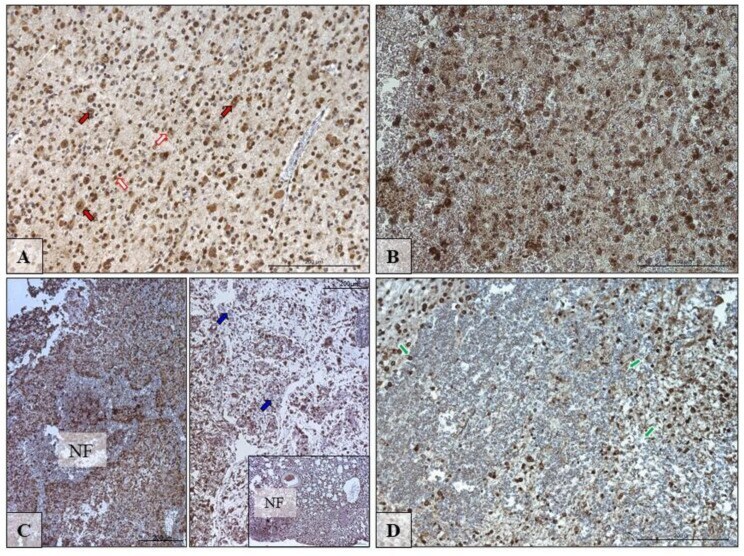
- Figure 5 Representative microphotographs showing the protein expression of desaturase FADS2 in neurons and glia cells in the peritumoral area ( A ; red and white arrows) and in cells in the growing tumor area ( B ) necrotic foci (NF) ( C , D ; blue arrows) of brain tumors from patients diagnosed with glioblastoma. Please note that on microphotography of GTA/NC, there are many pathologically changed regions of the brain tissue that indicate brain cell necrosis envelope by hypercellular zones (HcZ), with additional microvascular hyperplasia (green arrows). There are microphotographs from different objective (obj. magnification: A , x20, C x20, B , D x40); scale bars are 200 um or 100 um.