Explore
 Validate
 Learn
Learn Western blot
 Immunocytochemistry
Antibody data
- Antibody Data
- Antigen structure
- References [3]
- Comments [0]
- Validations
- Immunocytochemistry [5]
- Other assay [3]
Submit
Validation data
Reference
Comment
Report error
- Product number
- MA1-810A - Provider product page

- Provider
- Invitrogen Antibodies
- Product name
- RARA Monoclonal Antibody (Ralpha10)
- Antibody type
- Monoclonal
- Antigen
- Synthetic peptide
- Description
- MA1-810A detects retinoic acid receptor (RAR) alpha from human, rat and mouse tissues and overexpressed cells. This antibody does not detect any of the RAR beta or gamma forms. MA1-810A has been successfully used in Western blot and ICC/IF procedures. By Western blot, this antibody detects a single ~45 kDa protein representing RAR alpha in transfected COS cells. Due to the extremely low levels of RAR expressed in native tissues, it is recommended that sensitive detection systems, such as enhanced chemiluminescence, be used. The apparent molecular weight of RAR alpha from transfected COS cells is ~45 kDa. In rat tissues, such as skin and testis, doublets in the ~50 kDa area are seen. RAR alpha has been identified with this antibody in human dermal and neonatal fibroblast cell lines, as well as mouse F9 and human SH-SY5Y cells; however, RAR alpha from human leukocytes and HUT102 cells were not identified by MA1-810 suggesting that there may be structural variation of RAR alpha between some cell types. The MA1-810A immunogen is a synthetic peptide corresponding to residues C(444) S P S L S P S S H R S S P A T Q S P(462) of mouse RAR alpha. This peptide (Cat. # PEP-004) is available for use in neutralization and control experiments. Reconstitute with PBS.
- Reactivity
- Human, Mouse, Rat
- Host
- Mouse
- Isotype
- IgG
- Antibody clone number
- Ralpha10
- Vial size
- 50 μg
- Concentration
- Conc. Not Determined
- Storage
- -20°C, Avoid Freeze/Thaw Cycles
Submitted references Enhancer architecture-dependent multilayered transcriptional regulation orchestrates RA signaling-induced early lineage differentiation of ESCs.
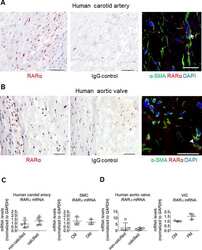
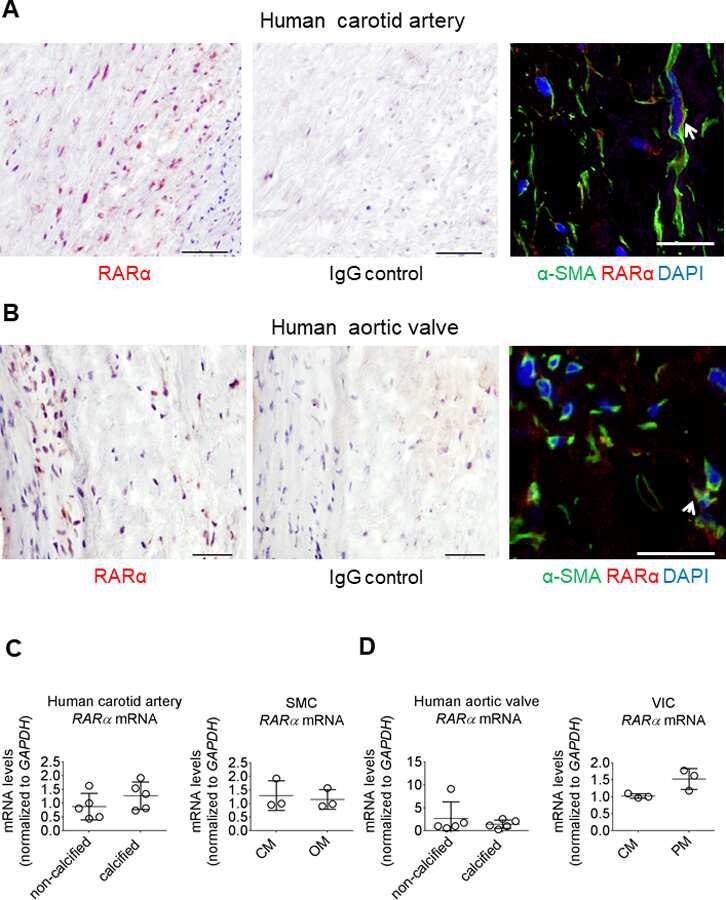
Retinoids Repress Human Cardiovascular Cell Calcification With Evidence for Distinct Selective Retinoid Modulator Effects.
Insoluble, speckled cytosolic distribution of retinoic acid receptor alpha protein as a marker of hepatic stellate cell activation in vitro.
Su G, Wang W, Zhao X, Chen J, Zheng J, Liu M, Bi J, Guo D, Chen B, Zhao Z, Shi J, Zhang L, Lu W
Nucleic acids research 2021 Nov 18;49(20):11575-11595
Nucleic acids research 2021 Nov 18;49(20):11575-11595
Retinoids Repress Human Cardiovascular Cell Calcification With Evidence for Distinct Selective Retinoid Modulator Effects.
Rogers MA, Chen J, Nallamshetty S, Pham T, Goto S, Muehlschlegel JD, Libby P, Aikawa M, Aikawa E, Plutzky J
Arteriosclerosis, thrombosis, and vascular biology 2020 Mar;40(3):656-669
Arteriosclerosis, thrombosis, and vascular biology 2020 Mar;40(3):656-669
Insoluble, speckled cytosolic distribution of retinoic acid receptor alpha protein as a marker of hepatic stellate cell activation in vitro.
Mezaki Y, Yamaguchi N, Yoshikawa K, Miura M, Imai K, Itoh H, Senoo H
The journal of histochemistry and cytochemistry : official journal of the Histochemistry Society 2009 Jul;57(7):687-99
The journal of histochemistry and cytochemistry : official journal of the Histochemistry Society 2009 Jul;57(7):687-99
No comments: Submit comment
Supportive validation
- Submitted by
- Invitrogen Antibodies (provider)
- Main image

- Experimental details
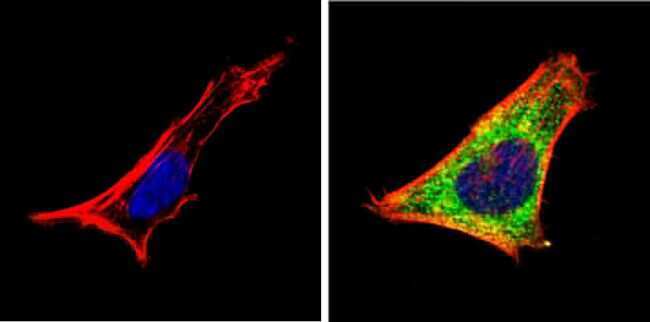
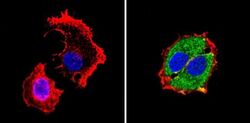
- Immunofluorescent analysis of Retinoic Acid Receptor alpha (green) showing staining in the cytoplasm of SH-SY5Y cells (right) compared to a negative control without primary antibody (left). Formalin-fixed cells were permeabilized with 0.1% Triton X-100 in TBS for 5-10 minutes and blocked with 3% BSA-PBS for 30 minutes at room temperature. Cells were probed with a Retinoic Acid Receptor alpha monoclonal antibody (Product # MA1-810A) in 3% BSA-PBS at a dilution of 1:100 and incubated overnight at 4 ºC in a humidified chamber. Cells were washed with PBST and incubated with a DyLight-conjugated secondary antibody in PBS at room temperature in the dark. F-actin (red) was stained with a fluorescent red phalloidin and nuclei (blue) were stained with Hoechst or DAPI. Images were taken at a magnification of 60x.
- Submitted by
- Invitrogen Antibodies (provider)
- Main image
- Experimental details
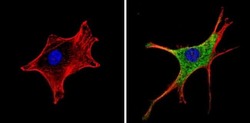
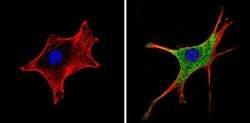
- Immunofluorescent analysis of Retinoic Acid Receptor alpha (green) showing staining in the cytoplasm of NIH-3T3 cells (right) compared to a negative control without primary antibody (left). Formalin-fixed cells were permeabilized with 0.1% Triton X-100 in TBS for 5-10 minutes and blocked with 3% BSA-PBS for 30 minutes at room temperature. Cells were probed with a Retinoic Acid Receptor alpha monoclonal antibody (Product # MA1-810A) in 3% BSA-PBS at a dilution of 1:100 and incubated overnight at 4 ºC in a humidified chamber. Cells were washed with PBST and incubated with a DyLight-conjugated secondary antibody in PBS at room temperature in the dark. F-actin (red) was stained with a fluorescent red phalloidin and nuclei (blue) were stained with Hoechst or DAPI. Images were taken at a magnification of 60x.
- Submitted by
- Invitrogen Antibodies (provider)
- Main image

- Experimental details
- Immunofluorescent analysis of Retinoic Acid Receptor alpha (green) showing staining in the cytoplasm of SH-SY5Y cells (right) compared to a negative control without primary antibody (left). Formalin-fixed cells were permeabilized with 0.1% Triton X-100 in TBS for 5-10 minutes and blocked with 3% BSA-PBS for 30 minutes at room temperature. Cells were probed with a Retinoic Acid Receptor alpha monoclonal antibody (Product # MA1-810A) in 3% BSA-PBS at a dilution of 1:100 and incubated overnight at 4 ºC in a humidified chamber. Cells were washed with PBST and incubated with a DyLight-conjugated secondary antibody in PBS at room temperature in the dark. F-actin (red) was stained with a fluorescent red phalloidin and nuclei (blue) were stained with Hoechst or DAPI. Images were taken at a magnification of 60x.

- Submitted by
- Invitrogen Antibodies (provider)
- Main image
- Experimental details
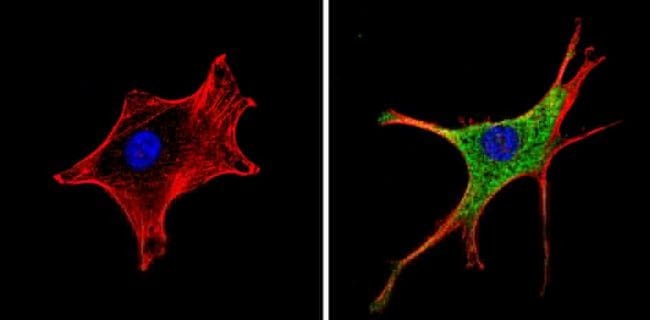
- Immunofluorescent analysis of Retinoic Acid Receptor alpha (green) showing staining in the cytoplasm of MCF-7 cells (right) compared to a negative control without primary antibody (left). Formalin-fixed cells were permeabilized with 0.1% Triton X-100 in TBS for 5-10 minutes and blocked with 3% BSA-PBS for 30 minutes at room temperature. Cells were probed with a Retinoic Acid Receptor alpha monoclonal antibody (Product # MA1-810A) in 3% BSA-PBS at a dilution of 1:100 and incubated overnight at 4 ºC in a humidified chamber. Cells were washed with PBST and incubated with a DyLight-conjugated secondary antibody in PBS at room temperature in the dark. F-actin (red) was stained with a fluorescent red phalloidin and nuclei (blue) were stained with Hoechst or DAPI. Images were taken at a magnification of 60x.

- Submitted by
- Invitrogen Antibodies (provider)
- Main image
- Experimental details
- Immunofluorescent analysis of Retinoic Acid Receptor alpha (green) showing staining in the cytoplasm of NIH-3T3 cells (right) compared to a negative control without primary antibody (left). Formalin-fixed cells were permeabilized with 0.1% Triton X-100 in TBS for 5-10 minutes and blocked with 3% BSA-PBS for 30 minutes at room temperature. Cells were probed with a Retinoic Acid Receptor alpha monoclonal antibody (Product # MA1-810A) in 3% BSA-PBS at a dilution of 1:100 and incubated overnight at 4 ºC in a humidified chamber. Cells were washed with PBST and incubated with a DyLight-conjugated secondary antibody in PBS at room temperature in the dark. F-actin (red) was stained with a fluorescent red phalloidin and nuclei (blue) were stained with Hoechst or DAPI. Images were taken at a magnification of 60x.

Supportive validation
- Submitted by
- Invitrogen Antibodies (provider)
- Main image
- Experimental details
- NULL
- Submitted by
- Invitrogen Antibodies (provider)
- Main image

- Experimental details
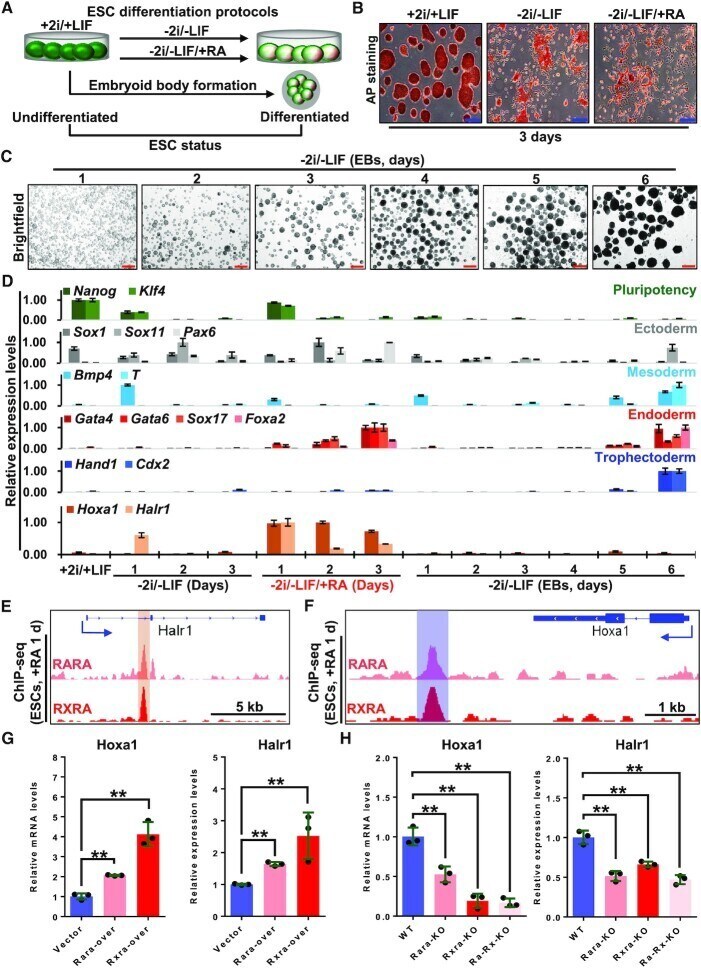
- Figure 1. Hoxa1 and Halr1 are direct downstream target genes of RA signaling. ( A ) Schematic showing ESC differentiation protocols. ( B ) Images showing AP staining of undifferentiated and differentiated ESCs. Scale bars: 100 mum. ( C ) Bright-field images of EBs on days 1-6. Scale bars: 200 mum. ( D ) qRT-PCR data showing transcript levels of pluripotency and germ layer genes as well as Halr1 and Hoxa1 during ESC differentiation ( n = 3 replicates). ( E and F ) ChIP-seq data showing RARA and RXRA binding peaks at Halr1 and Hoxa1 loci on day 1 of RA-induced ESC differentiation. ( G ) qRT-PCR data showing Halr1 and Hoxa1 transcript levels in ESCs overexpressing RARA and RXRA on day 1 of RA treatment. Data represent the mean +- SD ( n = 3 replicates). Statistical significance was determined by a two-tailed Student's t -test (unpaired), * P < 0.05, ** P < 0.01. ( H ) qRT-PCR data showing Halr1 and Hoxa1 transcript levels in WT or KO on day 1 of RA treatment. Data represent the mean +- SD ( n = 3 replicates). Statistical significance was determined by a two-tailed Student's t -test (unpaired), * P < 0.05, ** P < 0.01.
- Submitted by
- Invitrogen Antibodies (provider)
- Main image
- Experimental details
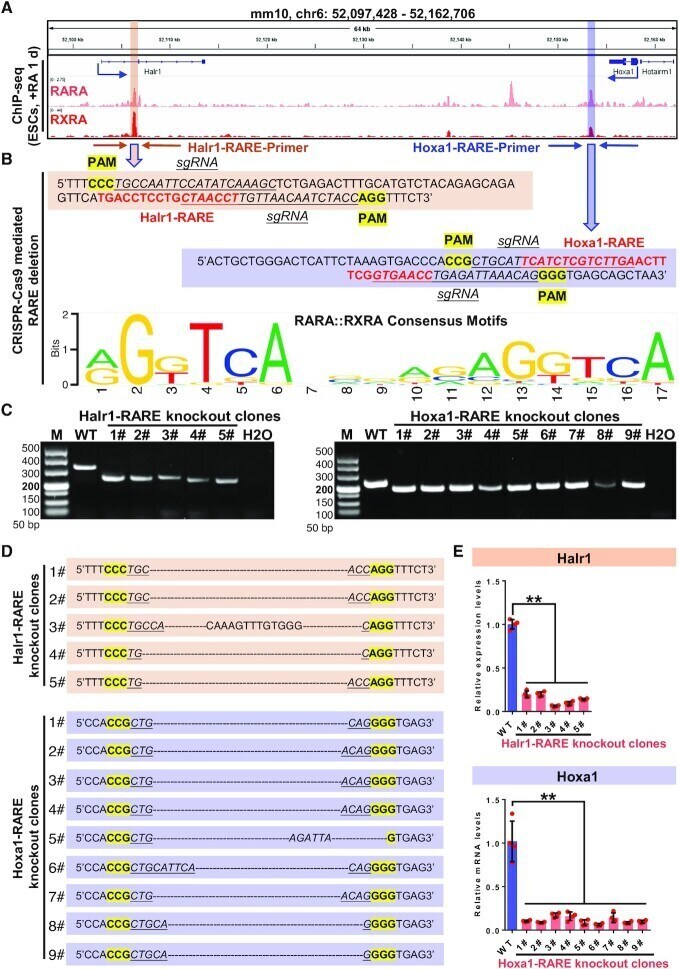
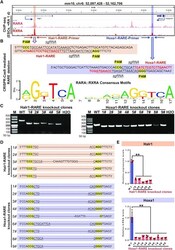
- Figure 2. RAREs are required for RA signaling-induced Hoxa1 and Halr1 expression. ( A ) ChIP-seq data showing RARA and RXRA binding peaks at Halr1 and Hoxa1 loci in ESCs on day 1 of RA treatment. ( B ) JASPAR prediction of RAREs at the Halr1-Hoxa1 locus, the RARA/RXRA binding structural domain, and the CRISPR-Cas9-mediated RARE knockout scheme. ( C ) Agarose gel electrophoresis showing RARE knockout clones using primers shown in ( B ). ( D ) Sanger sequencing of PCR products in ( C ). ( E ) qRT-PCR showing Halr1 and Hoxa1 transcript levels in RARE knockout cells. Data represent the mean +- SD ( n = 4 replicates). Statistical significance was determined by a two-tailed Student's t -test (unpaired), * P < 0.05, ** P < 0.01. M: DNA ladder marker.