Explore
 Validate
 Learn
Learn Western blot
Antibody data
- Antibody Data
- Antigen structure
- References [1]
- Comments [0]
- Validations
- Western blot [1]
- Immunocytochemistry [1]
- Other assay [2]
Submit
Validation data
Reference
Comment
Report error
- Product number
- PA5-84258 - Provider product page

- Provider
- Invitrogen Antibodies
- Product name
- ADAM19 Polyclonal Antibody
- Antibody type
- Polyclonal
- Antigen
- Recombinant full-length protein
- Description
- Immunogen sequence: IIPQWKTSES PVREKHPLKA ELRVMAEGRE LILDLEKNEQ LFAPSYTETH YTSSGNPQTT TRKLEDHCFY HGTVRETELS SVTLSTCRGI RGLITVSSNL SYVIEPLPDS KGQHLIYRSE HLKPPPGNCG FEHSKP
- Reactivity
- Human
- Host
- Rabbit
- Isotype
- IgG
- Vial size
- 100 µL
- Concentration
- 0.2 mg/mL
- Storage
- Store at 4°C short term. For long term storage, store at -20°C, avoiding freeze/thaw cycles.
Submitted references Construction and Analysis of a ceRNA Network in Cardiac Fibroblast During Fibrosis Based on in vivo and in vitro Data.
Gao QY, Zhang HF, Chen ZT, Li YW, Wang SH, Wen ZZ, Xie Y, Mai JT, Wang JF, Chen YX
Frontiers in genetics 2020;11:503256
Frontiers in genetics 2020;11:503256
No comments: Submit comment
Supportive validation
- Submitted by
- Invitrogen Antibodies (provider)
- Main image
- Experimental details
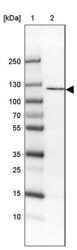
- Western blot analysis of ADAM19 by a ADAM19 polyclonal antibody (Product # PA5-84258). Lane 1: Marker [kDa] 250, 130, 100, 70, 55, 35, 25, 15, 10 Lane 2: Human cell line U-251 MG.

Supportive validation
- Submitted by
- Invitrogen Antibodies (provider)
- Main image
- Experimental details
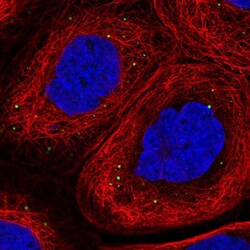
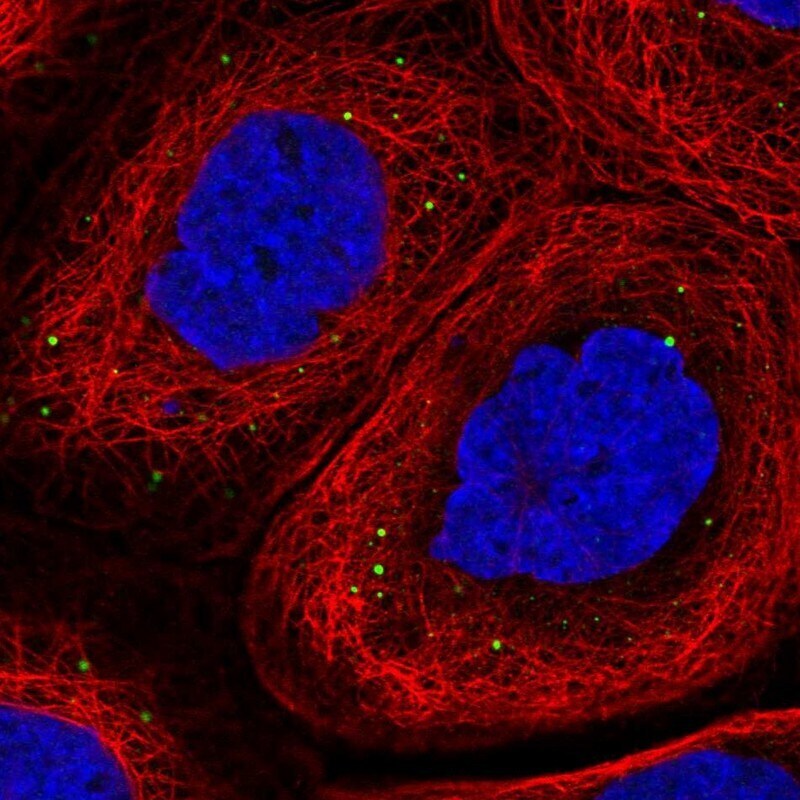
- Immunofluorescent analysis of ADAM19 in A-431 cells using a ADAM19 polyclonal antibody (Product # PA5-84258). The analysis shows localization to vesicles.
Supportive validation
- Submitted by
- Invitrogen Antibodies (provider)
- Main image
- Experimental details
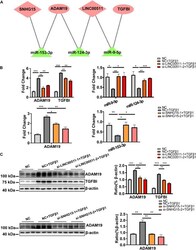
- FIGURE 5 Construction and validation of a cardiac fibrosis ceRNA network. (A) ceRNA network of cardiac fibroblast-specific differentially expressed genes during fibrosis. Pink indicates up-regulated genes and green indicates down-regulated genes. (B) RT-qPCR validation for quantitative dynamic changes of three microRNA and two mRNA under LINC00511 and LncRNA SNHG15 depletion. (C) Dynamic changes in protein level of ADAM19 and TGFBI . n = 3 per group. * P < 0.05, ** P < 0.01, *** P < 0.001.

- Submitted by
- Invitrogen Antibodies (provider)
- Main image
- Experimental details
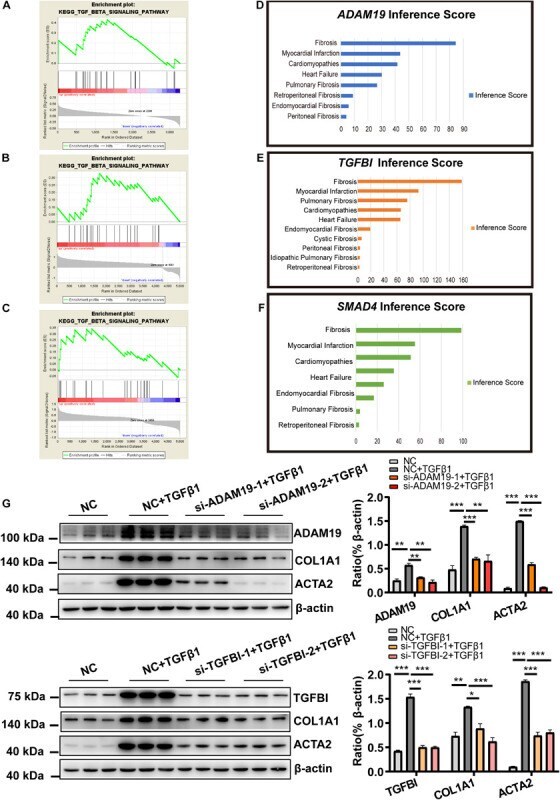
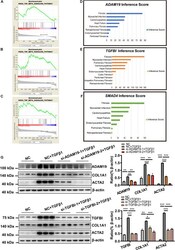
- FIGURE 6 Functional analysis of mRNA in the ceRNA network ( ADAM19 and TGFBI ). (A) Enriched TGF-beta1 signaling pathway for TGFBI in the GSE116250 dataset. (B) Enriched TGF-beta1 signaling pathway for TGFBI in the GSE97358 dataset. (C) Enriched TGF-beta1 signaling pathway for ADAM19 in the GSE116250 dataset. (D) Inference Score for ADAM19 . (E) Inference Score for TGFBI . (F) Inference Score for SMAD4 . (G) Knockdown of expression of ADAM19 and TGFBI reduced expression of myofibroblast-associated genes. n = 3 per group. * P < 0.05, ** P < 0.01, *** P < 0.001.